KEY EVENTS TO WATCH FOR:
Wednesday, June 14, 2023
7:00 AM ET. MBA Weekly Mortgage Applications Survey
Composite Idx (previous 194.7)
Composite Idx, W/W% (previous -1.4%)
Purchase Idx-SA (previous 151.7)
Purchase Idx-SA, W/W% (previous -1.7%)
Refinance Idx (previous 409.7)
Refinance Idx, W/W% (previous -0.7%)
8:30 AM ET. May PPI
PPI, M/M% (expected -0.1%; previous +0.2%)
Ex-Food & Energy PPI, M/M% (expected +0.2%; previous +0.2%)
Personal Consumption (previous +0.4%)
10:00 AM ET. SEC Small Business Advisory Committee
10:30 AM ET. EIA Weekly Petroleum Status Report
Crude Oil Stocks (Bbl) (previous 459.205M)
Crude Oil Stocks, Net Chg (Bbl) (previous -0.452M)
Gasoline Stocks (Bbl) (previous 218.815M)
Gasoline Stocks, Net Chg (Bbl) (previous +2.745M)
Distillate Stocks (Bbl) (previous 111.731M)
Distillate Stocks, Net Chg (Bbl) (previous +5.074M)
Refinery Usage (previous 95.8%)
Total Prod Supplied (Bbl/day) (previous 19.221M)
Total Prod Supplied, Net Chg (Bbl/day) (previous -0.221M)
2:00 PM ET. Federal Reserve economic projections
Median Fed Funds Rate - 2022
Median Fed Funds Rate - 2023 (previous 5.1%)
Median Fed Funds Rate - 2024 (previous 4.3%)
2:00 PM ET. U.S. interest rate decision
Federal Funds Rate
Federal Funds Rate Change (Pts)
Fed Funds Rate-Range High (previous 5.25)
Fed Funds Rate-Range Low (previous 5.00)
FOMC Vote For Action (previous 11)
FOMC Vote Against Action (previous 0)
Discount Rate (previous 5.25
Discount Rate Change (Pts) (previous +0.25)
Discount Rate-Range High
Discount Rate-Range Low
The STOCK INDEXES? http://quotes.ino.com/ex?changes/?c=indexes
The STOCK INDEXES: The September NASDAQ 100 was higher overnight as it extends this year's rally. Overnight trading set the stage for a higher opening when the day session begins trading. Stochastics and the RSI are overbought but remain neutral to bullish signaling that sideways to higher prices are possible near-term. If June extends this year's rally, the 75% retracement level of the 2021-2022-decline on the weekly continuation chart crossing at 15,202.41 is the next upside target. Closes below the 20-day moving average crossing at 14,468.00 would signal that a short-term top has been posted. First resistance is the 75% retracement level of the 2021-2022-decline on the weekly continuation chart crossing at 15,202.41. Second resistance is the March-2022 high on the weekly continuation chart crossing at 15,268.75. First support is the 20-day moving average crossing at 14,468.00. Second support is the 50-day moving average crossing at 13,790.94.
The September S&P 500 was steady to higher overnight as it extends the rally off March's low. Overnight trading sets the stage for a higher opening when the day session begins trading. Stochastics and the RSI are overbought but remain neutral to bullish signaling that sideways to higher prices are possible near-term. If June extends the rally off March's low, the 75% retracement level of the 2022 decline crossing at 4505.40 is the next upside target. Closes below the 20-day moving average crossing at 4287.98 would signal that a short-term top has been posted. First resistance the overnight high crossing at 4428.00. Second resistance is the 75% retracement level of the 2022 decline crossing at 4505.40. First support is the 10-day moving average crossing at 4349.50. Second support is the 20-day moving average crossing at 4287.98.
INTEREST RATES http://quotes.ino.com/ex changes/?c=interest"
INTEREST RATES: September T-bonds were slightly higher overnight. Overnight trading sets the stage for a slightly higher opening when the day session begins trading. Stochastics and the RSI have turned neutral to bearish signaling that sideways to lower prices are possible near-term. If September renews the decline off April's high, the 87% retracement level of the March-April rally crossing at 124-19 is the next downside target. Closes above last-Wednesday's high crossing at 128-16 would signal that a short-term low has been posted. First resistance is the June 1st high crossing at 129-16. Second resistance is the 50-day moving average crossing at 129-23. First support is the 75% retracement level of the March-April rally crossing at 125-30. Second support is the 87% retracement level of the March-April rally crossing at 124-19.
September T-notes were slightly higher overnight as it consolidates some of Tuesday's sharp decline. Overnight trading sets the stage for a slightly higher opening when the day session begins trading. Stochastics and the RSI are oversold but remain neutral to bearish signaling that sideways to lower prices are possible near-term. If September extends the decline off May's high, the 87% retracement level of the March rally crossing at 111.243 is the next downside target. Closes above the 20-day moving average crossing at 113.285 would signal that a short-term low has been posted. First resistance is the 20-day moving average crossing at 113.285. Second resistance is the June 1st high crossing at 115.000. First support is the 75% retracement level of the March-May rally crossing at 112.190. Second support is the 87% retracement level of the 2022-2023 rally crossing at 111.243.
ENERGY MARKETS? http://quotes.ino.com/ex?changes/?c=energy ""
ENERGIES:Julycrude oil was higher overnight as it consolidates some of this month's loss. Overnight trading sets the stage for a higher opening when the day session begins trading. Stochastics and the RSI are turning neutral to bullish signaling that sideways to higher prices are possible near-term. Closes below the May 31st low crossing at $67.03 would open the door for a possible test of May's low crossing at $63.90. Closes above the 20-day moving average crossing at $71.23 would signal that a short-term low has been posted. Closes above the May 5th high crossing at $75.06 would mark an upside breakout of the May-June trading range and would signal the resumption of the rally off May's low. First resistance is the 20-day moving average crossing at $71.23. Second resistance is the June 5th high crossing at $75.06. First support is Monday's low crossing at $66.80. Second support is the May low crossing at $63.90.
July heating oil was slightly higher overnight and set sets the stage for a slightly higher opening when the day session begins trading. Stochastics and the RSI are neutral to bullish signaling that sideways to higher prices are possible near-term. Closes above the 50-day moving average crossing at 2.4167 would open the door for additional gains and a possible test of the April 25th high crossing at 2.5325. Closes below the May 31st low crossing at 2.2268 would open the door for a possible test of May's low crossing at 2.1550. First resistance is the 50-day moving average crossing at 2.4167. Second resistance is the April 25th high crossing at 2.5332. First support is the May 31st low crossing at 2.2268. Second support is May's low crossing at 2.1550.
July unleaded gas was higher overnight as it consolidates some of Monday's loss and sets the stage for a higher opening when the day session begins trading. Stochastics and the RSI are neutral to bearish signaling that sideways to lower prices are possible near-term. If July extends the decline off last-Thursday's high, the June 1st low crossing at 2.4016 is the next downside target. If July renews the rally off May's low, the 87% retracement level of the April-May decline crossing at $2.6958 is the next upside target. First resistance is the 87% retracement level of the April-May decline crossing at $2.6958. Second resistance is April's high crossing at $2.7675. First support is the June 1st low crossing at 2.4016. Second support is the May 15th low crossing at 2.3565.
July natural gas was slightly higher overnight and sets the stage for a slightly higher opening when the day session begins trading. Stochastics and the RSI are neutral to bullish signaling that sideways to higher prices are possible near-term. Closes above the 50-day moving average crossing at 2.462 would signal that a short-term low has been posted. If July renews the decline off March's high, the September-2020 low on the monthly continuation chart crossing at 1.795 is the next downside target. First resistance is the 50-day moving average crossing at 2.462. Second resistance is the May 19th high crossing at 2.816. First support is the June 1st low crossing at 2.136. Second support is the September-2020 low on the monthly continuation chart crossing at 1.795.
CURRENCIEShttp://quotes.ino.com/ex changes/?c=currencies"
CURRENCIES:The September Dollar was lower overnight and sets the stage for a lower opening when the day session begins trading later this morning. Stochastics and the RSI are neutral to bearish signaling that sideways to lower prices are possible near-term. If September extends the decline off May's high, the 50-day moving average crossing at $102.077 is the next downside target. If September renews the rally off May's low, the 38% retracement level of the 2022-2023 decline crossing at $104.932 is the next upside target. First resistance is the March 15th high crossing at $104.250. Second resistance is the 38% retracement level of the 2022-2023 decline crossing at $104.932.First support is Tuesday's low crossing at $102.525. Second support is the 50-day moving average crossing at $102.077.
The September Euro was higher overnight as it extends the rally off May's low. Overnight trading sets the stage for a higher opening when the day session begins trading. Stochastics and the RSI are neutral to bullish signaling that sideways to higher prices are possible near-term. If September extends the rally off May's low, the 50-day moving average crossing at $1.09564 is the next upside target. If September renews the decline off April's high, the 38% retracement level of the 2022-2023 rally crossing at 1.06472 is the next downside target. First resistance is Tuesday's high crossing at $1.08810. Second resistance is the 50-day moving average crossing at $1.09564. First support is the 38% retracement level of the 2022-2023 rally crossing at 1.06472. Second support is the 50% retracement level of the 2022-2023 rally crossing at 1.04833.
The September British Pound was higher overnight as it extends the rally off May's low. Overnight trading sets the stage for a higher opening when the day session begins trading. Stochastics and the RSI are overbought but remain neutral to bullish signaling that sideways to higher prices near-term. If September extends the rally off May's low, May's high crossing at 1.2705 is the next upside target. Closes below the 20-day moving average crossing at 1.2482 would signal that a short-term top has been posted. First resistance is the overnight high crossing at 1.2667. Second resistance is the May 10th high crossing at 1.2705. First support is the 20-day moving average crossing at 1.2482. Second support is May's low crossing at 1.2333.
The September Swiss Franc was higher overnight and sets the stage for a higher opening when the day session begins trading. Stochastics and the RSI are neutral to bullish signaling that sideways to higher prices are possible near-term. If September extends the rally off May's low, the 50-day moving average crossing at 1.12840 is the next upside target. If September resumes the decline off May's high, the 38% retracement level of the 2022-2023 rally crossing at 1.10197 is the next downside target. First resistance is the 50-day moving average crossing at 1.12840. Second resistance is May's high crossing at 1.14920. First support is May's low crossing at 1.10700. Second support is the 38% retracement level of the 2022-2023 rally crossing at 1.10197.
The September Canadian Dollar was higher overnight. Overnight trading sets the stage for a higher opening when the day session begins trading. Stochastics and the RSI are overbought but remain neutral to bullish signaling that sideways to higher prices are possible near-term. If September extends the rally off the May 26th low, the November 11th-2022 high crossing at $75.91 is the next upside target. Closes below the 50-day moving average crossing at $74.39 would signal that a short-term top has been posted. First resistance is the overnight high crossing at $75.39. Second resistance is the November 11th-2022 high crossing at $75.91. First support is the 50-day moving average crossing at $74.39. Second support is April's low crossing at $73.39.
The September Japanese Yen was steady to slightly higher overnight as it extends the trading range of the past four-weeks. Overnight trading sets the stage for a slightly higher opening when the day session begins trading. Stochastics and the RSI are neutral to bearish signaling that sideways to lower prices are possible near-term. If September renews the decline off the March's high, the 87% retracement level of the 2022-2023 rally crossing at 0.070777 is the next downside target. Closes above the June 1st high crossing at 0.073430 would signal that a short-term low has been posted. First resistance is the June 1st high crossing at 0.073430. Second resistance is the 50-day moving average crossing at 0.074833. First support is the 75% retracement level of the 2022-2023 rally crossing at 0.072174. Second support is the 87% retracement level of the 2022-2023 rally crossing at 0.070777.
PRECIOUS METALS http://quotes.ino.com/ex changes/?c=metals"
Precious Metals: Augustgold was slightly higher overnight as it extends the trading range of the past five-weeks. Overnight trading sets the stage for a slightly higher opening when the day session begins trading later this morning. Stochastics and the RSI are neutral to bearish signaling that sideways to lower prices are possible near-term. If August renews the decline off May's high, the 38% retracement level of the September-May rally crossing at $1941.90 is the next downside target. Closes above the 50-day moving average crossing at $2013.80 would signal that a short-term low has been posted. First resistance is the 50-day moving average crossing at $2013.80. Second resistance is the May 4th high crossing at $2102.20. First support is the 38% retracement level of the September-May rally crossing at $1941.90. Second support is the 50% retracement level of the September-May rally crossing at $1892.30.
July silver was higher overnight and sets the stage for a higher opening when the day session begins trading later this morning. Stochastics and the RSI are turning neutral to bearish signaling that sideways to lower prices are possible near-term. Closes below last-Monday's low crossing at $23.320 would signal that a short-term top has been posted. If July extends the rally off May's low, the 50-day moving average crossing at $24.692 is the next upside target. First resistance is last-Friday's high crossing at $24.620. Second resistance is the 50-day moving average crossing at $24.692. First support is the 20-day moving average crossing at 23.726. Second support is May's low crossing at $22.785.
July copper was higher overnight and sets the stage for a higher opening when the day session begins trading. Stochastics and the RSI are overbought but remain neutral to bullish signaling that sideways to higher prices are possible near-term. Closes above the 50-day moving average crossing at 3.8469 would open the door for a possible test of the May 8th high crossing at 3.9595 is the next upside target. Closes below the 20-day moving average crossing at 3.7195 would temper the near-term friendly outlook. First resistance is the 50-day moving average crossing at 3.8469. Second resistance is the May 8th high crossing at 3.9595. First support is the 20-day moving average crossing at 3.7195. Second support is May's low crossing at 3.5450.
GRAINS http://quotes.ino.com/ex changes/?c=grains
Grains: September corn was lower overnight as it consolidates some of the rally off May's low. Overnight trading sets the stage for a lower opening when the day sessions begins trading. Stochastics and the RSI are overbought and are turning neutral to bearish signaling that sideways to lower prices are possible near-term. Closes below last-Thursday's low crossing at $5.14 1/2 would signal that a short-term top has been posted.If September extends the rally off May's low, the 38% retracement level of the 2022-2023 decline crossing at $5.68 1/4 is the next upside target. First resistance is Tuesday's highcrossing at $5.55. Second resistance is the 38% retracement level of the 2022-2023 decline crossing at $5.68 1/4. First support is last-Thursday's low crossing at $5.14 1/2. Second support is the May 31st low crossing at $5.05 3/4.
September wheat was lower overnight and sets the stage for a lower opening when the day session begins trading. Stochastics and the RSI are neutral to bullish signaling that sideways to higher prices are possible near-term. If September extends the rally off May's low, May's high crossing at $6.80 is the next upside target. Closes below the 20-day moving average crossing at $6.29 1/2 would signal that a short-term top has been posted. First resistance is the 50-day moving average crossing at $6.56. Second resistance is May's high crossing at $6.80. First support is last-Thursday's low crossing at $6.23 1/4. Second support is May's low crossing at $5.87 3/4.
September Kansas City wheat was lower overnight and sets the stage for a lower opening when the day session begins trading later this morning. Stochastics and the RSI are turning neutral to bearish signaling that sideways to lower prices are possible near-term. If September renews the decline off June's high, the May 31st low crossing at $7.61 3/4 is the next downside target. Closes above the 50-day moving average crossing at $8.18 3/4 would signal that a short-term low has been posted. First resistance is the 50-day moving average crossing at $8.18 3/4. Second resistance is June's high crossing at $8.41. First support is the May 31st low crossing at $7.61 3/4. Second support is May's low crossing at $7.33.
September Minneapolis wheat was lower overnight and sets the stage for a lower opening when the day session begins trading. Stochastics and the RSI are turning neutral to bearish signaling that sideways to lower prices are possible near-term. Closes below the May 7th low crossing at $7.92 3/4 would renew the decline off decline off June's high. Closes above the 50-day moving average crossing at $8.32 1/2 would open the door for additional gains and a possible test of May's high crossing at $8.89 1/2. First resistance is the 50-day moving average crossing at $8.32 1/2. Second resistance is June's high crossing at $8.39 3/4. First support is the May 31st low crossing at $7.78 1/4. Second support is May's low crossing at $7.71 3/4.
SOYBEAN COMPLEX? http://quotes.ino.com/ex?changes/?c=grains "
July soybeans were lower overnight as it consolidates some of the rally off May's low. Overnight trading sets the stage for a lower opening when the day session begins trading later this morning. Stochastics and the RSI are overbought but remain neutral to bullish signaling that sideways to higher prices are possible near-term. If July extends the aforementioned rally, May's high crossing at $14.46 3/4 is the next upside target. Closes below the 20-day moving average crossing at $13.44 would temper the near-term friendly outlook. First resistance is the 50-day moving average crossing at $14.00 3/4. Second resistance is May's high crossing at $14.46 3/4. First support is the 20-day moving average crossing at $13.44. Second support is May's low crossing at $12.70 3/4.
July soybean meal was slightly lower overnight and sets the stage for a slightly lower opening when the day session begins trading. Stochastics and the RSI are neutral to bullish signaling that sideways to higher prices are possible near-term. Closes above last-Thursday's high crossing at $408.40 would signal that a short-term low has been posted while opening the door for additional gains near-term. If July renews the decline off March's high, the 62% retracement level of the 2020-2023 rally crossing at $365.60 is the next downside target. First resistance is last-Thursday's high crossing at $408.40. Second resistance is the 50-day moving average crossing at $424.60. First support is the 50% retracement level of the 2020-2023 rally crossing at $388.80. Second support is the 62% retracement level of the 2020-2023 rally crossing at $365.60.
July soybean oil was slightly lower overnight as it consolidates some of the rally off May's low. Overnight trading sets the stage for a steady to slightly lower opening when the day session begins trading. Stochastics and the RSI are overbought but remain neutral to bullish signaling that sideways to higher prices are possible near-term. If July extends the rally off May's low, the April 18th high crossing at 56.21 is the next upside target. Closes below the 20-day moving average crossing at 49.76 would signal that a short-term top has been posted. First resistance is the April 18th high crossing at 56.21. Second resistance is April's high crossing at 57.51. First support is the 50-day moving average crossing at 51.71. Second support is the 20-day moving average crossing at 49.75.
Thanks tallpine!
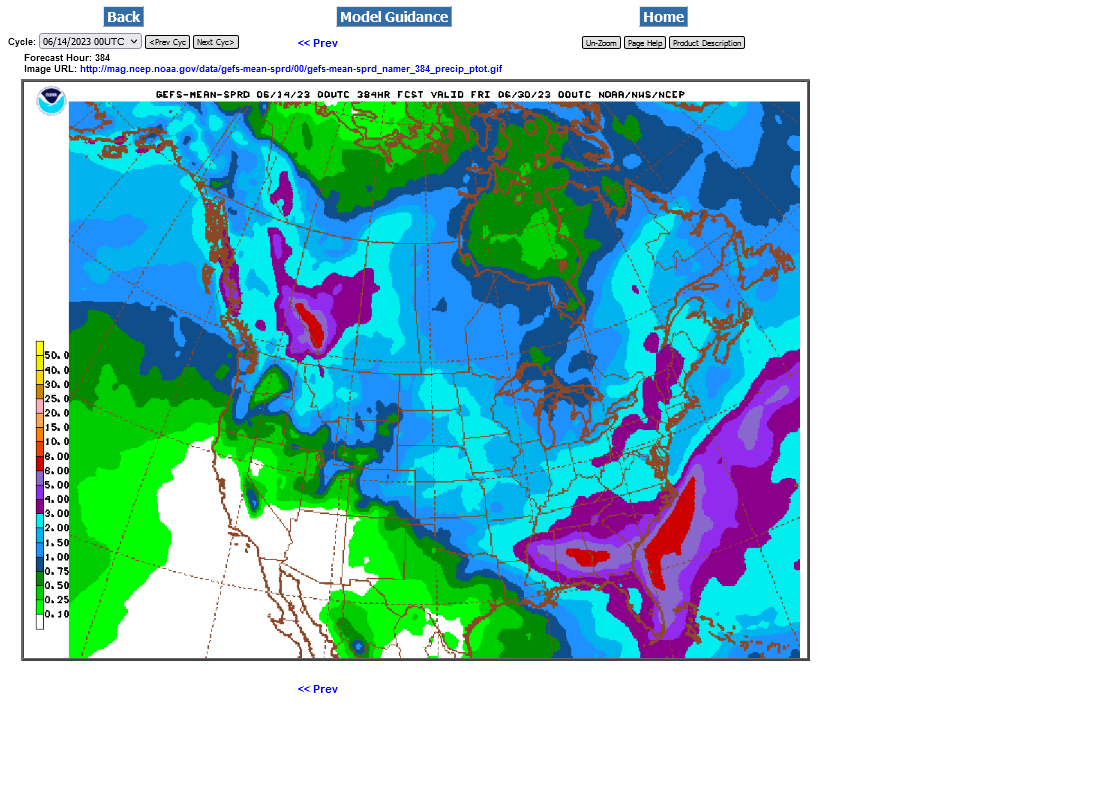
Rains just increased a bit more overnight: 2 weeks 0z GEFS below.
Sunday nights gap was filled in CN and in fact, we left a 2 day island top in the CN as described yesterday.
CN is -10c early this morning. Rains in week 2 continue to increase a tiny bit and the belief that El Nino will add more late this month is pressuring all he grains.
The CZ gap higher is still open and that month continues with the bullish posture until the gap gets filled. If rains continue to increase, it WILL be filled and be a gap and crap.
If rains get taken out, we can go up again.
++++++++++++
Previous post
By metmike - June 13, 2023, 8:16 p.m.
From this assessment earlier:
https://www.marketforum.com/forum/topic/96234/#96247
"However, CNs gap is from 608-609 and we closed -5c at 612. With the weather pretty bullish today and SN +30c much of the time, this is a strong indicator that front month corn is running out of steam.
A gap lower tonight, unfilled would put in an island reversal lower for CN which is a really REALLY bad/bearish technical formation."
+++++++++++++
We did small gap open lower and have dropped to lower than that Sunday Night open and filled any tiny remaining bullish gap for CN.
Currently -4c for CN and at the moment, looking pretty bearish but the other months and every month for S is looking BULLISH.
CZ is only -2.5c and still holding the very bullish technical formation. However, bull markets are almost always led by the front month.
Don't be long either C or S if rains continue to increase but its a weather market.
If we come in next week with no rain, all the markets will go nuts like they did in 2012......until rains show up in the forecast.
+++++++++
In a weather market, technical formations are only valid when the weather stays the same.
Changes in the weather forecast ALWAYS TRUMP what the price did yesterday which tells us what the market thought about the weather forecast YESTERDAY!