KEY EVENTS TO WATCH FOR:
Wednesday, June 7, 2023
7:00 AM ET. MBA Weekly Mortgage Applications Survey
Composite Idx (previous 197.4)
Composite Idx, W/W% (previous -3.7%)
Purchase Idx-SA (previous 154.4)
Purchase Idx-SA, W/W% (previous -2.5%)
Refinance Idx (previous 412.5)
Refinance Idx, W/W% (previous -6.9%)
8:30 AM ET. April U.S. International Trade in Goods & Services
Trade Balance (USD) (expected -75.6B; previous -64.23B)
Exports (USD) (previous 256.15B)
Exports, M/M% (previous +2.1%)
Imports (USD) (previous 320.38B)
Imports, M/M% (previous -0.3%)
10:00 AM ET. SEC Open Meeting
10:00 AM ET. May Online Help Wanted Index
10:30 AM ET. EIA Weekly Petroleum Status Report
Crude Oil Stocks (Bbl) (previous 459.657M)
Crude Oil Stocks, Net Chg (Bbl) (previous +4.489M)
Gasoline Stocks (Bbl) (previous 216.07M)
Gasoline Stocks, Net Chg (Bbl) (previous -0.207M)
Distillate Stocks (Bbl) (previous 106.657M)
Distillate Stocks, Net Chg (Bbl) (previous +0.985M)
Refinery Usage (previous 93.1%)
Total Prod Supplied (Bbl/day) (previous 19.442M)
Total Prod Supplied, Net Chg (Bbl/day) (previous -1.259M)
3:00 PM ET. April Consumer Credit
Consumer Credit Net Chg (USD) (expected +22.0B; previous +26.5B)
The STOCK INDEXES? http://quotes.ino.com/ex?changes/?c=indexes
The Dow closed lower on Tuesday as it consolidates some of the rally off May's low.Today's mid-range close sets the stage for a steady to lower opening when Wednesday's day session begins trading. Stochastics and the RSI are neutral to bullish signaling that sideways to higher prices are possible near-term. If the Dow extends the rally off May's low, May's high crossing at 34,257.83 is the next upside target. Closes below last-Thursday's low crossing at 32,704.51 would signal that a short-term top has been posted. First resistance is last-Friday's high crossing at 33,792.14. Second resistance is May's high crossing at 34,257.83. First support is last-Thursday's low crossing at 32,704.51. Second support is May's low crossing at 32,586.56. Third support is the 38% retracement level of the October-December rally crossing at 32,399.25.
The June NASDAQ 100 closed slightly lower on Tuesday. The mid-range close sets the stage for a steady to lower opening when Wednesday's day session begins trading. Stochastics and the RSI are overbought but remain neutral to bullish signaling sideways to higher prices are possible. If June extends this year's rally, the 87% retracement level of the 2022-decline crossing at 14,801.49 is the next upside target. Closes below the 20-day moving average crossing at 13,918.00 would signal that a short-term top has been posted. First resistance is Monday's high crossing at 14,694.75. Second resistance is the 87% retracement level of the 2022-decline crossing at 14,801.49. First support is the 10-day moving average crossing at 14,259.35. Second support is the 20-day moving average crossing at 13,918.00.
The June S&P 500 closed slightly higher on Tuesday. The mid-range close sets the stage for a steady to higher opening when Wednesday's day session begins trading. Stochastics and the RSI are overbought but remain neutral to bullish signaling that sideways to higher prices are possible near-term. If June extends the rally off March's low, the 62% retracement level of 2022's decline crossing at 4321.54 is the next upside target. Closes below the 20-day moving average crossing at 4188.94 would confirm that a short-term top has been posted. First resistance is today's high crossing at 4305.75. Second resistance is the 62% retracement level of 2022's decline crossing at 4321.54. First support is the 20-day moving average crossing at 4188.94. Second support is the 50-day moving average crossing at 4152.95.
INTEREST RATES? http://quotes.ino.com/ex?changes/?c=interest ""
September T-bonds closed up 1/32's at 127-31.
September T-bonds closed slightly higher on Monday. The high-range close sets the stage for a steady to higher opening when Tuesday's day session begins trading. Stochastics and the RSI are neutral to bullish signaling that sideways to higher prices are possible near-term. Closes above last-Thursday's high crossing at 129-16 would confirm that a short-term low has been posted while opening the door for additional gains near-term. If September renews the decline off April's high, the 87% retracement level of the March- April rally crossing at 124-19 is the next downside target. First resistance is last-Thursday's high crossing at 129-16. Second resistance is the 50-day moving average crossing at 130-09. First support is the 75% retracement level of the March-April rally crossing at 125-30. Second support is the 87% retracement level of the March- April rally crossing at 124-19.
September T-notes closed lower 35-pts. At 113.245.
June T-notes closed lower on Tuesday. The low-range close sets the stage for a steady to lower opening when Wednesday's day session begins trading. Stochastics and the RSI are neutral signaling that sideways to lower prices are possible near-term. Closes above last-Thursday's high crossing at 115.000 would signal that a short-term low has been posted. If June renews the decline off May's high, the 75% retracement level of March's rally crossing at 112.190 is the next downside target. First resistance is last-Thursday's high crossing at 115.000. Second resistance is the 50-day moving average crossing at 115.174. First support is the 75% retracement level of March's rally crossing at 112.190. Second support is the 87% retracement level of March's rally crossing at 111.243.
ENERGY MARKETS? http://quotes.ino.com/ex?changes/?c=energy ""
July crude oil closed slightly lower on Tuesday. The high-range close sets the stage for a steady to slightly lower opening when Wednesday's day session begins. Stochastics and the RSI are neutral to bullish signaling that sideways to higher prices are possible near-term. Closes above the 50-day moving average crossing at $74.69 would confirm that a short-term low has been posted while opening the door for additional short-term gains. Closes below last-Wednesday's low crossing at $67.03 would signal that a double top has been posted with the late-May high. First resistance is the 50-day moving average crossing at $74.69. Second resistance is the April 28th high crossing at $76.74. First support is last-Wednesday's low crossing at $67.03. Second support is May's low crossing at $63.90.
July heating oil closed slightly lower on Tuesday. The high-range close sets the stage for a steady to higher opening when Wednesday's day trading session begins. Stochastics and the RSI are neutral to bullish signaling that sideways to higher prices are possible near-term. Closes above the 50-day moving average crossing at $2.4364 would signal that a short-term low has been posted. If July renews the decline off April's high, May's low crossing at $2.1550 is the next downside target. First resistance is the 50-day moving average crossing at $2.4364. Second resistance is the April 25th high crossing at $2.5326. First support is last-Wednesday's low crossing at $2.2268. Second support is May's low crossing at $2.1550.
July unleaded gas closed higher on Tuesday as it extends the rally off last-Thursday's low. The high-range close sets the stage for a steady to higher opening when Wednesday's day session begins trading. Stochastics and the RSI have turned neutral to bullish signaling that sideways to higher prices are possible near-term. If July extends the rally off last-Thursday's low, the 75% retracement level of the April-May decline crossing at 2.6803 is the next upside target. If July renews the decline off May's high, the May 15th low crossing at 2.3565 is the next downside target. First resistance is the 75% retracement level of the April-May decline crossing at 2.6803. Second resistance is the 87% retracement level crossing at 2.6979. First support is the May 15th low crossing at 2.3565. Second support is May's low crossing at 2.2132.
July Henry natural gas closed slightly higher on Tuesday as it consolidated some of the decline off May's high. The high-range close sets the stage for a steady to higher opening when Wednesday's day session begins trading. Stochastics and the RSI are oversold but remain neutral to bearish signaling that sideways to lower prices are possible near-term. If July renews the decline off March's high, the September-2020 low on the monthly continuation chart crossing at 1.795 is the next downside target. Closes above the 50-day moving average crossing at 2.506 would signal that a short-term low has been posted. First resistance is the 20-day moving average crossing at 2.424. Second resistance is the 50-day moving average crossing at 2.506. First support is last-Thursday's low crossing at 2.136. Second support is the September-2020 low on the monthly continuation chart crossing at 1.795.
CURRENCIES? http://quotes.ino.com/ex?changes/?c=currencies ""
The June Dollar closed slightly higher on Tuesday as it consolidates above the 25% retracement level of the September-February decline crossing at $103.586. The high-range close sets the stage for a steady to higher opening when Wednesday's session begins trading. Stochastics and the RSI are turning neutral to bearish signaling that sideways to lower prices are possible near-term. Closes below the 20-day moving average crossing at 103.305 would signal that a short-term top has been posted. If June extends the rally off May's low, the March 15th high crossing at 104.720 is the next upside target. First resistance is the March 15th high crossing at 104.720. Second resistance is the March 8th high crossing at 105.490. First support is the 20-day moving average crossing at 103.305. Second support is the 50-day moving average crossing at 102.228.
The June Euro closed lower on Tuesday. The low-range close sets the stage for a steady to lower opening when Wednesday's day session begins trading. Stochastics and the RSI are turning neutral to bearish signaling that sideways to lower prices is possible near-term. If June extends the decline off May's high, the 38% retracement level of the 2022-2023 rally crossing at $1.05914 is the next downside target. Closes above the 20-day moving average crossing at $1.08135 would signal that a short-term low has been posted. First resistance is the 20-day moving average crossing at $1.08135. Second resistance is the 50-day moving average crossing at 1.09252. First support is last-Wednesday's low crossing at $1.06470. Second support is the 38% retracement level of the 2022-2023 rally crossing at $1.05914.
The June British Pound closed lower on Tuesday. The mid-range close sets the stage for a steady to lower opening when Wednesday's day session begins trading. Stochastics and the RSI are neutral to bearish signaling sideways to lower prices are possible near-term. If June resumes the decline off May's high, the 25% retracement level of the 2022-2023 rally crossing at 1.2138 is the next downside target. If June renews last-week's rally, May's high crossing at 1.2692 is the next upside target. First resistance is last-Friday's high crossing at 1.2549. Second resistance is May's high crossing at 1.2692. First support is May's low crossing at 1.2314. Second support is April's low crossing at 1.2293.
The June Swiss Franc closed lower on Tuesday. The low-range close sets the stage for a steady to lower opening when Wednesday's day session begins trading. Stochastics and the RSI are neutral to bullish signaling that sideways to higher prices are possible near-term. Closes above the 50-day moving average crossing at 1.11721 would signal that a short-term low has been posted. If June resumes the decline off May's high, the 38% retracement level of 2022-2023 rally crossing at 1.09131 is the next downside target. First resistance is the 50-day moving average crossing at 1.11721. Second resistance is the May 4th high crossing at 1.13940. First support is the 38% retracement level of 2022-2023 rally crossing at 1.09131. Second support is the 50% retracement level of 2022-2023 rally crossing at 1.07646.
The June Canadian Dollar closed higher on Tuesday as it extends the rally off May's low. The high-range close sets the stage for a steady to higher opening when Wednesday's day session begins trading. Stochastics and the RSI are overbought but remain neutral to bullish signaling that sideways to higher prices are possible near-term. If June extends the aforementioned rally, May's high crossing at 75.18 is the next upside target. Closes below the 10-day moving average crossing at 73.97 would signal that a short-term top has been posted. First resistance is today's high crossing at 74.70. Second resistance is May's high crossing at 75.18. First support is the 10-day moving average crossing at 73.97. Second support is May's low crossing at 73.27.
The June Japanese Yen closed slightly lower on Tuesday. The low-range close sets the stage for a steady to lower opening when Wednesday’s day session begins trading. Stochastics and the RSI are turning neutral to bullish signaling that sideways to higher prices are possible near-term. Closes above the 20-day moving average crossing at 0.072759 would signal that a short-term low has been posted. If June extends the decline off March's high, the 87% retracement level of the October-January rally crossing at 0.069908 is the next downside target. First resistance is the 20-day moving average crossing at 0.072759. Second resistance is the 50-day moving average crossing at 0.074390. First support is the 75% retracement level of the October-January rally crossing at 0.071337. Second support is the 87% retracement level of the October-January rally crossing at 0.069908.
PRECIOUS METALS? http://quotes.ino.com/ex?changes/?c=metals ""
August gold closed higher on Tuesday as it extends the trading range of the past four-weeks. The high-range close sets the stage for a steady to higher opening when Wednesday's day session begins trading. Stochastics and the RSI are neutral signaling that sideways trading is possible near-term. If August renews the decline off May's high, the 38% retracement level of the 2022-2023 rally crossing at $1925.20. Closes above the 50-day moving average crossing at $2018.50 would signal that a short-term low has been posted. First resistance is the 20-day moving average crossing at $2000.50. Second resistance is the 50-day moving average crossing at $2018.50. First support is the 38% retracement level of the 2022-2023 rally crossing at $1941.90. Second support is the 50% retracement level of the 2022-2023 rally crossing at $1892.30.
July silver closed slightly higher on Tuesday. The high-range close sets the stage for a steady to higher opening when Wednesday's day session begins trading. Stochastics and the RSI are neutral to bullish signaling that sideways to higher prices are possible near-term. Closes above last-Friday's high crossing at 24.120 would signal that a short-term low has been posted. If July renews the decline off May's high, the 62% retracement level of the March-May rally crossing at 22.541 is the next downside target. First resistance is last-Friday's high crossing at 24.120. Second resistance is the 50-day moving average crossing at 24.678. First support is the 62% retracement level of the March-May rally crossing at 22.541. Second support is the 75% retracement level of the March-May rally crossing at 21.705.
July copper closed slightly higher on Tuesday as it extends the rally off May's low. The high-range close sets the stage for a steady to higher opening when Wednesday's day session begins trading. Stochastics and the RSI are overbought but remain neutral to bullish signaling that sideways to higher prices are possible near-term. If July extends the rally off May's low, the 50-day moving average crossing at 3.8821 is the next upside target. If July renews the decline off April's high, the 75% retracement level of the 2022-2023 rally crossing at 3.4383 is the next downside target. First resistance is last-Friday's high crossing at 3.7890. Second resistance is the 50-day moving average crossing at 3.8821. First support is the 75% retracement level of the 2022-2023 rally crossing at 3.4683. Second support is the 87% retracement level of the 2022-2023 rally crossing at 3.3261.
GRAINS? http://quotes.ino.com/ex?changes/?c=grains "
July Corn closed down $0.10 1/2-cents at $6.08.
July corn posted an inside day with a higher close on Tuesday. The high-range close sets the stage for a steady to higher opening when Wednesday's night session begins trading. Stochastics and the RSI are overbought but remain neutral to bullish signaling that sideways to higher prices are possible near-term. If July extends the rally off May's low, the 75% retracement level of the April-May decline crossing at $6.22 1/2 is the next upside target. Closes below last-Friday's low crossing at $5.81 1/4 would temper the near-term friendly outlook. First resistance is Monday's high crossing at $6.14. Second resistance is the 75% retracement level of the April-May decline crossing at $6.22 1/2. First support is last-Wednesday's low crossing at $5.77 1/2. Second support is May's low crossing at $5.47.
July wheat closed up $0.03 1/4-cents at $6.27 1/4.
July wheat closed higher on Tuesday as it extends the rally off last-Wednesday's low. The low-range close sets the stage for a steady to slightly higher opening when Wednesday's day session begins trading. Stochastics and the RSI are neutral to bullish signaling signaling that sideways to higher prices are possible near-term. Closes above the 50-day moving average crossing at $6.53 3/4 would open the door for a possible test of May's high crossing at $6.69 later this week. If July renews the decline off February's high, the March-2021 low crossing at $5.71 is the next downside target. First resistance is the 50-day moving average crossing at $6.669. Second resistance is May's high crossing at $6.48. First support is last-Wednesday's low crossing at $5.73 1/4. Second support is the March-2021 low crossing at $5.71.
July Kansas City Wheat closed down $0.02-cents at $8.20 1/4.
July Kansas City wheat closed lower on Tuesday as it consolidates some of the rally off last-Wednesday's low. The mid-range close sets the stage for a steady to lower opening when Wednesday's day session begins trading. Stochastics and the RSI are turning neutral to bullish signaling that sideways to higher prices are possible near-term. Closes above the 20-day moving average crossing at $8.36 3/4 would signal that a short-term low has been posted. If July renews the decline off May's high, the 87% retracement level of May's rally crossing at $7.59 3/4 is the next downside target. First resistance is the 20-day moving average crossing at $8.33 3/4. Second resistance is the May 10th high crossing at $8.63 3/4. First support is the 87% retracement level of May's rally crossing at $7.59 3/4. Second support is May's low crossing at $7.36 1/4.
July Minneapolis wheat closed down $0.03 3/4-cents crossing at $8.16 1/2.
July Minneapolis wheat closed lower on Tuesday as it consolidates some of the rally off last-Wednesday's low. The low-range close sets the stage for a steady to lower opening when Wednesday's day session begins trading. Stochastics and the RSI are neutral to bullish signaling that sideways to higher prices are possible near-term. Closes above the 20-day moving average crossing at $8.24 would signal that a short-term low has been posted. If July renews the decline off May's high, May's low crossing at $8.69 is the next downside target. First resistance is the 20-day moving average crossing at $8.24. Second resistance is the 50-day moving average crossing at $8.40 1/2. First support is last-Wednesday's low crossing at $7.75 1/2. Second support is May's low crossing at $7.69.
SOYBEAN COMPLEX? http://quotes.ino.com/ex?changes/?c=grains "
July soybeans closed up $0.03 1/4-cents at $13.53 1/4.
July soybeans closed slightly higher on Tuesday as it extends the rally off last-Wednesday's low. The mid-range close sets the stage for a steady to higher opening when Wednesday's day session begins trading. Stochastics and the RSI are neutral to bullish signaling that sideways to higher prices are possible near-term. If July extends the rally off last-Wednesday's low, the 50-day moving average crossing at $14.09 3/4 would signal that a low has been posted. If July renews this year's decline, the 50% retracement level of the 2020-2022 crossing at $12.12 is the next downside target. First resistance is the 20-day moving average crossing at $13.49 1/4. Second resistance is the 50-day moving average crossing at $14.09 3/4. First support is last-Wednesday's low crossing at $12.70 3/4. Second support is the 50% retracement level of the 2020-2022 crossing at $12.12.
July soybean meal closed down $4.50 at $396.70.
July soybean meal posted a key reversal down on Tuesday. The low-range close sets the stage for a steady to lower opening when Wednesday's day session begins trading. Stochastics and the RSI are turning neutral to bearish signaling that sideways to lower prices are possible near-term. If July renews the decline off March's high, the 62% retracement level of the 2020-2023 rally crossing at $365.60 is the next downside target. Closes above the 20-day moving average crossing at $410.60 would signal that a short-term low has been posted. First resistance is the 20-day moving average crossing at $410.60. Second resistance is the 50-day moving average crossing at $431.10. First support is last-Wednesday's low crossing at $386.30. Second support is the 62% retracement level of the 2020-2023 rally crossing at $365.60.
July soybean oil closed up 166-pts. at 50.92.
July soybean oil closed higher on Tuesday as it extends the rally off last-Wednesday's low.The high-range close sets the stage for a steady to higher opening when Wednesday's day session begins trading. Stochastics and the RSI are overbought but remain neutral to bullish signaling that sideways to higher prices are possible near-term. If July extends the rally off last-Wednesday's low, the 50-day moving average crossing at 51.91 is the next upside target. If July renews this year's decline, the 75% retracement level of the 2020-2022 rally crossing at 40.19 is the next downside target. First resistance is the 50-day moving average crossing at 51.91. Second resistance is May's high crossing at 55.12. First support is last-Wednesday's low crossing at 44.53. Second support is the 75% retracement level of the 2020-2022 rally crossing at 40.19.
LIVESTOCKhttp://quotes.ino.com/exchanges/?c=livestock
July hogs closed up $4.30 at $88.45.
July hogs gapped up and closed higher on Tuesday and closed the 50-day moving average crossing at $87.95. The high-range close sets the stage for a steady to higher opening when Wednesday's day session begins trading. Stochastics and the RSI are neutral to bullish signaling that sideways to higher prices are possible near-term. If July extends the rally off May's low, the April 28th high crossing at $94.00 is the next upside target. Closes below the 10-day moving average crossing at $81.60 would signal that a short-term top has been posted. First resistance is today's high crossing at $88.65 Second resistance is the April 28th high crossing at $94.00. First support is last-Wednesday's gap crossing at $79.53. Second support is May's low crossing at $74.02.
August cattle closed up $2.35 at $175.63.
August cattle closed higher on Tuesday as it extends the rally off May's low. The high-range close sets the stage for a steady to higher opening on Wednesday. Stochastics and the RSI are overbought but remain neutral to bullish signaling that sideways to higher prices are possible near-term. If August extends this year's rally unto uncharted territory, upside targets will be hard to project. Closes below the 20-day moving average crossing at $165.58 would signal that a top has been posted. First resistance is today's high crossing at $175.95. Second resistance is unknown. First support is the 10-day moving average crossing at $168.57. Second support is the 20-day moving average crossing at $165.58.
August Feeder cattle closed up $0.65 at $243.25.
August Feeder cattle closed higher on Tuesday. The high-range close sets the stage for a steady to higher opening when Wednesday's day session begins trading. Stochastics and the RSI are overbought but remain neutral to bullish signaling that sideways to higher prices are possible near-term. If August extends the rally off May's low, the October-2014 high on the monthly continuation chart crossing at $245.20 is the next upside target. Closes below the 20-day moving average crossing at $234.37 would signal that a short-term top has been posted. First resistance is today's high crossing at $244.48. Second resistance is the October-2014 high on the monthly continuation chart crossing at $245.20. First support is the 10-day moving average crossing at $238.30. Second support is the 20-day moving average crossing at $234.37.
FOOD & FIBERhttp://quotes.ino.com/ex changes/?c=food
July coffee closed lower on Tuesday. The low-range close sets the stage for a steady to lower opening on Wednesday. Stochastics and the RSI are turning neutral to bearish signaling sideways to lower prices are possible near-term. Closes above the 50-day moving average crossing at $18.50 would signal that a short-term low has been posted. If July renews the decline off April's high, March's low crossing at $16.56 is the next downside target. First resistance is the 50-day moving average crossing at $18.50. Second resistance is May's high crossing at $19.44. First support is last-Wednesday's low crossing at $17.56. Second support is March's low crossing near $16.56.
July cocoa closed lower on Tuesday as it extends the May-June trading range. The low-range close sets the stage for a steady to lower opening on Wednesday. Stochastics and the RSI are diverging but remain neutral to bullish signaling that sideways to higher prices are possible near-term. If July extends the rally off March's low, monthly resistance crossing at 32.15 is the next upside target. Closes below the 20-day moving average crossing at 30.12 would signal that a short-term top has been posted.
July sugar closed slightly higher on Tuesday, The high-range close sets the stage for a steady to higher opening on Wednesday. Stochastics and the RSI are oversold but remain neutral to bearish signaling that sideways to lower prices are possible near-term. Multiple closes below the 50-day moving average crossing at 24.55 would open the door for additional weakness near-term. Closes above last-Tuesday's high crossing at 26.22 would signal that a short-term low has been posted.
July cotton posted an inside day with a higher close on Tuesday as it consolidated some of Monday's decline. The high-range close sets the stage for a steady to higher opening on Wednesday. Stochastics and the RSI are neutral to bearish signaling sideways to lower prices are possible near-term. Closes below the 50-day moving average crossing at 82.58 would signal that a top has been posted. If July extends the rally off the May 25th low crossing at 79.86, May's high crossing at 87.98 is the next upside target.
Thanks much, Tallpine!
With the huge drop in crop ratings, many wonder why corn/beans were not up 20/40c today!
The last 12z GEFS model is your answer:
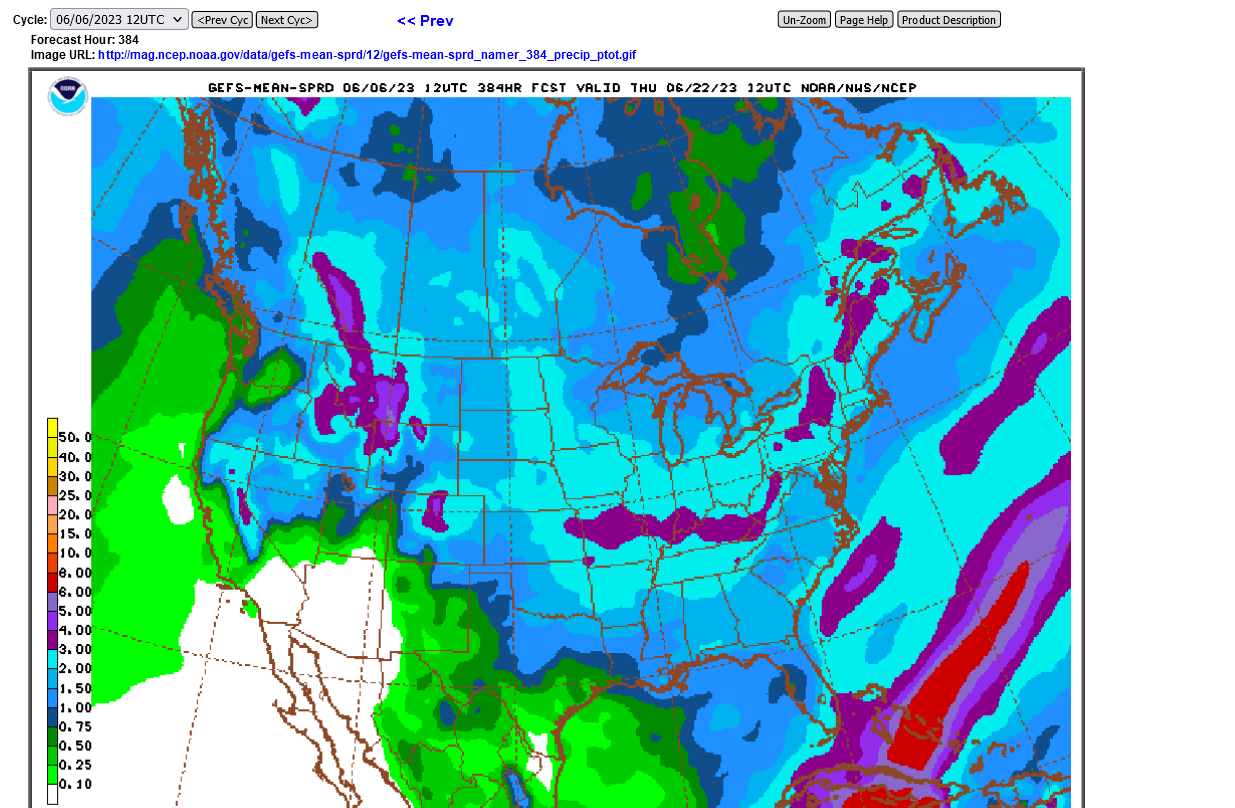
This model continues to have almost twice the rain as the much drier EE and CMC models which is where I'm still leaning though I would love the rain. The EE has only half the rain of the GEFS but the EE is also increasing rain, from its lower amounts.
Our dry spell in Evansville, IN is now the longest in almost 6 years at something like 46 days.
Markets today were insane to try to trade with spikes up and down numerous times from the bullish battle of the deteriorating crop going against the bearish increases in the rain forecast.
The 7 day NWS outlook is also increasing rains every day. This is likely the El Nino kicking in from the warming waters of the Pacific. Global warming and El Nino greatly INCREASE the odds of favorable weather in the US Cornbelt.
7 Day Total precipitation below:
http://www.wpc.ncep.noaa.govcdx /qpf/p168i.gif?1530796126

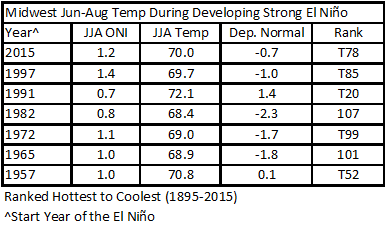
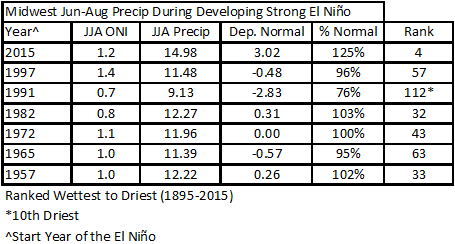
Only 1 year, 1991 featured notably hotter and drier than average growing season weather when there was a strong El Nino developing!!!
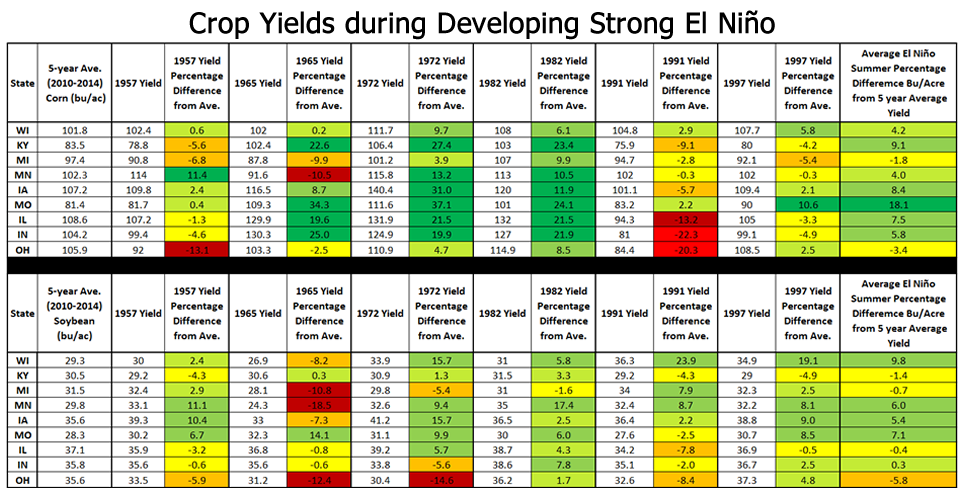
This greatly increases the odds for above trend yields this Summer for all crops in the Midwest and potential for RECORD yields.
https://mrcc.purdue.edu/mw_climate/elNino/impacts.jsp