Our seasonal/Winter COVID surge higher has passed after a peak that was LOWER than last years peak, which was MUCH lower than the peaks of the previous 2 years.
The past 3 years, you can see on the graph below that there have been 2 peaks during the year.
1 in the late Summer, followed by another (usually higher) one that occurs around the start of the new year. Possibly with some contribution from holiday gatherings.
https://covid.cdc.gov/covid-data-tracker/#trends_weeklyhospitaladmissions_select_00
![]()
Previous peaks, going backward:
This last year
January 6, 2024 = 35,118
September 9, 2023 = 20,694
+++++++++++++++
Previous year
December 31, 2022 = 44,529
July 23, 2022 = 44,730
++++++++++++++++++++++
2 years ago
January 15, 2022 = 150,650
August 28, 2021 = 85,775
3 years ago
January 8, 2021 = 115,455
Data prior to August 2020 not available. COVID hit the fan in Feb/March 2020.
Updated April 5, 2024
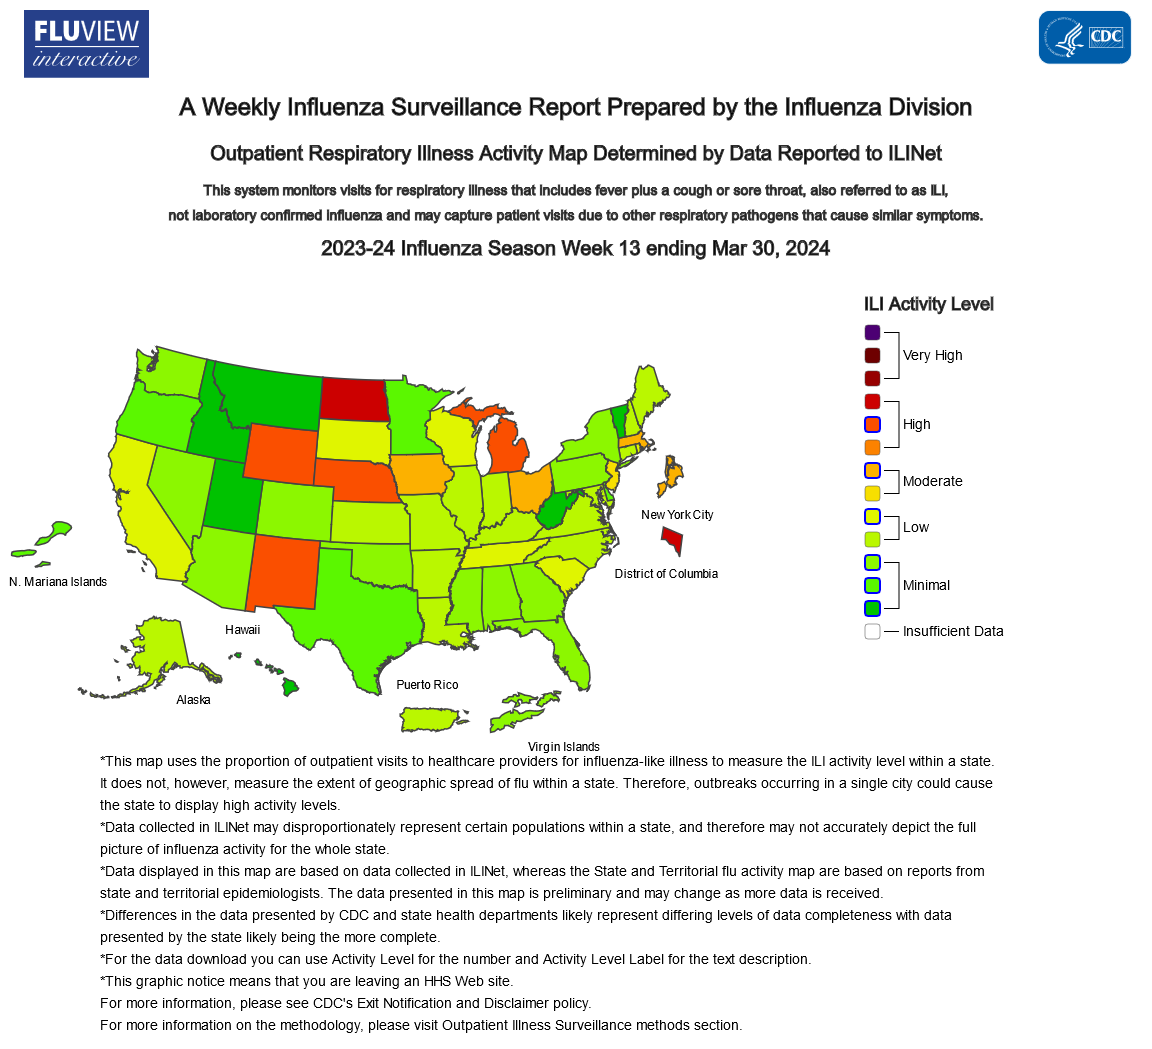
https://www.cdc.gov/flu/weekly/index.htm
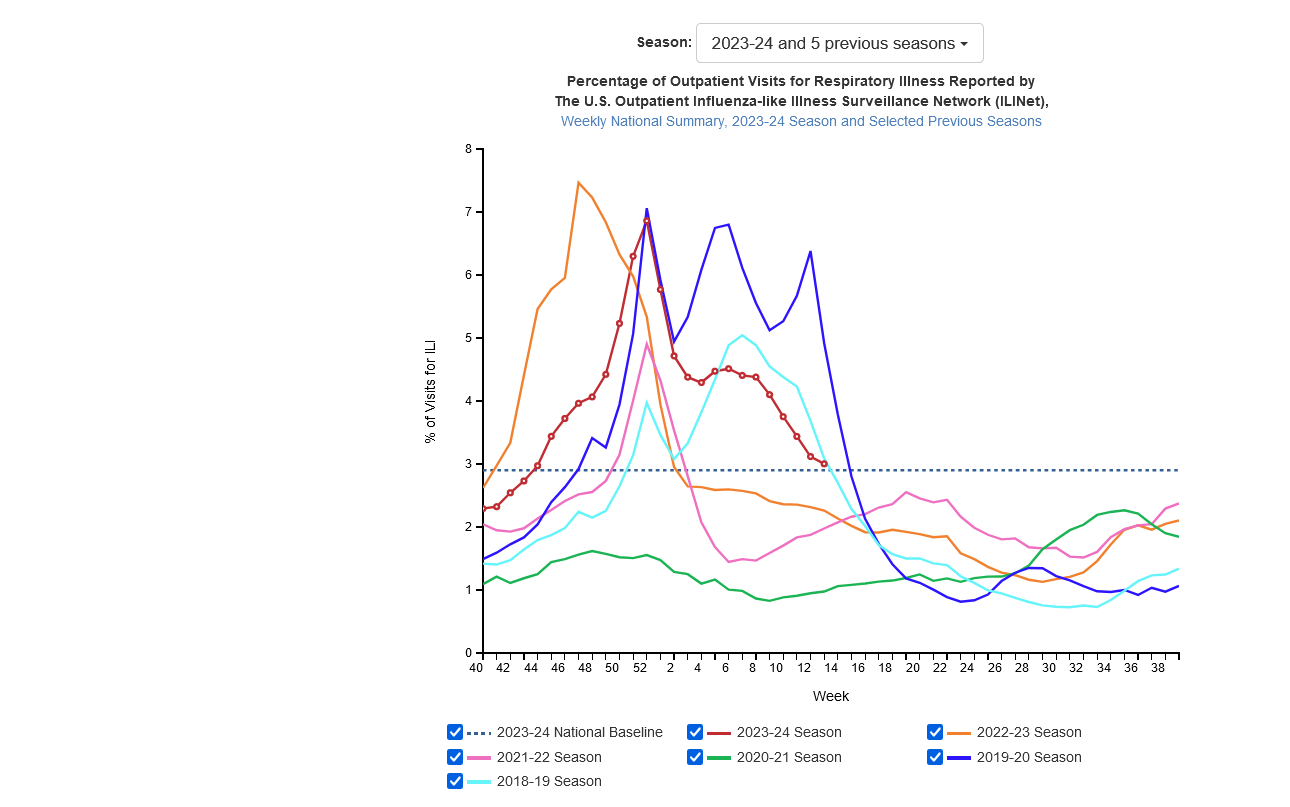
Our flu season peaked at the end of last year/start of this year.
+++++++++++++++
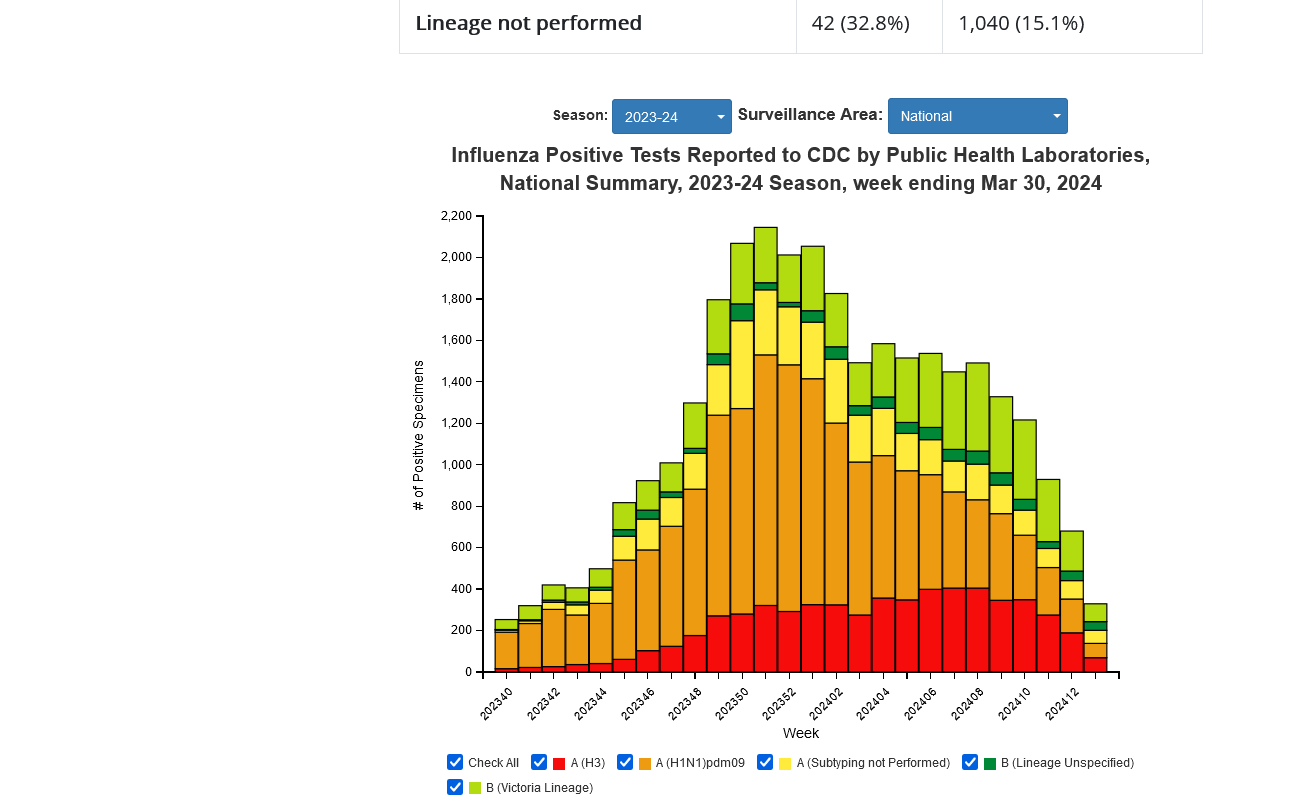
Respiratory illness also peaked then:
+++++++++++++
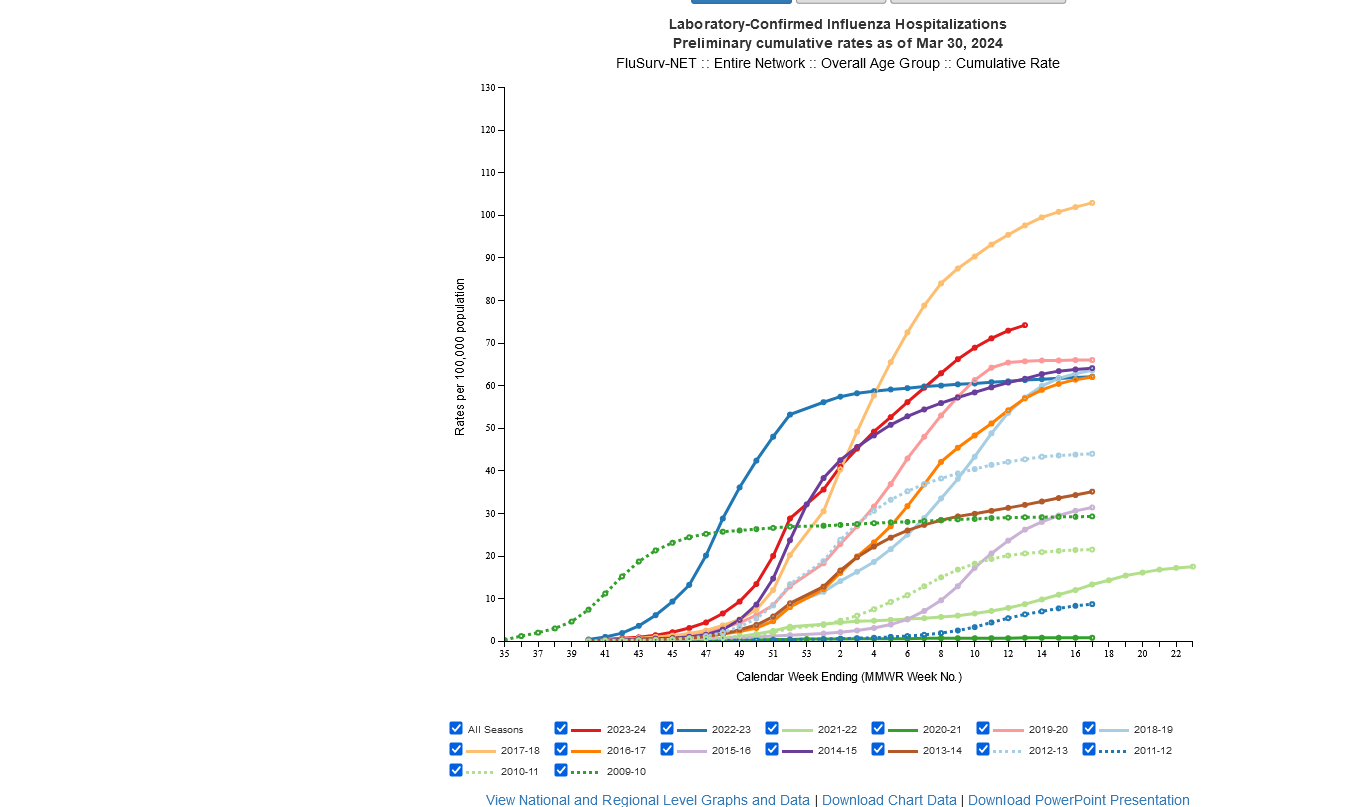
2023/24 was a pretty BAD flu season!! These are the cumulative cases. Red is the current 2023/24 total, the 2nd highest in the last decade.
2017/18 in yellow was easily the worst in the last 14 years!
Use this link to click on your own state: https://www.cdc.gov/flu/weekly/index.htm