KEY EVENTS TO WATCH FOR:
Wednesday, August 23, 2023
7:00 AM ET. MBA Weekly Mortgage Applications Survey
Composite Idx (previous 193)
Composite Idx, W/W% (previous -0.8%)
Purchase Idx-SA (previous 149.5)
Purchase Idx-SA, W/W% (previous -0.3%)
Refinance Idx (previous 408.4)
Refinance Idx, W/W% (previous -1.9%)
9:45 AM ET. August US Flash Services PMI
PMI, Services (previous 52.4)
9:45 AM ET. August US Flash Manufacturing PMI
PMI, Mfg (previous 49.0)
10:00 AM ET. July New Residential Sales
New Home Sales (previous 697K)
New Home Sales, M/M% (previous -2.5%)
New Home Sales Months Supply (previous 7.4)
10:30 AM ET. EIA Weekly Petroleum Status Report
Crude Oil Stocks (Bbl) (previous 439.662M)
Crude Oil Stocks, Net Chg (Bbl) (previous -5.96M)
Gasoline Stocks (Bbl) (previous 216.158M)
Gasoline Stocks, Net Chg (Bbl) (previous -0.262M)
Distillate Stocks (Bbl) (previous 115.743M)
Distillate Stocks, Net Chg (Bbl) (previous +0.296M)
Refinery Usage (previous 94.7%)
Total Prod Supplied (Bbl/day) (previous 21.663M)
Total Prod Supplied, Net Chg (Bbl/day) (previous +0.936M)
Thursday, August 24, 2023
8:30 AM ET. July Chicago Fed National Activity Index (CFNAI)
NAI (previous -0.32)
NAI, 3-mo Moving Avg (previous -0.16)
8:30 AM ET. July Advance Report on Durable Goods
Durable Goods-SA, M/M% (expected -4.1%; previous +4.7%)
Dur Goods, Ex-Defense, M/M% (previous +6.2%)
Dur Goods, Ex-Transport, M/M% (previous +0.6%)
Orders: Cap Gds, Non-Def, Ex-Air, M/M% (previous +0.2%)
Shipments: Cap Gds, Non-Def, Ex-Air, M/M% (previous +0%)
8:30 AM ET. Unemployment Insurance Weekly Claims Report - Initial Claims
Jobless Claims (expected 240K; previous 239K)
Jobless Claims, Net Chg (previous -11K)
Continuing Claims (previous 1716000)
Continuing Claims, Net Chg (previous +32K)
8:30 AM ET. U.S. Weekly Export Sales
10:30 AM ET. EIA Weekly Natural Gas Storage Report
Working Gas In Storage (Cbf) (previous 3065B)
Working Gas In Storage, Net Chg (Cbf) (previous +35B)
11:00 AM ET. August Federal Reserve Bank of Kansas City Survey of Tenth District Manufacturing
Mfg Activity Idx (previous -20)
6-Mo Exp Prod Idx (previous -1)
Mfg Composite Idx (expected -9; previous -11)
6-Mo Exp Composite Idx (previous -2)
2:00 PM ET. SEC Closed Meeting
4:30 PM ET. Foreign Central Bank Holdings
4:30 PM ET. Federal Discount Window Borrowings
Friday, August 25, 2023
10:00 AM ET. August University of Michigan Survey of Consumers - final
End-Mo Sentiment Idx (expected 71.2; previous 71.6)
End-Mo Expectations Idx (previous 68.3)
12-Month Inflation Forecast (previous 3.4%)
5-Year Inflation Forecast (previous 3.0%)
End-Mo Current Idx (previous 76.6)
Monday, August 28, 2023
10:30 AM ET. August Texas Manufacturing Outlook Survey
Business Activity (previous -20.0)
Mfg Production Idx (previous -4.8)
Tuesday, August 29, 2023
8:55 AM ET. Johnson Redbook Retail Sales Index
Ret Sales Mo-to-Date, Y/Y% (previous +1.3%)
Latest Wk, Y/Y% (previous +2.9%)
9:00 AM ET. 2nd Quarter U.S. Quarterly House Price Index
9:00 AM ET. June U.S. Monthly House Price Index
9:00 AM ET. June S&P CoreLogic Case-Shiller Indices
10-City Idx, M/M% (previous +1.5%)
10-City Idx, Y/Y% (previous -1.0%)
20-City Idx, M/M% (previous +1.5%)
20-City Idx, Y/Y% (previous -1.7%)
National Idx, M/M% (previous +1.2%)
National Idx, Y/Y% (previous -0.5%)
10:00 AM ET. July Job Openings & Labor Turnover Survey
10:00 AM ET. August Consumer Confidence Index
Cons Conf Idx (previous 117.0)
Expectation Idx (previous 88.3)
Present Situation Idx (previous 160)
4:30 PM ET. API Weekly Statistical Bulletin
Crude Stocks, Net Chg (Bbls) (previous -2.4M)
Gasoline Stocks, Net Chg (Bbls) (previous +1.9M)
Distillate Stocks, Net Chg (Bbls) (previous -0.2M)
The STOCK INDEXES? http://quotes.ino.com/ex?changes/?c=indexes
The STOCK INDEXES: The September NASDAQ 100 was higher overnight as it the rebound off last-Friday's low. Overnight strength sets thestage a higher opening when the day session begins trading. Stochastics and the RSI are neutral to bullish signaling that sideways to higher prices are possible near-term. Closes above the 50-day moving average crossing at 15,334.56 would signal that a short-term low has been posted. If September renews the decline off July's high, the June 8th low crossing at 14,425.00 is the next downside target. First resistance is the 50-day moving average crossing at 15,334.56. Second resistance is the July 17th high crossing at 15,917.00. First support is the 25% retracement level of the 2022-2023 rally crossing at 14,789.53. Second support is the June 8th low crossing at 14,425.00.
The September S&P 500 was higher overnight as it extends the rebound off last-Friday's low. Overnight trading sets the stage for a higher opening when the day session begins trading. Stochastics and the RSI are turning neutral to bullish signaling that sideways to higher prices are possible near-term. Closes above the 20-day moving average crossing at 4491.20 would signal that a short-term low has been posted. If September renews the decline off July's high, the 38% retracement level of the March-July rally crossing at 4344.68 is the next downside target. First resistance is the 10-day moving average crossing at 4433.85. Second resistance is the 20-day moving average crossing at 4491.20. First support is the 38% retracement level of the March-July rally crossing at 4344.68. Second support is the June 8th low crossing at 4305.75.
INTEREST RATES http://quotes.ino.com/ex changes/?c=interest"
INTEREST RATES: September T-bonds were higher overnight as it consolidates some of the decline off April's high. Overnight trading sets the stage for a higher opening when the day session begins trading. Stochastics and the RSI are oversold but remain neutral to bearish signaling that sideways to lower prices are possible near-term. If September extends the decline off July's high, the February-2011 low on the monthly continuation chart crossing at 116-26 is the next downside target.Closes above the 20-day moving average crossing at 121-04 would signal that a low has been posted. First resistance is the 20-day moving average crossing at 121-04. Second resistance is the 50-day moving average crossing at 124-11. First support is Tuesday's low crossing at 117-18. Second support is the February-2011 low on the weekly continuation chart crossing at 116-26.
September T-notes was higher overnight as it consolidates some of the decline off May's high. Overnight trading and sets the stage for a higher opening when the day session begins trading. Stochastics and the RSI are oversold, diverging but remain neutral to bearish signaling that sideways to lower prices are possible near-term. If September extends the decline off July's high, the October-2022 low crossing at 108.265 is the next downside target. Closes above the 20-day moving average crossing at 110.123 would signal that a short-term low has been posted. First resistance is the 10-day moving average crossing at 109.222. Second resistance is the 20-day moving average crossing at 110.123. First support is Tuesday's low crossing at 108.280. Second support is the October-2022 low on the weekly continuation chart crossing at 108.265.
ENERGY MARKETS? http://quotes.ino.com/ex?changes/?c=energy ""
ENERGIES:Octobercrude oil was lower overnight as it renews the decline off August's high. Overnight trading sets the stage for a lower opening when the day session begins trading. Stochastics and the RSI are neutral to bearish signaling that sideways to lower prices are possible near-term. If October extends the decline off August's high, the 38% retracement level of the May-August rally crossing at $76.68 is the next downside target. Closes above the 20-day moving average crossing at $80.85 would signal that a short-term low has been posted. First resistance is August's high crossing at $84.16. Second resistance is the 75% retracement level of the 2022-2023 decline crossing at $87.70. First support is the August 3rd low crossing at $78.33. Second support is the 38% retracement level of the May-August rally crossing at $76.68.
October heating oil was steady to slightly lower overnight. Overnight weakness sets the stage for a slightly lower opening when the day session begins trading. Stochastics and the RSI are turning neutral to bearish hinting that sideways to lower prices are possible near-term. Closes below the 20-day moving average crossing at 3.0401 would signal that a short-term top has been posted. If October renews the rally off May's low, the June-2022 crossing at 3.2100 is the next upside target. First resistance is August's high crossing at 3.1928. Second resistance is the June-2022 high crossing at 3.2100. First support is the 20-day moving average crossing at 3.0401. Second support is the August 8th low crossing at 2.9174.
October unleaded gas was lower overnight as it extends the decline off August's high. Overnight trading sets the stage for a lower opening when the day session begins trading. Stochastics and the RSI remain neutral to bearish signaling that sideways to lower prices are possible near-term. If October extends the decline off August's high, the August 3rd low crossing at 2.4847 is the next downside target. Closes above the 10-day moving average crossing at 2.6116 would signal that a short-term low has been posted. First resistance is the August 11th high crossing at $2.7209. Second resistance is the October-2022 high on the weekly continuation chart crossing at $3.0221. First support is August 3rd low crossing at $2.4847. Second support is the 50-day moving average crossing at $2.4171.
October natural gas was steady to slightly lower overnight as it extends the decline off August's high. Overnight weakness sets the stage for a slightly lower opening when the day session begins trading. Stochastics and the RSI are neutral to bearish signaling that sideways to lower prices are possible near-term. If October extends the decline off August's high, August's low crossing at 2.570 is the next downside target. Closes above the 10-day moving average crossing at 2.762 would signal that a short-term low has been posted. First resistance is the August 9th high crossing at 3.096. Second resistance is the 25% retracement level of the 2022-2023 decline crossing at 3.301. First support is August's low crossing at 2.570. Second support is June's low crossing at 2.377.
CURRENCIEShttp://quotes.ino.com/ex changes/?c=currencies"
CURRENCIES:The September Dollar was higher overnight as it extends the rally off July's low. Overnight trading sets the stage for a higher opening when the day session begins trading later this morning. Stochastics and the RSI are overbought but remain neutral to bullish signaling that sideways to higher prices are possible near-term. If September extends the rally off July's low, May's high crossing at $104.205 is the next upside target. Closes below the 20-day moving average crossing at $102.576 would signal that a short-term top has been posted. First resistance is May's high crossing at $104.205. Second resistance is March's high crossing at $105.000. First support is the 10-day moving average crossing at $103.178. Second support is the 20-day moving average crossing at $102.576.
The September Euro was lower overnight as it extends the decline off July's high. Overnight weakness sets the stage for a lower opening when the day session begins trading. Stochastics and the RSI are oversold but remain neutral to bearish signaling that sideways to lower prices are possible near-term. If September extends the decline off July's high, the June 12th low crossing at 1.07920 is the next downside target. Closes above the 50-day moving average crossing at $1.10113 would confirm that a short-term low has been posted. First resistance is the 20-day moving average crossing at $1.09565. Second resistance is the 50-day moving average crossing at $1.10113. First support is the June 12th low crossing at 1.07920. Second support is May's low crossing at 1.07025.
The September British Pound was sharply lower overnight as it extends August's trading range. Overnight weakness sets the stage for a lower opening when the day session begins trading. Stochastics and the RSI are turning bearish signaling that sideways to lower prices near-term. Closes below 1.2619 marking the bottom of August's trading range would mark a downside breakout of August's trading range while opening the door for a possible test of the 50% retracement level of the March-July rally crossing at 1.2508. Closes above the August 10th high crossing at 1.2822 would mark an upside breakout of August's trading range while opening the door for additional gains. First resistance the August 10th high crossing at 1.2822. Second resistance is the July 27th high crossing at 1.2999. First support is the 38% retracement level of the March-July rally crossing at 1.2658. Second support is the 50% retracement level of the March-July rally crossing at 1.2508.
The September Swiss Franc was steady to slightly lower overnight as it extends the trading range of the past two-weeks. Overnight trading sets the stage for a slightly lower opening when the day session begins trading. Stochastics and the RSI are oversold but remain neutral to bearish signaling that sideways to lower prices are possible near-term. Closes below Monday's low crossing at 1.13620 would open the door for a possible test of the June 30th low crossing at 1.11790. Closes above the 20-day moving average crossing at 1.14567 would signal that a short-term low has been posted. First resistance is the 20-day moving average crossing at 1.14567. Second resistance is the August 10th high crossing at 1.15535. First support is Monday's low crossing at 1.13620. Second support is the June 30th low crossing at 1.11790.
The September Canadian Dollar was lower overnight as it extends the decline off July's high. Overnight trading sets the stage for a lower opening when the day session begins trading. Stochastics and the RSI are oversold but remain neutral to bearish signaling that sideways to lower prices are possible near-term. If September extends the decline off July's high, the 75% retracement level of the March-July rally crossing at $73.49 is the next downside target. Closes above the 20-day moving average crossing at $74.57 would signal that a short-term low has been posted. First resistance is the 10-day moving average crossing at $74.03. Second resistance is the 20-day moving average crossing at $74.57. First support is the 75% retracement level of the March-July rally crossing at $73.49. Second support is the 87% retracement level of the March-July rally crossing at crossing at $73.02.
The September Japanese Yen was slightly higher overnight as it extends the trading range of the past five-days. Overnight strength sets the stage for a slightly higher opening when the day session begins trading. Stochastics and the RSI are oversold and remain neutral to bearish signaling that sideways to lower prices are possible near-term. If September extends the decline off the July 14th high, the October-2022 low on the weekly continuation chart crossing at 0.066235 is the next downside target. Closes above the 20-day moving average crossing at 0.069983 would signal that a short-term low has been posted. First resistance is the 20-day moving average crossing at 0.069983. Second resistance is the 50-day moving average crossing at 0.070835. First support is last-Thursday's low crossing at 0.068545. Second support is the October-2022 low on the weekly continuation chart crossing at 0.066235.
PRECIOUS METALS http://quotes.ino.com/ex changes/?c=metals"
Precious Metals: December gold was higher overnight as it consolidates some of the decline off May's high. Overnight trading sets the stage for a higher opening when the day session begins trading later this morning. Stochastics and the RSI are oversold but are turning neutral to bullish signaling that sideways to higher prices are possible near-term. Closes above the 20-day moving average crossing at $1954.50 would confirm that a short-term low has been posted. If October extends the decline off July's high, February's low crossing at $1883.80 is the next downside target. First resistance is the 10-day moving average crossing at $1931.60. Second resistance is the 20-day moving average crossing at $1954.50. First support is the 50% retracement level of the 2022-2023 rally crossing at $1919.90. Second support is February's low crossing at $1883.80.
September silver was higher overnight as it extends the rebound off the August 15th low crossing at $22.265. Overnight trading sets the stage for a higher opening when the day session begins trading later this morning. Stochastics and the RSI are bullish signaling that sideways to higher prices are possible near-term. Closes above the 50-day moving average crossing at $23.699 would signal that a short-term low has been posted. If September renews the decline off July's high, the 62% retracement level of the 2022-2023 rally crossing at $21.452 is the next downside target. First resistance is the 50-day moving average crossing at $23.699. Second resistance is the July 31 high crossing at $24.985. First support is the 50% retracement level of the 2022-2023 rally crossing at $22.450. Second support is the 62% retracement level of the 2022-2023 rally crossing at $21.452.
September copper was higher overnight as it extends the rally off last-Thursday's low. Overnight trading sets the stage for a higher opening when the day session begins trading. Stochastics and the RSI are bullish signaling that sideways to higher prices are possible near-term. Closes above the 50-day moving average crossing at 3.8181 would confirm that a short-term low has been posted. If September renews this month's decline, May's low crossing at 3.5650 is the next downside target. First resistance is the 50-day moving average crossing at 3.8181. Second resistance is the August 4th high crossing at 3.9280. First support is last-Thursday's low crossing at 3.6270. Second support is May's low crossing at 3.5650.
GRAINS http://quotes.ino.com/ex changes/?c=grains
Grains: December corn was steady to slightly higher overnight as it consolidates some of this week's decline. Overnight trading sets the stage for a steady to slightly higher opening when the day sessions begins trading. Stochastics and the RSI remain neutral to bearish signaling that sideways to lower prices are possible near-term. Potential yield losses across the Corn belt are being offset by weak demand as a result of a strong U.S. Dollar.Closes above the August 11th high crossing at $5.07 1/2 would signal that a short-term low has been posted. If December renews the decline off July's high, the 75% retracement level of the 2020-2022 rally crossing at $4.50 3/4 is the next downside target. First resistance is the August 11th high crossing at $5.07 1/2. Second resistance is the 50-day moving average crossing at $5.23 1/2. First support is last-Wednesday's low crossing at $4.73 1/2. Second support is the 75% retracement level of the 2020-2022 rally crossing at $4.50 3/4.
December wheat was mostly steady in quiet trading overnight as it consolidates some of the decline off July's high. Overnight trading sets the stage for a steady opening when the day session begins trading. Stochastics and the RSI are oversold and are turning neutral to bullish signaling that sideways to higher prices are possible near-term. Closes above the 20-day moving average crossing at $6.59 would signal that a short-term low has been posted. If December resumes the decline off July's high, May's low crossing at $6.08 1/4 is the next downside target. First resistance is the 20-day moving average crossing at $6.59. Second resistance is the 50-day moving average crossing at $6.86 3/4. First support is last-Thursday's low crossing at $6.12. Second support is May's low crossing at $6.08 1/4.
December Kansas City wheat was lower overnight as it extends the trading range of the past seven-days. Overnight trading sets the stage for a lower opening when the day session begins trading later this morning. Stochastics and the RSI are oversold but remain neutral to bearish signaling that sideways to lower prices are possible near-term. If December resumes the decline off July's high, May's low crossing at $7.36 is the next downside target. Closes above the 20-day moving average crossing at $7.81 1/2 would signal that a short-term low has been posted. First resistance is the 20-day moving average crossing at $7.81 1/2. Second resistance is the 50-day moving average crossing at $8.15 3/4. First support is last-Wednesday's low crossing at $7.39. Second support is May's low crossing at $7.36.
December Minneapolis wheat was steady to slightly higher overnight and sets the stage for a slightly higher opening when the day session begins trading. Stochastics and the RSI are oversold but remain neutral to bearish signaling that sideways to lower prices are possible near-term. If December extends the decline off July's high, the May 31st low crossing at $7.85 3/4 is the next downside target. Closes above the 20-day moving average crossing at $8.38 1/4 would signal that a low has been posted. First resistance is the 10-day moving average crossing at $8.09 1/2. Second resistance is the 20-day moving average crossing at $8.36 1/4. First support is the May 31st low crossing at $7.85 3/4. May's low crossing at $7.80 1/2.
SOYBEAN COMPLEX? http://quotes.ino.com/ex?changes/?c=grains "
November soybeans was lower overnight and sets the stage for a lower opening when the day session begins trading later this morning. Stochastics and the RSI have turned bearish signaling that sideways to lower prices are possible near-term. Closes below the 10-day moving average crossing at $13.30 3/4 would signal that a short-term top has been posted. Closes above Monday's high crossing at $13.81 would open the door for a possible test of July's low crossing at $14.35. First resistance is Monday's high crossing at $13.81. Second resistance is July's high crossing at $14.35. First support is the 10-day moving average crossing at $13.30 3/4. Second support is the 50% retracement level of the May-July rally crossing at $12.82 3/4.
December soybean meal was lower overnight as it extends Tuesday's loss. Overnight trading sets the stage for a lower opening when the day session begins trading. Stochastics and the RSI are neutral to bullish signaling that sideways to higher prices are possible near-term. Closes above the 50-day moving average crossing at $397.10 would temper the bearish outlook while opening the door for additional gains near-term. If December renews the decline off July's high, the June 29th low crossing at $374.60 is the next downside target. First resistance is the August 4th high crossing at $407.70. Second resistance is the July 27th high crossing at $424.70. First support is last-Thursday's low crossing at $379.00. Second support is the June 29th low crossing at $374.60.
December soybean oil was lower in overnight trading as it extends the decline off Monday's high. Overnight trading sets the stage for a lower opening when the day session begins trading. Stochastics and the RSI have turning bearish signaling that sideways to lower prices are possible near-term. Closes below the 50-day moving average crossing at 59.88 would signal that a short-term top has been posted. If December renews the rally off May's low, last-October's high crossing at 66.44 is the next upside target. First resistance is July's high crossing at 65.58. Second resistance is last-October's high crossing at 66.44. First support is the 50-day moving average crossing at 59.88. Second support is the August 8th low crossing at 57.86.
Thank you tallpine!
Not much rain in the forecast with intense heat for a few more days, that gets pushed south at the end of this week.
The Pro Farmer tour is more important this week:
https://www.marketforum.com/forum/topic/98452/
Extremely low chance for a freeze this year:
metmike: Take note of item #3 on the top list here (underlined/in bold to emphasize):
https://www.marketforum.com/forum/topic/98452/#98466
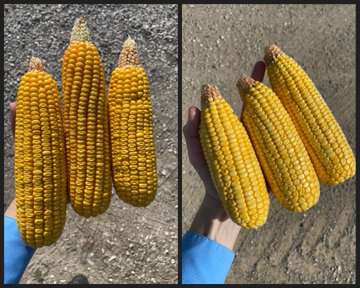
Not impressed with #corn after 6 stops in west central Iowa (Harrison/Crawford County area). Average 171 bu/acre. Last year was 201 and two years ago 218 through this same stretch. Ears are kinda short. #pftour23