KEY EVENTS TO WATCH FOR:
Thursday, August 17, 2023
8:30 AM ET. August Philadelphia Fed Business Outlook Survey
Business Activity (expected -10; previous -13.5)
Prices Paid (previous 9.5)
Employment (previous -1.0)
New Orders (previous -15.9)
Prices Received (previous 23.0)
Delivery Times (previous -12.9)
Inventories (previous -1.0)
Shipments (previous -12.5)
8:30 AM ET. Unemployment Insurance Weekly Claims Report - Initial Claims
Jobless Claims (expected 240K: previous 248K)
Jobless Claims, Net Chg (previous +21K)
Continuing Claims (previous 1684000)
Continuing Claims, Net Chg (previous -8K)
8:30 AM ET. U.S. Weekly Export Sales
10:00 AM ET. 2nd Quarter Quarterly Retail E-Commerce Sales
10:00 AM ET. July Leading Indicators
Leading Index, M/M% (expected -0.4%; previous -0.7%)
Leading Index
Coincident Index, M/M% (previous +110.0%)
Lagging Index, M/M% (previous +118.4%)
10:30 AM ET. EIA Weekly Natural Gas Storage Report
Working Gas In Storage (Cbf) (previous 3030B)
Working Gas In Storage, Net Chg (Cbf) (previous +29B)
2:00 PM ET. SEC Closed Meeting
4:30 PM ET. Federal Discount Window Borrowings
4:30 PM ET. Foreign Central Bank Holdings
Friday, August 18, 2023
10:00 AM ET. 2nd Quarter Advance Quarterly Services
10:00 AM ET. July State Employment and Unemployment
The STOCK INDEXES? http://quotes.ino.com/ex?changes/?c=indexes
The Dow closed lower on Wednesday as it extends Tuesday's downside breakout of the trading range of the past three-weeks. The mid-range close sets the stage for a steady to higher opening when Thursday's day session begins trading. Stochastics and the RSI are becoming oversold but remain neutral to bearish signaling that sideways to lower prices are possible near-term. If the Dow extend the decline off August's high, the 50-day moving average crossing at 34,598.37 is the next downside target. If the Dow renews the rally off July's low, the February-2022 high crossing at 35,824.28 is the next upside target. First resistance is August's high crossing at 35,679.13. Second resistance is the February-2022 high crossing at 35,824.28. First support is the 50-day moving average crossing at 34,598.20. Second support is July's low crossing at 33,705.68 is the next downside target.
The September NASDAQ 100 closed lower on Wednesday as it extends the decline off July's high. The mid-range close sets the stage for a steady to lower opening when Thursday's night session begins trading. Stochastics and the RSI are oversold but remain neutral to bearish signaling sideways to lower prices are possible. If September extends the decline off July's high, the 25% retracement level of the 2022-2023 rally crossing at 14,789.53 is the next downside target. Closes above the 20-day moving average crossing at 15,455.06 would signal that a short-term low has been posted. First resistance is the July 19th high crossing at 16,062.75. Second resistance is the December-2021 high on the weekly continuation chart crossing at 16,659.50. First support is the 25% retracement level of the 2022-2023 rally crossing at 14,789.53. Second support is June's low crossing at 14,420.00.
The September S&P 500 closed slightly lower on Wednesday as it extends the decline off July's high. The mid-range close sets the stage for a steady to lower opening when Thursday's night session begins trading. Stochastics and the RSI are oversold but remain neutral to bearish signaling that sideways to lower prices are possible near-term. If September extends the decline off July's high, the 38% retracement level of the March-July rally crossing at 4344.68 is the next downside target. Closes above the 20-day moving average crossing at 4538.21 would temper the near-term bearish outlook. First resistance is the 20-day moving average crossing at 4538.21. Second resistance is July's high crossing at 4634.50. First support is the 25% retracement level of the March-July rally crossing at 4445.16. Second support is July's low crossing at 4411.25.
INTEREST RATES? http://quotes.ino.com/ex?changes/?c=interest ""
September T-bonds closed down 21/32's at 119-14.
September T-bonds closed lower on Wednesday and posted a new low for the year. The low-range close sets the stage for a steady to lower opening when Thursday's day session begins trading. Stochastics and the RSI are oversold but remain neutral to bearish signaling that sideways to lower prices are possible near-term. If September extends the decline off July's high, the 50% retracement level of the 1980-2020 rally on the monthly continuation chart crossing at 118-21 is the next downside target. Closes above the 20-day moving average crossing at 123-00 would signal that a short-term low has been posted. First resistance is the 20-day moving average crossing at 123-00. Second resistance is the 50-day moving average crossing at 125-07. First support is today's low crossing at 119-12. Second support is the 50% retracement level of the 1980-2020 rally on the monthly continuation chart crossing at 118-21.
September T-notes closed down 70-pts. at 109.175.
September T-notes closed lower on Thursday as it extended the decline off last-Thursday's high. The low-range close sets the stage for a steady to lower opening when Thursday's day session begins trading. Stochastics and the RSI are oversold but remain neutral to bearish signaling that sideways to lower prices are possible near-term. If September renews the decline off July's high, the October-2022 low crossing at 108.265 is the next downside target. Closes above the 50-day moving average crossing at 112.002 would signal that a short-term low has been posted. First resistance is the 20-day moving average crossing at 111.021. Second resistance is the 50-day moving average crossing at 112.002. First support is Tuesday's low crossing at 109.115. Second support is the October-2022 low crossing at 108.265.
ENERGY MARKETS? http://quotes.ino.com/ex?changes/?c=energy ""
October crude oil closed lower on Wednesday and below the 20-day moving average crossing at $80.33 signaling that a short-term top has been posted. The low-range close sets the stage for a steady to lower opening when Thursday's day session begins. Stochastics and the RSI are bearish signaling that sideways to lower prices are possible near-term. If October extends the decline off last-Thursday's high, the 38% retracement level of the May-August rally crossing at $76.68 is the next downside target. If October renews the rally off June's low, the 75% retracement level of the 2022-2023 decline on the weekly chart crossing at $88.47 is the next upside target. First resistance is the 62% retracement level of the 2022-2023 decline on the weekly chart crossing at $84.20. Second resistance is the 75% retracement level of the 2022-2023 decline on the weekly chart crossing at $88.47. First support is the August 3rd low crossing at $78.33. Second support is the 38% retracement level of the May-August rally crossing at $76.68.
October heating oil closed lower on Wednesday as it extended the decline off last-Thursday's high. The low-range close sets the stage for a steady to lower opening when Thursday's day trading session begins. Stochastics and the RSI are bearish signaling that sideways to lower prices are possible near-term. Closes below the 20-day moving average crossing at 2.9510 would signal that a short-term top has been posted. If October renews the rally off May's low, the June-2022 high crossing at 3.2100 is the next upside target. First resistance is last-Thursday's high crossing at 3.1928. Second resistance is the June-2022 high crossing at 3.2100. First support the 20-day moving average crossing at 2.9510. Second support is last-Tuesday's low crossing at 2.9174.
October unleaded gas closed slightly lower on Wednesday as it consolidated some of the rally off May's low. The mid-range close sets the stage for a steady to lower opening when Thursday's day session begins trading. Stochastics and the RSI have turned neutral to bearish signaling that sideways to lower prices are possible near-term. Closes below the 20-day moving average crossing at 2.5881 would signal that a short-term top has been posted while opening the door for additional weakness near-term. If October renews the rally off June's low, the October-2022 high on the weekly continuation chart crossing at 3.0221 is the next upside target. First resistance is last-Friday's high crossing at 2.7209. Second resistance is the October-2022 high on the weekly continuation chart crossing at 3.0221. First support is the 20-day moving average crossing at 2.5881. Second support is the August 3rd low crossing at 2.4847.
October Henry natural gas closed lower on Wednesday following yesterday's key reversal down thereby signaling that a short-term top was posted with last-Wednesday's high.The low-range close sets the stage for a steady to lower opening when Thursday's day session begins trading. Stochastics and the RSI are bearish signaling that sideways to lower prices are possible near-term. Multiple closes below the 50-day moving average crossing at 2.732 would confirm that a short-term top has been posted. If October renews the rally off the August 2nd low, the 25% retracement level of the 2022-2023 decline crossing at 3.301 is the next upside target. First resistance is last-Wednesday's high crossing at 3.096. Second resistance is the 25% retracement level of the 2022-2023 decline crossing at 3.301. First support is the August 2nd low crossing at 2.457. Second support is the June 1st low crossing at 2.249.
CURRENCIES? http://quotes.ino.com/ex?changes/?c=currencies ""
The September Dollar closed higher on Wednesday as it extends the rally off July's low. The high-range close sets the stage for a steady to higher opening when Thursday's session begins trading. Stochastics and the RSI are overbought but remain neutral to bullish signaling that sideways to higher prices are possible near-term. If September extends the rally off July's low, May's high crossing at 104.205 is the next upside target. Closes below last-Thursday's low crossing at 101.600 would signal that a short-term top has been posted. First resistance is today's high crossing at 103.410. Second resistance is May's high crossing at 104.205. First support is last-Thursday's low crossing at 101.600. Second support is the July 26th low crossing at 100.320.
The September Euro closed lower on Wednesday as it extended the decline off July's high. The low-range close sets the stage for a steady to lower opening when Thursday's day session begins trading. Stochastics and the RSI are oversold but remain neutral to bearish signaling that sideways to lower prices are possible near-term. If September extends the decline off July's high, July's low crossing at 1.08715 is the next downside target. Closes above the 20-day moving average crossing at 1.10192 would signal that a short-term low has been posted. First resistance is the 20-day moving average crossing at 1.10192. Second resistance is last-Thursday's high crossing at $1.10850. First support is July's low crossing at $1.08715. Second support is May's low crossing at 1.07025.
The September British Pound closed slightly higher on Wednesday. The low-range close sets the stage for a steady to slightly higher opening when Thursday's day session begins trading. Stochastics and the RSI are diverging but are turning neutral to bullish signaling sideways to higher prices are possible near-term. Closes above the 20-day moving average crossing at 1.2782 would signal that a short-term low has been posted. If September renews the decline off July's high, the 50% retracement level of the March-July rally crossing at 1.2508 is the next downside target. First resistance is the 20-day moving average crossing at 1.2782. Second resistance is the July 27th high crossing at 1.2999. First support is Monday's low crossing at 1.2619. Second support is the June 29th low crossing at 1.2594.
The September Swiss Franc closed lower on Wednesday and below the 50-day moving average crossing at 1.14098. The low-range close sets the stage for a steady to lower opening when Thursday's day session begins trading. Stochastics and the RSI are oversold but remain neutral to bearish signaling that sideways to lower prices are possible near-term. If September extends the decline off July's high, the June 30th low crossing at 1.11790 is the next downside target. Closes above the 20-day moving average crossing at 1.15152 would signal that a short-term low has been posted. First resistance is the 20-day moving average crossing at 1.15152. Second resistance is the July 18th high crossing at 1.17650. First support is Monday's low crossing at 1.13700. Second support is the June 30th low crossing at 1.11790.
The September Canadian Dollar closed lower on Wednesday as it extends the decline off July's low. The low-range close sets the stage for a steady to lower opening when Thursday's day session begins trading. Stochastics and the RSI are oversold but remain neutral to bearish signaling that sideways to lower prices are possible near-term. If September extends the decline off July's high, the 62% retracement level of the March-July rally crossing at 73.49 is the next downside target. Closes above the 20-day moving average crossing at 75.10 would signal that a short-term low has been posted. First resistance is the 10-day moving average crossing at 74.50. Second resistance is the 20-day moving average crossing at 75.10. First support is today's low crossing at 73.86. Second support is the 75% retracement level of the March-July rally crossing at 73.49.
The September Japanese Yen closed lower on Wednesday as it extends this year's decline. The low-range close sets the stage for a steady to lower opening when Thursday’s day session begins trading. Stochastics and the RSI are oversold but remain neutral to bearish signaling that sideways to lower prices are possible near-term. If September extends the decline off the July 14th high, the October-2022 low on the weekly continuation chart crossing at 0.066235 is the next downside target. Closes above the 20-day moving average crossing at 0.070560 would signal that a short-term low has been posted. First resistance is the 10-day moving average crossing at 0.069804. Second resistance is the 20-day moving average crossing at 0.070560. First support is today's low crossing at 0.068665. Second support is the October-2022 low on the weekly continuation chart crossing at 0.066235.
PRECIOUS METALS? http://quotes.ino.com/ex?changes/?c=metals ""
December gold closed lower on Wednesday as it extends the decline off July's high. The low-range close sets the stage for a steady to lower opening when Thursday's day session begins trading. Stochastics and the RSI are oversold but remain neutral to bearish signaling that sideways to lower prices are possible near-term. If December extended the decline off July's high, the 50% retracement level of the 2022-2023-rally crossing at $1919.90 is the next downside target. Closes above the 50-day moving average crossing at $1983.00 would signal that a short-term low has been posted. First resistance is the 10-day moving average crossing at $1952.30. Second resistance is the 20-day moving average crossing at $1975.00. First support is today's low crossing at $1922.70. Second support is the 50% retracement level of the 2022-2023-rally crossing at $1919.90.
September silver closed lower on Wednesday as it extends the decline off July's high. The low-range close sets the stage for a steady to lower opening when Thursday's day session begins trading. Stochastics and the RSI are oversold but remain neutral to bearish signaling that sideways to lower prices are possible near-term. If September extends the decline off July's high, the 62% retracement level of the 2022-2023-rally crossing at 21.452 is the next downside target. Closes above the 50-day moving average crossing at 23.799 would signal that a short-term low has been posted. First resistance is the 10-day moving average crossing at 22.958. Second resistance is the 50-day moving average crossing at 23.799. First support is the 50% retracement level of the 2022-2023-rally crossing at 22.450. Second support is the 62% retracement level of the 2022-2023-rally crossing at 21.452.
September copper closed lower on Wednesday as it extends this month's decline. The low-range close sets the stage for a steady to lower opening when Thursday's day session begins trading. Stochastics and the RSI are oversold but remain neutral to bearish signaling that sideways to lower prices are possible near-term. If September extends this month's decline, May's low crossing at 3.5650 is the next downside target. Closes above the 20-day moving average crossing at 3.8281 would signal that a short-term low has been posted. First resistance is the 20-day moving average crossing at 3.8281. Second resistance is August's high crossing at 4.0240. First support is today's low crossing at 3.6420. Second support is May's low crossing at 3.5650.
GRAINS? http://quotes.ino.com/ex?changes/?c=grains "
December Corn closed up $0.06-cents at $4.81 1/2.
December corn closed higher on Wednesday as it consolidated some of the decline off June's high. The high-range close sets the stage for a steady to higher opening when Thursday's night session begins trading. Stochastics and the RSI are oversold but remain bearish signaling that sideways to lower prices are possible near-term. If December extends the decline off July's high, the September-2021 low on the weekly chart crossing at $4.62 1/2 is the next downside target. Closes above the 20-day moving average crossing at $5.13 1/4 would signal that a short-term low has been posted. First resistance is the 20-day moving average crossing at $5.13 1/4. Second resistance is the 50-day moving average crossing at $5.28 3/4. First support is the September-2021 low on the weekly chart crossing at $4.62 1/2. Second support is psychological support crossing at $4.50.
December wheat closed down $0.00 3/4-cents at $6.23.
December wheat closed fractionally lower on Wednesday. The mid-range close sets the stage for a steady to lower opening when Thursday's day session begins trading. Stochastics and the RSI are oversold but remain neutral to bearish signaling that sideways to lower prices are possible near-term. If December extends the decline off July's high, May's low crossing at $6.08 1/4 is the next downside target. Closes above the 20-day moving average crossing at $6.90 1/2 would signal that a short-term low has been posted. First resistance is the 20-day moving average crossing at $6.90 1/2. Second resistance is July's high crossing at $7.96 1/4. First support is today's low crossing at $6.17 1/4. Second support is May's low crossing at $6.08 1/4.
December Kansas City Wheat closed up $0.07-cents at $7.52 1/2.
December Kansas City wheat closed higher on Wednesday as it consolidated some of the decline off July's high. The high-range close sets the stage for a steady to higher opening when Thursday's day session begins trading. Stochastics and the RSI are oversold but remain bearish signaling that sideways to lower prices are possible near-term. Closes below May's low crossing at $7.36 would mark a downside breakout of the December-August trading range. Closes above the 50-day moving average crossing at $8.20 1/2 would signal that a short-term low has been posted. First resistance is last-Tuesday's high crossing at $7.89 1/4. Second resistance is the 50-day moving average crossing at $8.20 1/2. First support is May's low crossing at $7.36. Second support is the December-2021 low crossing at $7.29 1/2.
December Minneapolis wheat closed up $0.04 1/4-cents crossing at $8.06 1/4.
December Minneapolis wheat closed higher on Wednesday as it consolidates some of the decline off July's high. The mid-range close sets the stage for a steady to higher opening when Thursday's day session begins trading. Stochastics and the RSI are oversold but remain bearish signaling that sideways to lower prices are possible near-term. If December extends the decline off July's high, the May 31st low crossing at $7.78 1/4 is the next downside target. Closes above the 20-day moving average crossing at $8.58 would signal that a short-term low has been posted. First resistance is the 10-day moving average crossing at $8.20 1/4. Second resistance is the 50-day moving average crossing at $8.49 1/4. First support is the May 31st low crossing at $7.85 3/4. Second support is the May low crossing at $7.80 1/2.
SOYBEAN COMPLEX? http://quotes.ino.com/ex?changes/?c=grains "
November soybeans closed up $0.18 1/4-cents at $13.23 1/2.
November soybeans closed higher on Wednesday. The high-range close sets the stage for a steady to higher opening when Thursday's day session begins trading. Stochastics and the RSI are turning neutral to bullish signaling that sideways to higher prices are possible near-term. Closes above the 20-day moving average crossing at $13.50 would confirm that a short-term low has been posted. If November renews the decline off July's high, the June 28th low crossing at $12.56 3/4 is the next downside target. First resistance is the 20-day moving average crossing at $13.50. Second resistance is the July 31st gap crossing at $13.79. First support is the June 28th low crossing at $12.56 3/4. Second support is the 62% retracement level of the May-July rally crossing at $12.46 3/4.
December soybean meal closed up $2.10 at $382.60.
December soybean meal closed higher on Wednesday as it consolidates some of the decline off July's high. The high-range close sets the stage for a steady to higher opening when Thursday's day session begins trading. Stochastics and the RSI are oversold but remain neutral to bearish signaling that sideways to lower prices are possible near-term. If December extends the decline off July's high, the June 29th low crossing at $374.60 is the next downside target. Closes above the 20-day moving average crossing at $399.20 would signal that a short-term low has been posted. First resistance is the 50-day moving average crossing at $394.70. Second resistance is the 20-day moving average crossing at $399.20. First support is the June 29th low crossing at $374.60. Second support is May's low crossing at $361.80.
December soybean oil closed up 93 pts. at 62.81.
December soybean oil closed higher on Wednesday. The mid-range close sets the stage for a steady to higher opening when Thursday's day session begins trading. Stochastics and the RSI are neutral to bullish signaling that sideways to higher prices are possible near-term. If December extends the rally off last-Tuesday's high, July's high crossing at 65.58 is the next upside target. Closes below last-Tuesday's low crossing at 57.86 confirm that a short-term top has been posted. First resistance is today's high crossing at 63.82. Second resistance is July's high crossing at 65.58. First support is last-Tuesday's low crossing at 57.86. Second support is the June 29th low crossing at 54.67.
LIVESTOCKhttp://quotes.ino.com/exchanges/?c=livestock
October hogs closed up $0.08 at $78.28.
October hogs closed slightly higher on Wednesday as it consolidated some of the decline off August's high. The mid-range close sets the stage for a steady to lower opening when Thursday's day session begins trading. Stochastics and the RSI are oversold but remain neutral to bearish with signaling that sideways to lower prices are possible near-term. If October extends the decline off August's high, the June 6th low crossing at $74.03 is the next downside target. Closes above the 20-day moving average crossing at $82.89 would signal that a short-term low has been posted. First resistance is August's high crossing at $86.75. Second resistance is the 75% retracement level of the April-May decline crossing at $87.50. First support is the June 30th low crossing at $77.58. Second support is the June 8th low crossing at $74.03.
October cattle closed down $0.63 at $179.35.
October cattle closed lower on Wednesday. The low-range close sets the stage for a steady to lower opening on Thursday. Stochastics and the RSI are bearish signaling that sideways to lower prices are possible near-term. Closes below the 50-day moving average crossing at $178.93 would open the door for additional weakness near-term. If October renews this year's rally into uncharted territory, upside targets will be hard to project. First resistance is July's high crossing at $185.75. Second resistance is unknown. First support is the 50-day moving average crossing at $178.93. Second support is July's low crossing at $176.20.
October Feeder cattle closed down $0.68 at $250.88.
October Feeder cattle closed lower on Wednesday as it extends the July-August trading range. The low-range close sets the stage for a steady to lower opening when Thursday's day session begins trading. Stochastics and the RSI are bearish signaling that sideways to lower prices are possible near-term. Closes below the July 6th low crossing at $246.03 would mark a downside breakout of the aforementioned trading range. If October extends the rally off June's low into uncharted territory, upside targets will be hard to project. First resistance is last-Monday's high crossing at $256.25. Second resistance is unknown. First support is the 50-day moving average crossing at $248.18. Second support is the July 6th low crossing at $246.03.
FOOD & FIBERhttp://quotes.ino.com/ex changes/?c=food
December coffee closed lower on Wednesday as it extends the decline off April's high. The mid-range close sets the stage for a steady to lower opening on Thursday. Stochastics and the RSI are oversold but remain neutral to bearish signaling sideways to lower prices are possible near-term. If December extends the decline off June's high, the January low crossing at $14.49 is the next downside target. Closes above the 50-day moving average crossing at $16.42 would signal that a short-term low has been posted. First resistance is the 50-day moving average crossing at $16.42. Second resistance is May's low crossing at $17.14. First support is Tuesday's low crossing at $14.94. Second support is the January low crossing at $14.49.
December cocoa closed higher on Thursday. The high-range close sets the stage for a steady to higher opening on Friday. Stochastics and the RSI are neutral to bullish signaling that sideways to higher prices are possible near-term. Multiple closes above the 20-day moving average crossing at 34.18 would signal that a short-term low has been posted. If December renews the decline off August's high, the 25% retracement level of the 2022-2023 rally crossing at 32.63 is the next downside target.
October sugar closed higher on Wednesday. The high-range close sets the stage for a steady to higher opening on Wednesday. Stochastics and the RSI are neutral to bullish signaling that sideways to higher prices are possible near-term. If October renews the rally off June's low, July's high crossing at 25.30 is the next upside target. If October renews the decline off July's high, the July 7th low crossing at 23.11 is the next downside target.
December cotton closed lower on Wednesday as it extended the decline off last-Friday's high. The low-range close sets the stage for a steady to lower opening on Thursday. Stochastics and the RSI are bearish signaling sideways to lower prices are possible near-term. If December extends this week's decline, the August 3rd low crossing at 83.25 is the next downside target. If December extends the rally off June's low, the 75% retracement level of the May-July decline crossing at 91.29 is the next upside target.
Thanks much, tallpine!
Beans up another +7c tonight.
Corn -1/2c.
Not much change in the weather
18z GEFS maps for Aug 31 below
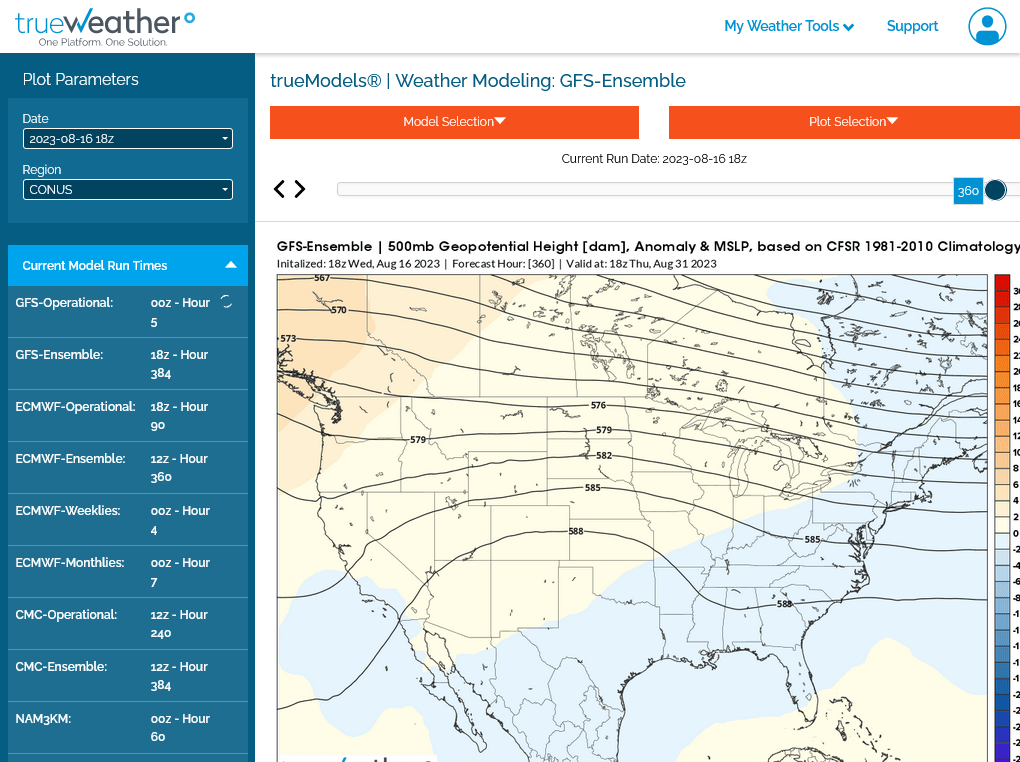

When I said not much change, that included the last comment from wed afternoon that indicates the ridge weakening and shifting back southwest with increasing flow around the periphery in the Midwest towards the end of August.
most important is the time……end of August.
too late in the growing season to hurt the crop enough for weather to be as powerful in price determination as it was the previous 4 months.
the crop is almost made And cant be hurt enough anymore to attract aggressive buying like earlier in the season when the upside is unlimited.
we failed at taking out strong resistance overnight. It might take something else in addition to weather …which is about dialed in, to clear that obstacle.
I feel like the 8/15 day outlooks will start picking up more rain and losing heat the rest of the week.
trading weather and crop ratings this week and commenting on it has been lots of fun but it’s going to be less predictable as those factors fade.