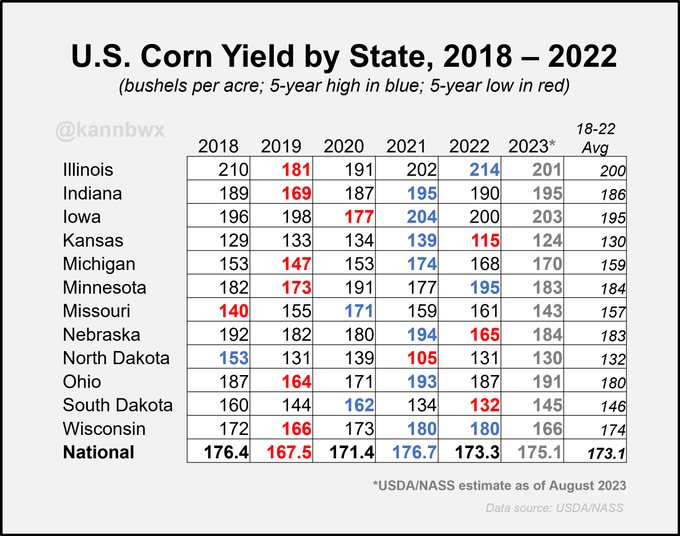
Updating the state-level U.S. #corn yield table with USDA's August numbers as placeholders for 2023. Good way to quickly see how those yields compare with recent average, max & min.
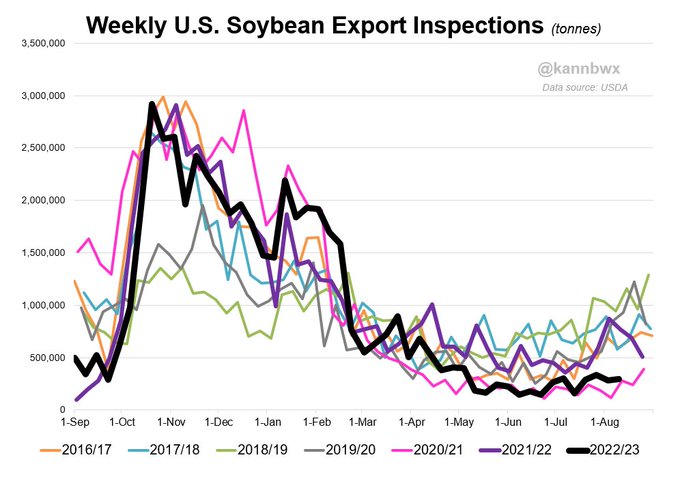
The same for #soybeans:
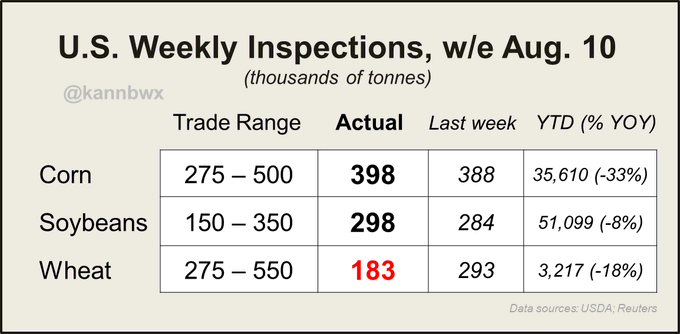
Here's the rest of the USDA report: https://www.marketforum.com/forum/topic/98070/
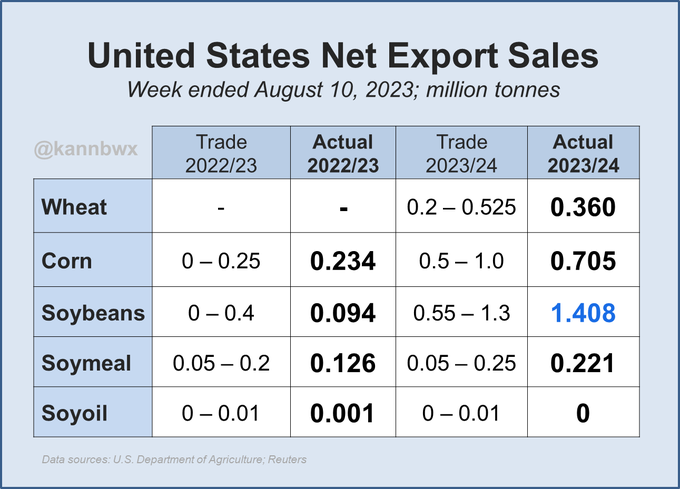
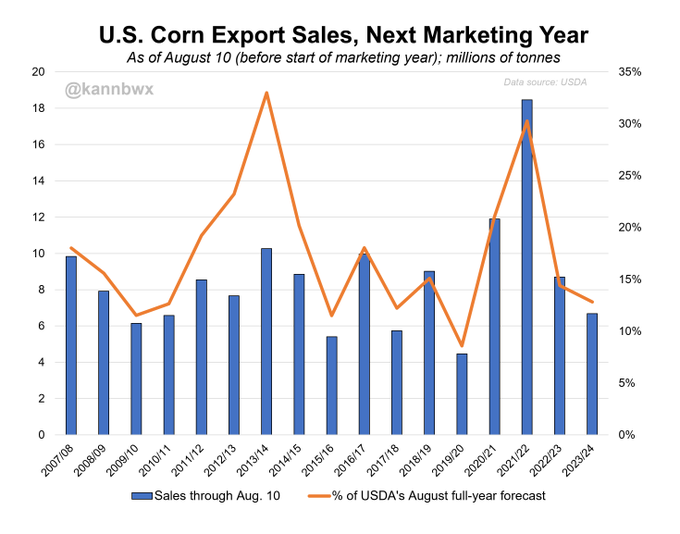
How much U.S. export sales are down vs last year means nothing if you haven't considered the expectations. 23/24 U.S. #corn sales covered 13% of USDA's export target as of Aug. 10. Aside from the big China buying years (2020, 2021), that's not far off recent averages.
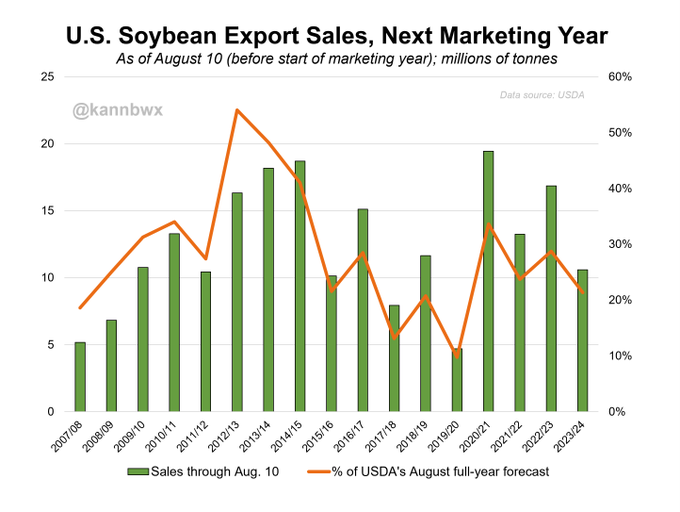
21% of USDA's 23/24 U.S. soy export forecast was covered as of Aug. 10, just below the 5yr avg of 23% (which includes high and low anomalies). Yes, sales of new-crop U.S. #soybeans are well below a year ago, but 1) expectations are lower 2) year-ago was anomalous.