KEY EVENTS TO WATCH FOR:
Wednesday, July 19, 2023
7:00 AM ET. MBA Weekly Mortgage Applications Survey
Composite Idx (previous 208.4)
Composite Idx, W/W% (previous +0.9%)
Purchase Idx-SA (previous 165.3)
Purchase Idx-SA, W/W% (previous +1.8%)
Refinance Idx (previous 416)
Refinance Idx, W/W% (previous -1.3%)
8:30 AM ET. June New Residential Construction - Housing Starts and Building Permits
Total Starts (expected 1.48M; previous 1.631M)
Housing Starts, M/M% (expected -9.3%; previous +21.7%)
Building Permits (expected 1.48M; previous 1.491M)
Building Permits, M/M% (expected -0.7%; previous +5.2%)
10:30 AM ET. EIA Weekly Petroleum Status Report
Crude Oil Stocks (Bbl) (previous 458.128M)
Crude Oil Stocks, Net Chg (Bbl) (previous +5.946M)
Gasoline Stocks (Bbl) (previous 219.452M)
Gasoline Stocks, Net Chg (Bbl) (previous -0.004M)
Distillate Stocks (Bbl) (previous 118.181M)
Distillate Stocks, Net Chg (Bbl) (previous +4.815M)
Refinery Usage (previous 93.7%)
Total Prod Supplied (Bbl/day) (previous 18.701M)
Total Prod Supplied, Net Chg (Bbl/day) (previous -2.534M)
The STOCK INDEXES? http://quotes.ino.com/ex?changes/?c=indexes
The STOCK INDEXES: The September NASDAQ 100 was higher overnight as it extends this year's rally. The stage is set for a higher opening when the day session begins trading. Stochastics and the RSI are overbought but remain neutral to bullish signaling that sideways to higher prices are possible near-term. If September extends this year's rally, the December-2021 high on the weekly continuation chart crossing at 16,659.50 is the next upside target. Closes below the 20-day moving average crossing at 15,355.10 would confirm that a short-term top has been posted. First resistance is Tuesday's high crossing at 16,029.75. Second resistance is the December-2021 high on the weekly continuation chart crossing at 16,659.50. First support is the 10-day moving average crossing at 15,552.42. Second support is the 20-day moving average crossing at 15,355.00.
The September S&P 500 was steady to slightly higher overnight as it extends this year's rally. Overnight trading sets the stage for a slightly higher opening when the day session begins trading. Stochastics and the RSI are overbought but remain neutral to bullish signaling that sideways to higher prices are possible near-term. If June extends the rally off March's low, the 87% retracement level of the 2022 decline crossing at 4639.07 is the next upside target. Closes below the 20-day moving average crossing at 4472.30 would confirm that a short-term top has been posted. First resistance is Tuesday's high crossing at 4594.50. Second resistance is the 87% retracement level of the 2022 decline crossing at 4639.07. First support is the 10-day moving average crossing at 4511.75. Second support is the 20-day moving average crossing at 4472.30.
INTEREST RATES http://quotes.ino.com/ex changes/?c=interest"
INTEREST RATES: September T-bonds was higher overnight as it extends the rally off the July 10th low. Overnight trading sets the stage for a higher opening when the day session begins trading. Stochastics and the RSI remain neutral to bullish signaling that sideways to higher prices are possible near-term. If September extends the aforementioned rally, the 50% retracement level of the April-July decline crossing at 128-21 is the next upside target. Closes below the 10-day moving average crossing at 125-19 would signal that a short-term top has been posted. First resistance is the 50-day moving average crossing at 127-13. Second resistance is the 50% retracement level of the April-July decline crossing at 128-21. First support is the 10-day moving average crossing at 125-19. Second support is the July 10th low crossing at 122-30.
September T-notes were higher overnight and sets the stage for a higher opening when the day session begins trading. Stochastics and the RSI are becoming overbought but remain neutral to bullish signaling that sideways to higher prices are possible near-term. If September extends this month's rally, the 50-day moving average crossing at 113.177 is the next upside target. Closes below the 10-day moving average crossing at 112.000 would signal that a short-term top has likely been posted. First resistance is the 50-day moving average crossing at 113.177. Second resistance is June's high crossing at 115.000. First support is the 10-day moving average crossing at 112.000. Second support is the July 6th low crossing at 110.050.
ENERGY MARKETS? http://quotes.ino.com/ex?changes/?c=energy ""
ENERGIES:Augustcrude oil was steady to slightly higher overnight as it consolidates some of the decline off last-Thursday's high. Overnight trading sets the stage for a slightly higher opening when the day session begins trading. Stochastics and the RSI are overbought but remain neutral signaling that sideways to higher prices are possible near-term. If August renews the rally off the June 28th low, the 75% retracement level of the April-May decline crossing at $77.85 is the next upside target. Closes below the 20-day moving average crossing at $72.36 would signal that a short-term top has been posted. First resistance is last-Thursday's high crossing at $77.33. Second resistance is the 75% retracement level of the April-May decline crossing at $77.85. First support is Monday's low crossing at 73.84. Second support is the 20-day moving average crossing at $72.36.
September heating oil was slightly higher overnight. Overnight trading sets the stage for a slightly higher opening when the day session begins trading. Stochastics and the RSI are overbought but remain neutral to bullish signaling that sideways to higher prices are possible near-term. If September extends the rally off May's low, April's high crossing at 2.6618 is the next upside target. Closes below the 20-day moving average crossing at 2.4893 would signal that a short-term top has been posted. First resistance is April's high crossing at 2.6618. Second resistance is the 50% retracement level of the 2022-2023 decline crossing at 2.7273. First support is Monday's low crossing at 2.5454. Second support is the 20-day moving average crossing at 2.4893.
September unleaded gas was slightly lower overnight as it consolidates some of the rally off Monday's low. Overnight trading sets the stage for a slightly lower opening when the day session begins trading. Stochastics and the RSI are overbought but remain neutral to bullish signaling that sideways to higher prices are possible near-term. If September extends the rally off May's low, the June-2022 highcrossing at $2.8215 is the next upside target. Closes below the 20-day moving average crossing at 2.4859 would signal that a short-term top has been posted. First resistance is the overnight high crossing at $2.6485. Second resistance is the June-2022 high crossing at $2.8215. First support is Monday's low crossing at $2.5464. Second support is the 20-day moving average crossing at $2.4859.
September natural gas was slightly lower overnight and sets the stage for a slightly lower opening when the day session begins trading. Stochastics and the RSI are oversold but are turning neutral to bullish signaling that sideways to higher prices are possible near-term. If September renews the rally off June's low, the June 26th high crossing at 2.911 is the next upside target. If September extends the decline off June's high, June's low crossing at 2.249 is the next downside target. First resistance is the June 26th high crossing at 2.911. Second resistance is the 25% retracement level of the 2022-2023 decline crossing at 3.193. First support is Monday's low crossing at 2.477. Second support is the June 1st low crossing at 2.249.
CURRENCIEShttp://quotes.ino.com/ex changes/?c=currencies"
CURRENCIES:The September Dollar was higher overnight as it consolidates some of this month's sharp decline. Overnight trading sets the stage for a higher opening when the day session begins trading later this morning. Stochastics and the RSI are oversold but remain neutral to bearish signaling that sideways to lower prices are possible near-term. If September extends the decline off the July 6th high, the March 30th low on the weekly continuation chart crossing at $97.730 is the next downside target. Closes above the 20-day moving average crossing at $101.585 would signal that a short-term low has been posted. First resistance is the 10-day moving average crossing at $100.622. Second resistance is the 20-day moving average crossing at $101.585. First support is Tuesday's low crossing at $99.220. Second support is the March 30th -2022 low on the weekly continuation chart crossing at $97.730.
The September Euro was slightly lower overnight as it consolidates some of the rally off May's low. Overnight trading sets the stage for a slightly lower opening when the day session begins trading. Stochastics and the RSI are overbought but remain neutral to bullish signaling that sideways to higher prices are possible near-term. If September extends the rally off May's low, the March 30th -2022 crossing at $1.15190 is the next upside target. Closes below the 20-day moving average crossing at 1.10561 would signal that a short-term top has been posted while opening the door for additional weakness near-term. First resistance is Tuesday's high crossing at $1.13105. Second resistance is the March 30th -2022 crossing at $1.15190. First support is the 10-day moving average crossing at 1.11497. Second support is the 20-day moving average crossing at 1.10561.
The September British Pound was sharply lower overnight as it extends the decline off last-Thursday high. Overnight trading and sets the stage for a sharply lower opening when the day session begins trading. Stochastics and the RSI are turning neutral to bearish signaling that sideways to lower prices near-term. Closes below the 20-day moving average crossing at 1.2838 would signal that a short-term top has been posted. If September resumes the rally off May's low, the 75% retracement level of the 2022-2023 decline crossing at 1.3253 is the next upside target. First resistance is last-Friday's high crossing at 1.3146. Second resistance is the 75% retracement level of the 2022-2023 decline crossing at 1.3253. First support is the 20-day moving average crossing at 1.2838. Second support is the 50-day moving average crossing at 1.2657.
The September Swiss Franc was lower overnight and sets the stage for a steady to lower opening when the day session begins trading. Stochastics and the RSI are overbought but remain neutral to bullish signaling that sideways to higher prices are possible near-term. If September extends the rally off May's low, the January 2019 high crossing at 1.18680 is the next upside target. Closes below the 20-day moving average crossing at 1.14074 would signal that a short-term top has been posted. First resistance is Tuesday's high crossing at 1.17650. Second resistance is the January 2019 high crossing at 1.18680. First support is the 10-day moving average crossing at 1.15594. Second support is the 20-day moving average crossing at 1.14074.
The September Canadian Dollar was slightly lower overnight and sets the stage for a slightly lower opening when the day session begins trading. Stochastics and the RSI are turning neutral to bearish signaling that sideways to lower prices are possible near-term. Closes below the 10-day moving average crossing at $75.71 would signal that a short-term top has been posted. If September renews the rally off July's low, the September-12th -2022 high crossing at $77.11 is the next upside target. First resistance is the 38% retracement level of the 2022-2023 decline crossing at $76.28. Second resistance is the September-12th -2022 high crossing at $77.11. First support is the 10-day moving average crossing at $75.71. Second support is the 50-day moving average crossing at $75.07.
The September Japanese Yen was lower overnight. Overnight trading sets the stage for a lower opening when the day session begins trading. Stochastics and the RSI are turning neutral to bearish signaling that sideways to lower prices are possible near-term. Closes below the 20-day moving average crossing at 0.071260 would signal that a short-term top has been posted. If September extends the rally off May's low, the 38% retracement level of the January-July decline crossing at 0.074017 is the next upside target. First resistance is last-Friday's high crossing at 0.073585. Second resistance is the 38% retracement level of the January-June decline crossing at 0.074017. First support is the 20-day moving average crossing at 0.071260. Second support is June's low crossing at 0.069755.
PRECIOUS METALS http://quotes.ino.com/ex changes/?c=metals"
Precious Metals: Augustgold was lower overnight as it consolidates some of Tuesday's rally. Overnight trading sets the stage for a lower opening when the day session begins trading later this morning. Stochastics and the RSI are overbought but remain neutral to bullish signaling that sideways to higher prices are possible near-term. If August extends the rally off June's low, June's high crossing at $2000.70 is the next upside target. Closes below the 20-day moving average crossing at $1940.10 would signal that a short-term top has been posted. First resistance is June's high crossing at $2000.70. Second resistance is the May 15th high crossing at $2046.50. First support is the 20-day moving average crossing at $1940.10. Second support is June's low crossing at $1900.60.
September silver was slightly lower overnight as it consolidates some of Tuesday's rally. Overnight trading sets the stage for a slightly lower opening when the day session begins trading later this morning. Stochastics and the RSI are overbought but remain neutral to bullish signaling that sideways to higher prices are possible near-term. If July extends the rally off June's low, the 75% retracement level of the May-June decline crossing at $25.561 is the next upside target. Closes below the 20-day moving average crossing at $23.626 would signal that a short-term top has been posted. First resistance is Tuesday's high crossing at $25.405. Second resistance is the 75% retracement level of the May-June decline crossing at 25.561. First support is the 50-day moving average crossing at $23.983. Second support is the 20-day moving average crossing at $23.626.
September copper was lower overnight as it extends the decline off last-Friday's high and sets the stage for a lower opening when the day session begins trading. Stochastics and the RSI are neutral to bearish signaling that sideways to lower prices are possible near-term. Closes below the 50-day moving average crossing at 3.7845 would signal that a short-term top has been posted. If September renews the rally off the June 29th low, June's high crossing at 3.9640 is the next upside target. First resistance June's high crossing at 3.9640. Second resistance is May's high crossing at 4.0100. First support is the 50-day moving average crossing at 3.7845. Second support is the June 29th low crossing at 3.6830.
GRAINS http://quotes.ino.com/ex changes/?c=grains
Grains: December corn was sharply higher overnight as it extends the rally off last-Thursday's low. Overnight gains were supported by additional port attacks in Ukraine and extended weather forecast calling for hot and dry conditions across much of the Midwest. Overnight trading sets the stage for a sharply higher opening when the day sessions begins trading. Stochastics and the RSI are bullish signaling that sideways to higher prices are possible near-term. If December extends the rally off last-Thursday's low, the 62% retracement level of the June-July decline crossing at $5.73 is the next upside target. Closes below the 10-day moving average crossing at $5.09 would signal that a short-term top has likely been posted. First resistance is the 50% retracement level of the June-July decline crossing at $5.55 1/2. Second resistance is the 62% retracement level of the June-July decline crossing at $5.73 1/2. First support is the 10-day moving average crossing at $5.09. Second support is last-Thursday's low crossing at $4.81.
September wheat was higher overnight as it extends the rally off last-Thursday's low. Overnight trading sets the stage for a sharply higher opening when the day session begins trading. Stochastics and the RSI are neutral to bullish signaling that sideways to higher prices are possible near-term. Closes above the 20-day moving average crossing at $6.77 1/2 would signal that a short-term low has been posted. If September renews the decline off June's high, May's low crossing at $5.87 3/4 is the next downside target. First resistance is the 20-day moving average crossing at $6.77 1/2. Second resistance is June's high crossing at $7.70 1/4. First support is last-Thursday's low crossing at $6.22. Second support is May's low crossing at $5.87 3/4.
September Kansas City wheat was sharply higher overnight and sets the stage for a higher opening when the day session begins trading later this morning. Stochastics and the RSI have turned bullish signaling that sideways to higher prices are possible near-term. If September extends the overnight rally, the July 6th high crossing at $8.55 3/4 is the next upside target. If September renews the decline off July's high, July's low crossing at $7.87 1/4 is the next downside target. First resistance is July's high crossing at $8.55 3/4. Second resistance is June's high crossing at $8.89 1/2. First support is last-Wednesday's low crossing at $7.92. Second support is July's low crossing at $7.87 1/4. Third support is the June 14th low crossing at $7.76 3/4.
September Minneapolis wheat was higher overnight. Overnight trading sets the stage for a higher opening when the day session begins trading. Stochastics and the RSI are neutral to bullish signaling that sideways to higher prices are possible near-term. If September extends the rally off July's low, April's high crossing at $9.10 1/2 is the next upside target. Closes below the 20-day moving average crossing at $8.57 1/2 would signal that a short-term top has been posted. First resistance is Monday's high crossing at $9.00. Second resistance is April's high crossing at $9.10 1/2. First support is the 20-day moving average crossing at $8.57 1/2. Second support is the 50-day moving average crossing at $8.38 1/4. Second support is July's low crossing at $8.07 1/4.
SOYBEAN COMPLEX? http://quotes.ino.com/ex?changes/?c=grains "
November soybeans were higher overnight and sets the stage for a higher opening when the day session begins trading later this morning. Stochastics and the RSI are overbought but remain neutral to bullish signaling that sideways to higher prices are possible near-term. If November extends the rally off May's low, the May-2022 high crossing at $14.35 is the next upside target. Closes below the 20-day moving average crossing at $13.42 1/4 would signal that a short-term top has been posted. First resistance is the 87% retracement level of the 2022-2023 decline crossing at $14.07 1/2. Second resistance is the May-2022 high crossing at $14.35. First support is the 20-day moving average crossing at $13.42 1/4. Second support is the July 7th low crossing at $13.15 1/2.
December soybean meal was higher overnight and sets the stage for a higher opening when the day session begins trading. Stochastics and the RSI are overbought but remain bullish signaling that sideways to higher prices are possible near-term. If December extends the rally off the June 29th low, the 87% retracement level of the March-May decline crossing at $428.00 is the next upside target. Closes below the 20-day moving average crossing at $399.00 would confirm that a short-term top has been posted. First resistance is the 75% retracement level of the March-May decline crossing at $418.80. Second resistance is the 87% retracement level of the March-May decline crossing at $428.00. First support is the 20-day moving average crossing at $399.00. Second support is the 50-day moving average crossing at $387.80.
December soybean oil is working on a possible inside day and was higher overnight as it extends the trading range of the past two-weeks. Overnight strength sets the stage for a higher opening when the day session begins trading. Stochastics and the RSI are neutral to bullish signaling that sideways to higher prices are possible near-term. If December renews the rally off May's low, the 75% retracement level of the 2022-2023 decline crossing at 65.45 is the next upside target. Closes below the 20-day moving average crossing at 58.36 would signal that a short-term top has been posted. First resistance is the 62% retracement level of the 2022-2023 decline crossing at 61.75. Second resistance is the 75% retracement level of the 2022-2023 decline crossing at 65.45. First support is the 20-day moving average crossing at 58.36. Second support is the June 29th low crossing at 54.67.
Thanks much, tallipine!
The last 6z GEFS that came out 2 hours ago, added a bunch of rain, which appears to be why the rains are dropping back down.
Maps in a minute.
The GEFS has been adding back rains the last couple of solutions, especially in the one that came out just over 2 hours ago.
The pattern is really not changed at all. However, it just sees more productively in the northwest flow around the periphery of the heat dome.
The NWS yesterday, added a bunch of rain in their extended outlooks which surprised me but THIS model is agreeing with that.
The Canadian and European models were actually drier overnight, so there is tremendous uncertainty.
1. Yesterdays 12z GEFS rains-near the close
2. Last nights 0z model, 12 hours later
3. This mornings 6z GFS run 18 hours later, around 7am CDT this morning.
To help you see the difference, note the states of IA and OH that see much more rains on the 2nd and especially the 3rd maps.
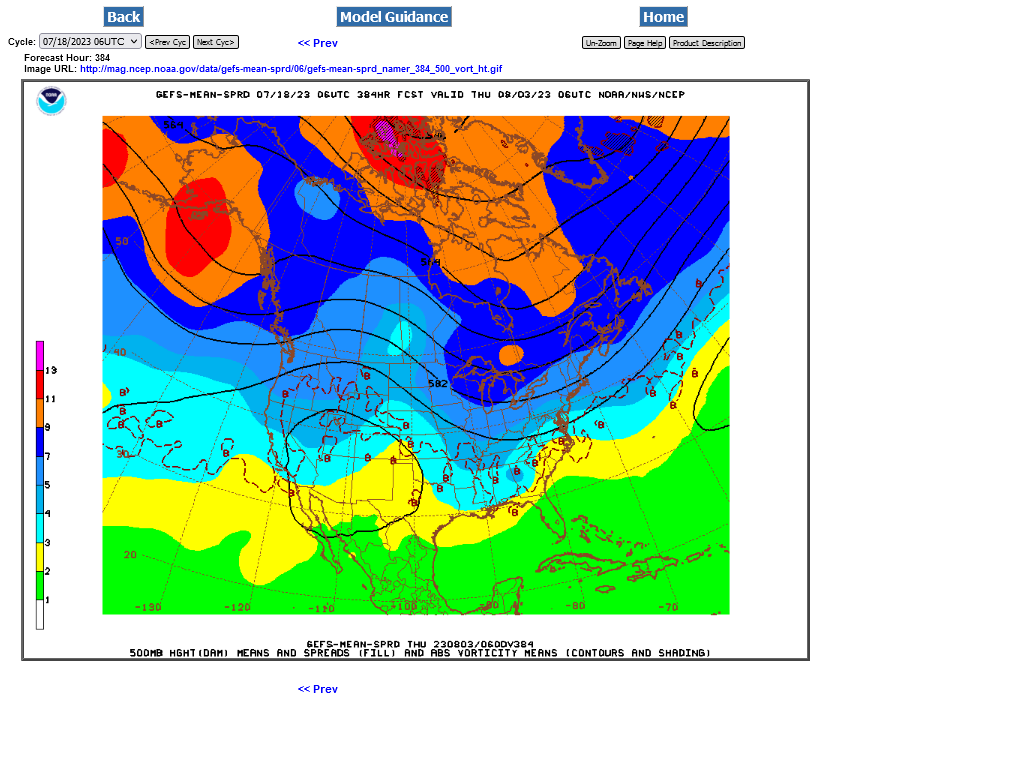
4. Upper levels 12z from yesterday
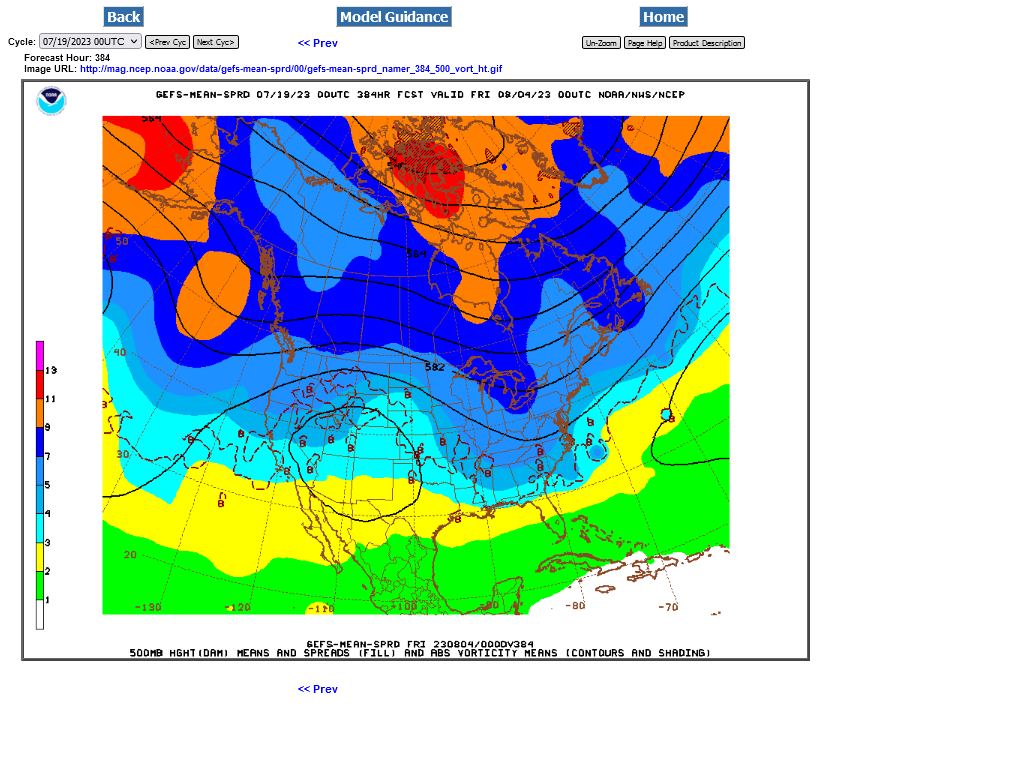
5. Upper levels for the last 6z run
The upper level trough in the Great Lakes has deepened and backed up slightly and this is the reason for more rains, especially because the gradient between it and the dome tightens and that will strengthen/amplify any perturbations in the northwest flow.
Note the 588 contour dropping from sw Minn to wc IA. The 582 contour from c Mich down to the IN border.


20 hours ago
2 hours ago