KEY EVENTS TO WATCH FOR:
Thursday, July 13, 2023
8:30 AM ET. Unemployment Insurance Weekly Claims Report - Initial Claims
Jobless Claims (previous 248K)
Jobless Claims, Net Chg (previous +12K)
Continuing Claims (previous 1720000)
Continuing Claims, Net Chg (previous -13K)
8:30 AM ET. June PPI
PPI, M/M% (previous -0.3%)
Ex-Food & Energy PPI, M/M% (previous +0.2%)
Personal Consumption (previous -0.4%)
8:30 AM ET. U.S. Weekly Export Sales
10:30 AM ET. EIA Weekly Natural Gas Storage Report
Working Gas In Storage (Cbf)
Working Gas In Storage, Net Chg (Cbf)
2:00 PM ET. June Monthly Treasury Statement of Receipts and Outlays of the U.S. Government
4:30 PM ET. Federal Discount Window Borrowings
4:30 PM ET. Foreign Central Bank Holdings
The STOCK INDEXES? http://quotes.ino.com/ex?changes/?c=indexes
The Dow gapped up and closed higher on Wednesday as it extends the rally off Monday's low. The low-range close sets the stage for a steady to slightly higher opening when Thursday's day session begins trading. Stochastics and the RSI are neutral to bullish signaling that sideways to higher prices are possible near-term. If the Dow renews the rally off the June 26th low, the December-2022 high crossing at 34,712.28 is the next upside target. Closes below the 20-day moving average crossing at 34,077.90 would signal that a short-term top has been posted. First resistance is June's high crossing at 34,588.68. Second resistance is the December-2022 high crossing at 34,712.28. First support is the 20-day moving average crossing at 34,077.90. Second support is the 50-day moving average crossing at 33,678.43.
The September NASDAQ 100 closed sharply higher on Wednesday. The high-range close sets the stage for a steady to higher opening when Thursday's night session begins trading. Stochastics and the RSI are neutral to bullish signaling sideways to higher prices are possible. If September resumes this year's rally, the 87% retracement level of the 2021-2022-decline on the weekly continuation chart crossing at 15,957.86 is the next upside target. Closes below Monday's low crossing at 15,063.25 would signal that a short-term top has been posted. First resistance is today's high crossing at 15,507.75. Second resistance is the 87% retracement level of the 2020-2022-decline on the weekly continuation chart crossing at 15,957.86. First support is the June 26th low crossing at 14,853.50. Second support is June's low crossing at 14,420.00.
The September S&P 500 closed higher on Wednesday as it posted a new high for the year. The high-range close sets the stage for a steady to higher opening when Thursday's night session begins trading. Stochastics and the RSI are neutral to bullish signaling that sideways to higher prices are possible near-term. If September extends the rally off March's low, the 87% retracement level of the 2022 decline on the weekly chart crossing at 4639.07 is the next upside target. Closes below Monday's low crossing at 4411.25 would signal that a short-term top has been posted. First resistance is the 75% retracement level of the 2022 decline on the weekly chart crossing at 4505.40. Second resistance is the 87% retracement level of the 2022 decline on the weekly chart crossing at 4639.07. First support is Monday's low crossing at 4411.25. Second support is the June 26th low crossing at 4368.50.
INTEREST RATES? http://quotes.ino.com/ex?changes/?c=interest ""
September T-bonds closed up 1-11/32's at 125-22.
September T-bonds closed sharply higher on Wednesday as it consolidates some of the decline off April's high. The high-range close sets the stage for a steady to higher opening when Thursday's day session begins trading. Stochastics and the RSI are neutral to bullish signaling that sideways to higher prices are possible near-term. Closes above the 20-day moving average crossing at 126-16 would confirm that a short-term low has been posted while opening the door for additional gains near-term. If September renews the decline off April's high, the March 22nd low on the weekly continuation chart crossing at 122-22 is the next downside target. First resistance is the 20-day moving average crossing at 126-16. Second resistance is the 50-day moving average crossing at 127-28. First support is Monday's low crossing at 122-30. Second support is the March 22nd low on the weekly continuation chart crossing at 122-22.
September T-notes closed up 310-pts. at 112.075.
September T-notes closed sharply higher on Wednesday as it extends the rally off last-Thursday's low. The high-range close sets the stage for a steady to higher opening when Thursday's day session begins trading. Stochastics and the RSI are neutral to bullish signaling that sideways to higher prices are possible near-term. Closes above the 20-day moving average crossing at 112.119 would signal that a short-term low has been posted. If September renews the decline off May's high, the October 21st low on the weekly continuation chart crossing at 108.265 is the next downside target. First resistance is the 20-day moving average crossing at 112.119. Second resistance is the June 13th high crossing at 114.000. First support is last-Thursday's low crossing at 110.050. Second support is the October 21st low on the weekly continuation chart crossing at 108.265.
ENERGY MARKETS? http://quotes.ino.com/ex?changes/?c=energy ""
August crude oil closed higher on Wednesday as it extends the rally off the June 28th low crossing at $67.05. The high-range close sets the stage for a steady to higher opening when Thursday's day session begins. Stochastics and the RSI are overbought but remain neutral to bullish signaling that sideways to higher prices are possible near-term. If August extends the aforementioned rally, the 75% retracement level of the April-May decline crossing at $77.85 is the next upside target. Closes below the 20-day moving average crossing at $71.07 would signal that a short-term top has been posted. First resistance is today's high crossing at $76.15. Second resistance is the the 75% retracement level of the April-May decline crossing at $77.85. First support is the 20-day moving average crossing at $71.07. Second support is the June 12thlow crossing at $66.96.
September heating oil closed higher on Tuesday as it extends the rally off May's low. The high-range close sets the stage for a steady to higher opening when Wednesday's day trading session begins. Stochastics and the RSI are overbought but are neutral to bullish signaling that sideways to higher prices are possible near-term. If September extends the rally off May's low, April's high crossing at 2.6618 is the next upside target. Closes below the 20-day moving average crossing at 2.4459 would signal that a short-term top has been posted. First resistance is April's high crossing at 2.6618. Second resistance is the 50% retracement level of the 2022-2023 decline crossing at 2.7273. First support is the 20-day moving average crossing at 2.4459. Second support the 50-day moving average crossing at 2.3890.
September unleaded gas closed sharply higher on Wednesday as it extends the rally off May's low. The high-range close sets the stage for a steady to higher opening when Thursday's day session begins trading. Stochastics and the RSI are overbought but remain neutral to bullish signaling that sideways to higher prices are possible near-term. If September extends the rally off the June 23rd low, April's high crossing at 2.6388 is the next upside target. Closes below the 20-day moving average crossing at 2.4432 would confirm that a short-term top has been posted. First resistance is today's high crossing at 2.6023. Second resistance is April's high crossing at 2.6388. First support is the 20-day moving average crossing at 2.4432. Second support is the 50-day moving average crossing at 2.3922.
September Henry natural gas closed lower on Wednesday. The low-range close sets the stage for a steady to lower opening when Thursday's day session begins trading. Stochastics and the RSI are turning neutral to bullish signaling that sideways to higher prices are possible near-term. If September resumes the rally off June's low, the 25% retracement level of the 2022-2023 decline crossing at 3.193 is the next upside target. Closes below the 50-day moving average crossing at 2.551 would open the door for a possible test of June's low crossing at 2.249. First resistance is the June high crossing at 2.911. Second resistance is the 25% retracement level of the 2022-2023 decline crossing at 3.193. First support is the 50-day moving average crossing at 2.551. Second support is the June 1st low crossing at 2.249.
CURRENCIES? http://quotes.ino.com/ex?changes/?c=currencies ""
The September Dollar closed sharply lower on Wednesday as it extended the decline off last-Thursday's high. The low-range close sets the stage for a steady to lower opening when Thursday's session begins trading. Stochastics and the RSI are oversold but remain neutral to bearish signaling that sideways to lower prices are possible near-term. If September extends the decline off last-Thursday's high, weekly support on the weekly continuation chart crossing at 97.73 is the next downside target. Closes above the 50-day moving average crossing at 102.462 would signal that a short-term low has been posted. First resistance is the 50-day moving average crossing at 102.462. Second resistance is last-Thursday's high crossing at 103.275. First support is today's low crossing at 100.180. Second support is weekly support on the continuation chart crossing at 97.73.
The September Euro closed sharply higher on Wednesday as it extended the rally off May's low. The high-range close sets the stage for a steady to higher opening when Thursday's day session begins trading. Stochastics and the RSI are overbought bur remain neutral to bullish signaling that sideways to higher prices are possible near-term. If September extends the rally off last-Thursday's low, the 38% retracement level of the 2018-2022 decline crossing at 1.12547 is the next upside target. Closes below the 50-day moving average crossing at $1.09322 would signal that a short-term top has been posted. First resistance is today's high crossing at $1.1785. Second resistance is the 38% retracement level of the 2018-2022 decline crossing at 1.12547. First support is the 20-day moving average crossing at 1.09715. Second support is the 50-day moving average crossing at $1.09322.
The September British Pound closed higher on Wednesday as it extends this year's rally. The high-range close sets the stage for a steady to higher opening when Thursday's day session begins trading. Stochastics and the RSI are overbought but remain neutral to bullish signaling sideways to higher prices are possible near-term. If September extends the rally off May's low, the 75% retracement level of the 2022-2023 decline crossing at 1.3253 is the next upside target. Closes below the 20-day moving average crossing at 1.2759 would signal that a short-term top has been posted. First resistance is today's high crossing at 1.3005. Second resistance is the 75% retracement level of the 2022-2023 decline crossing at 1.3253. First support is the 20-day moving average crossing at 1.2759. Second support is the 50-day moving average crossing at 1.2609.
The September Swiss Franc closed sharply higher on Wednesday for the fifth-day in a row as it extends the rally off May's low The high-range close sets the stage for a steady to higher opening when Thursday's day session begins trading. Stochastics and the RSI are overbought but remain neutral to bullish signaling that sideways to higher prices are possible near-term. If September extends the rally off May's low, the January 2021 high crossing at 1.17430 is the next upside target. Closes below the 50-day moving average crossing at 1.12736 would signal that a short-term top has been posted. First resistance is today's high crossing at 1.16320. Second resistance is the January 2021 high crossing at 1.17430. First support is the 50-day moving average crossing at 1.12736. Second support is the June 30th low crossing at 1.11790.
The September Canadian Dollar closed higher on Wednesday as it extends the rally off last-Friday's low. The mid-range close sets the stage for a steady to higher opening when Thursday's day session begins trading. Stochastics and the RSI are neutral to bullish signaling that sideways to higher prices are possible near-term. If September extends today's rally, the 38% retracement level of the 2021-2022 decline crossing at 76.28 is the next upside target. Closes below the 50-day moving average crossing at 74.88 would open the door for additional weakness near-term. First resistance is the 38% retracement level of the 2021-2022 decline crossing at 76.28. Second resistance is the September 12th high crossing at 77.11. First support is the 50-day moving average crossing at 74.88. Second support is last-Friday's low crossing at 74.78.
The September Japanese Yen closed higher for the fifth-day in a row on Wednesday and above the 50-day moving average crossing at 0.072856. The high-range close sets the stage for a steady to higher opening when Thursday’s day session begins trading. Stochastics and the RSI are overbought but remain bullish signaling that sideways to higher prices are possible near-term. If September extends the rally off June's low, June's high crossing at 0.073430 is the next upside target. Closes below the 10-day moving average crossing at 0.070779 would signal that a short-term top has been posted. First resistance is June's high crossing at 0.073430. Second resistance is the 38% retracement level of the January-June decline crossing at 0.074017 is the next upside target. First support is the 20-day moving average crossing at 0.071105. Second support is the 10-day moving average crossing at 0.070779.
PRECIOUS METALS? http://quotes.ino.com/ex?changes/?c=metals ""
August gold closed sharply higher on Wednesday as it extends the rally off June's low. The high-range close sets the stage for a steady to higher opening when Thursday's day session begins trading. Stochastics and the RSI are neutral to bullish signaling that sideways to higher prices are possible near-term. If August extends the rally off June's low, the 50-day moving average crossing at $1979.10 is the next upside target. If August resumes the decline off May's high, the 50% retracement level of the 2022-2023 rally crossing at $1892.30. First resistance is the 50-day moving average crossing at $1979.10. Second resistance is June's high crossing at $2000.70. First support is June's low crossing at $1911.40. Second support is the 50% retracement level of the 2022-2023 rally crossing at $1892.30.
September silver closed sharply higher on Wednesday and above the 50-day moving average crossing at 24.068 confirming that a low has been posted. The high-range close sets the stage for a steady to higher opening when Thursday's day session begins trading. Stochastics and the RSI are neutral to bullish signaling that sideways to higher prices are possible near-term. If July extends the rally off June's low, June's high crossing at 24.835 is the next upside target. Closes below the 10-day moving average crossing at 23.257 would signal that a short-term top has been posted. First resistance is June's high crossing at 24.835. Second resistance is May's high crossing at 26,630. First support is June's low crossing at 22.140. Second support is the 75% retracement level of the March-April rally crossing at 21.982.
September copper closed sharply higher on Wednesday as it extends the rally off the June 29th low. The high-range close sets the stage for a steady to higher opening when Thursday's day session begins trading. Stochastics and the RSI are neutral to bullish signaling that sideways to higher prices are possible near-term. Today's close above the 20-day moving average crossing at 3.8159 opens the door for a possible test of June's high crossing at 3.9640. If September resumes the decline off June's high, June's low crossing at 3.6600 is the next downside target. First resistance is June's high crossing at 3.9640. Second resistance is May's high crossing at 4.0100. First support is June's low crossing at 3.6600. Second support is May's low crossing at 3.5650.
GRAINS? http://quotes.ino.com/ex?changes/?c=grains "
December Corn closed down $0.17 3/4-cents at $4.83 3/4.
December corn closed sharply lower on Wednesday following today's bearish WASDE report. Today's decline renewed the decline off June's high and opens the door for additional weakness near-term. The low-range close sets the stage for a steady to lower opening when Thursday's night session begins trading. Stochastics and the RSI are oversold but remain bearish signaling that sideways to lower prices are possible near-term. If December extends the decline off June's high, the September 2022 low crossing at $4.62 1/2 is the next downside target. Closes above the 50-day moving average crossing at $5.31 1/4 would signal that a short-term low has been posted. First resistance is the 10-day moving average crossing at $5.03. Second resistance is the 50-day moving average crossing at $5.31 1/4. First support is today's low crossing at $4.81 3/4. Second support is the September 2022 low crossing at $4.62 1/2.
September wheat closed down $0.27 3/4-cents at $6.32 3/4.
September wheat closed sharply lower on Wednesday as it renews the decline off June's high. The low-range close sets the stage for a steady to lower opening when Thursday's day session begins trading. Stochastics and the RSI are oversold but remain neutral to bearish signaling that sideways to lower prices are possible near-term. If September extends the decline off June's high, the June 8th low crossing at $6.23 1/4 is the next downside target. Closes above the 20-day moving average crossing at $6.80 1/4 would signal that a short-term low has been posted. First resistance is the 20-day moving average crossing at $6.80 1/4. Second resistance is June's high crossing at $7.70 1/4. First support is today's low crossing at $6.32. Second support is the June 8th low crossing at $6.23 1/4.
September Kansas City Wheat closed down $0.14-cents at $8.03.
September Kansas City wheat closed sharply lower on Wednesday as it extends this week's decline. The low-range close sets the stage for a steady to lower opening when Thursday's day session begins trading. Stochastics and the RSI are neutral to bearish signaling that sideways to lower prices are possible near-term. If September renews the decline off June's high, the July 3rd low crossing at $7.87 1/4 is the next downside target. Closes above today's high crossing at $8.27 3/4 would temper the near-term bearish outlook. First resistance is last-Thursday's high crossing at $8.55 3/4. Second resistance is June's high crossing at $8.89 1/2. First support is the July 3rd low crossing at $7.87 1/4. Second support is the June 14th low crossing at $7.76 3/4.
September Minneapolis wheat closed down $0.10 1/2-cents crossing at $8.53 1/2.
September Minneapolis wheat closed lower on Wednesday. The low-range close sets the stage for a steady to lower opening when Thursday's day session begins trading. Stochastics and the RSI are neutral to bullish signaling that sideways to higher prices are possible near-term. If September extends the rally off July's low, June's high crossing at $8.94 1/2 is the next upside target. Closes below the 50-day moving average crossing at $8.31 1/4 would temper the near-term friendly outlook. First resistance is today's high crossing at $8.71 1/2. Second resistance is June's high crossing at $8.94 1/2. First support is July's low crossing at $8.07 1/4. Second support is the June 14th low crossing at $8.01 1/4.
SOYBEAN COMPLEX? http://quotes.ino.com/ex?changes/?c=grains "
November soybeans closed down $0.32 1/2-cents at $13.27 3/4.
November soybeans closed sharply lower on Wednesday and the low-range close sets the stage for a steady to lower opening when Thursday's day session begins trading. Stochastics and the RSI are turning neutral to bearish signaling that sideways to lower prices are possible near-term. Closes below the 20-day moving average crossing at $13.18 1/2 would signal that a short-term top has been posted. If November renews the rally off the June 28th low, the 87% retracement level of the 2022-2023 decline crossing at $14.07 1/2 is the next upside target. First resistance is last-Monday's high crossing at $13.91 3/4. Second resistance is the 87% retracement level of the 2022-2023 decline crossing at $14.07 1/2. First support is the 10-day moving average crossing at $13.27 1/4. Second support is the 20-day moving average crossing at $13.18 1/2.
December soybean meal closed down $8.70 at $390.40.
December soybean meal posted a downside reversal and closed lower on Wednesday signaling that a short-term top has likely been posted. The low-range close sets the stage for a steady to lower opening when Wednesday's day session begins trading. Stochastics and the RSI are neutral to bullish signaling that sideways to higher prices are possible near-term. Closes above last-Monday's high crossing at $415.20 are needed to renew the rally off June's low. If December renews the decline off June's high, the June 29th low crossing at $374.60 is the next downside target. First resistance is the 75% retracement level of the March-May decline crossing at $418.80. Second resistance is June's high crossing at $438.90. First support is the June 29th low crossing at $374.60. Second support is the June 8th low crossing at $362.40.
December soybean oil closed down 57-pts. at 59.36.
December soybean oil closed lower on Wednesday.The low-range close sets the stage for a steady to lower opening when Thursday's day session begins trading. Stochastics and the RSI are neutral to bullish signaling that sideways to higher prices are possible near-term. If December resumes the rally off May's low, January's high crossing at 61.68 is the next upside target. Closes below the 20-day moving average crossing at 57.18 would signal that a short-term top has been posted. First resistance is the 62% retracement level of the 2022-2023 decline crossing at 61.75. Second resistance is the 75% retracement level of the 2022-2023 decline crossing at 65.45. First support is the 20-day moving average crossing at 57.18. Second support is the 50-day moving average crossing at 52.36.
LIVESTOCKhttp://quotes.ino.com/exchanges/?c=livestock
August hogs closed down $1.93 at $95.65.
August hogs closed lower on Wednesday. The low-range close sets the stage for a steady to lower opening when Thursday's day session begins trading. Stochastics and the RSI are neutral to bullish signaling that sideways to higher prices are possible near-term. If August renews the rally off May's low, the 87% retracement level of the 2022-2023 decline crossing at $104.40 is the next upside target. Closes below the 20-day moving average crossing at $92.61 would signal that a short-term top has been posted. First resistance is the 75% retracement level of the 2022-2023 decline crossing at $100.14. Second resistance is the 87% retracement level of the 2022-2023 decline crossing at $104.40. First support is the 20-day moving average crossing at $92.61. Second support is the 50-day moving average crossing at $87.61.
August cattle closed down $1.88 at $178.73.
August cattle closed sharply lower on Wednesday as it consolidates some of the rally off the June 21st low. The low-range close sets the stage for a steady to lower opening on Wednesday. Stochastics and the RSI are overbought, diverging and are turning neutral to bearish signaling that a short-term top might be in or is near. If August extends this rally rally into uncharted territory, upside targets will be hard to project. Closes below the 20-day moving average crossing at $173.70 would temper the near-term friendly outlook. First resistance is today's high crossing at $181.18. Second resistance is unknown. First support is the 20-day moving average crossing at $173.70. Second support is the June 21st low crossing at $168.10.
August Feeder cattle closed down $0.10 at $247.05.
August Feeder cattle closed slightly lower on Wednesday. The low-range close sets the stage for a steady to lower opening when Thursday's day session begins trading. Stochastics and the RSI are overbought, diverging and are turning neutral to bearish signaling that sideways to higher prices are possible near-term. Closes below the 20-day moving average crossing at $239.65 would signal that a short-term top has been posted. If August extends the rally off June's low into uncharted territory, upside targets will be hard to project. First resistance is today's high crossing at $251.30. Second resistance is unknown. First support is the 20-day moving average crossing at $239.65. Second support is the June 27th gap crossing at $235.25.
FOOD & FIBERhttp://quotes.ino.com/ex changes/?c=food
September coffee closed slightly lower on Wednesday. The low-range close sets the stage for a steady to lower opening on Thursday. Stochastics and the RSI are oversold but remain neutral to bearish signaling sideways to lower prices are possible near-term. If September extends the decline off June's high, the 87% retracement level of the January-April rally crossing at $15.20 is the next downside target. Closes above the 20-day moving average crossing at $16.68 would signal that a short-term low has been posted. First resistance is the 10-day moving average crossing at $15.97. Second resistance is the 20-day moving average crossing at $16.68. First support is the 75% retracement level of the January-April rally crossing at $15.88. Second support is the 87% retracement level of the January-April rally crossing at $15.20.
September cocoa closed slightly higher on Wednesday. The mid-range close sets the stage for a steady to slightly higher opening on Thursday. Stochastics and the RSI are neutral to bullish signaling that sideways to higher prices are possible near-term. Closes below the 20-day moving average crossing at 32.80 would signal that a short-term top has been posted. If September extends the rally off March's low, monthly resistance crossing at 34.29 is the next upside target.
October sugar closed higher on Wednesday as it extends the rally off June's low. The high-range close sets the stage for a steady to higher opening on Thursday. Stochastics and the RSI are neutral to bullish signaling that sideways to higher prices are possible near-term. Closes above the 20-day moving average crossing at 24.08 would signal that a short-term low has been posted. If October renews the decline off June's high, the 50% retracement level of the October-April rally crossing at 21.34 is the next downside target.
December cotton closed lower on Wednesday as it consolidated some of the rally off June's low. The low-range close sets the stage for a steady to lower opening on Thursday. Stochastics and the RSI are turning neutral signaling sideways to lower prices are possible near-term. Closes below Monday's low crossing at 78.97 would signal that a short-term top has been posted. If December extends the rally off June's low, May's high crossing at 84.30 is the next upside target.
Thanks tallpine!
USDA dictated market trading today.
The heat dome will stay to our southwest but I really don't think the Upper Midwest and N.Plains will see much rain the next 2 weeks.
Other areas may dry out too, while some areas have nice rains.
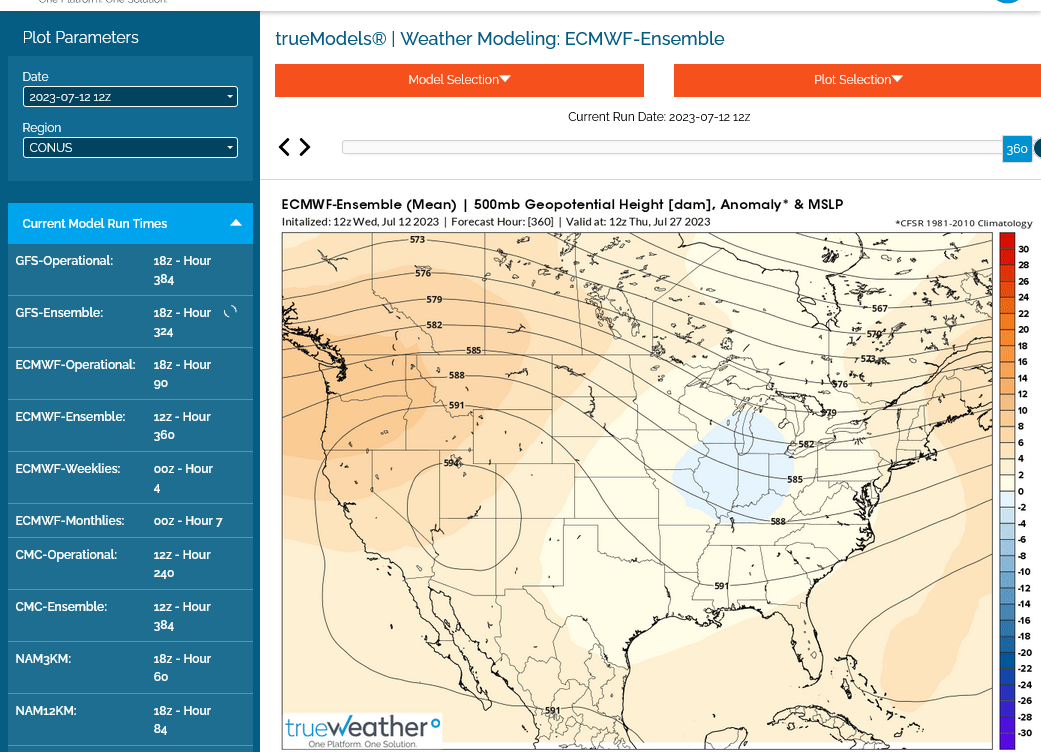
1. Upper level chart at 360 hours. Northwest flow. This is always tricky for rain events. Some can be great, others a big bust. For sure it keeps the intense heat pushed farther west, although some could track over the top of the dome into the N.Plains.
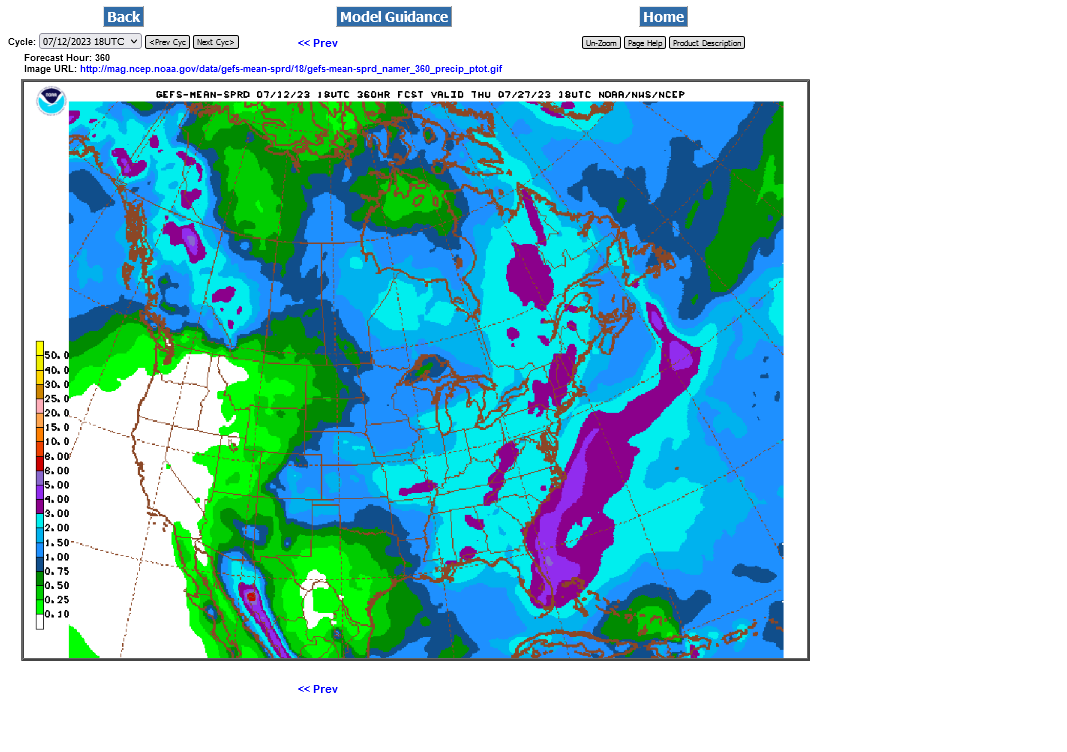
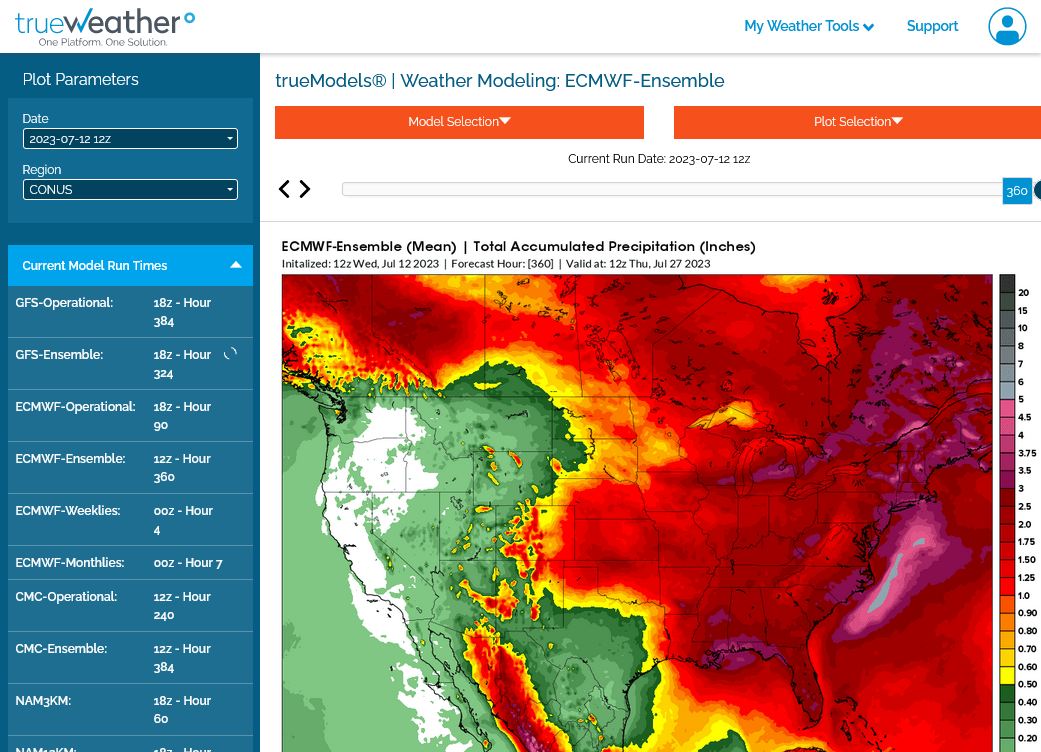
2. Total rains. The Upper Midwest and N.Plains crops will be hurting for moisture. Some places may see less than 50% of the average rain the next 2 weeks in those locations. Farther east/southeast the odds are better to get average+ and over 2 inches is some locations. Less than that in a few others. There is no Bermuda high pumping in moisture and this pattern is not that different than the one that caused the drought in May/June. Historically, northwest flow in July is more productive than in May/June but the models could be over forecasting the rains here. Slight changes and we could take out enough rain for the forecast to suddenly turn pretty bullish (or to become bearish).
I will lean bullish from the dry-ish northestern belt.
This is the 18z GEFS that almost completely out.
Less than 1.5 inches of rain for the northwest half of the belt is bullish to me.