KEY EVENTS TO WATCH FOR:
Wednesday, July 12, 2023
7:00 AM ET. MBA Weekly Mortgage Applications Survey
Composite Idx (previous 206.5)
Composite Idx, W/W% (previous -4.4%)
Purchase Idx-SA (previous 162.4)
Purchase Idx-SA, W/W% (previous -4.6%)
Refinance Idx (previous 421.3)
Refinance Idx, W/W% (previous -4.1%)
8:30 AM ET. June CPI
CPI, M/M% (previous +0.1%)
Core CPI, M/M% (previous +0.4%)
Energy Idx, M/M% (previous -3.6%)
Food Idx, M/M% (previous +0.2%)
Real Avg Wkly Pay-Infla Adj, M/M% (previous -0.1%)
CPI, Y/Y% (previous +4.0%)
Core Annual, Y/Y% (previous +5.3%)
8:30 AM ET. June Real Earnings
10:00 AM ET. June Online Help Wanted Index
10:30 AM ET. EIA Weekly Petroleum Status Report
Crude Oil Stocks (Bbl) (previous 452.182M)
Crude Oil Stocks, Net Chg (Bbl) (previous -1.508M)
Gasoline Stocks (Bbl) (previous 219.456M)
Gasoline Stocks, Net Chg (Bbl) (previous -2.549M)
Distillate Stocks (Bbl) (previous 113.366M)
Distillate Stocks, Net Chg (Bbl) (previous -1.045M)
Refinery Usage (previous 91.1%)
Total Prod Supplied (Bbl/day) (previous 21.235M)
Total Prod Supplied, Net Chg (Bbl/day) (previous +0.929M)
12:00 PM ET. World Agricultural Supply & Demand Estimates (WASDE)
Corn, End Stocks (Bushels)
Soybeans, End Stocks (Bushels)
Wheat, End Stocks (Bushels)
Cotton, End Stocks (Bales)
2:00 PM ET. U.S. Federal Reserve Beige Book
Thursday, July 13, 2023
8:30 AM ET. Unemployment Insurance Weekly Claims Report - Initial Claims
Jobless Claims (previous 248K)
Jobless Claims, Net Chg (previous +12K)
Continuing Claims (previous 1720000)
Continuing Claims, Net Chg (previous -13K)
8:30 AM ET. June PPI
PPI, M/M% (previous -0.3%)
Ex-Food & Energy PPI, M/M% (previous +0.2%)
Personal Consumption (previous -0.4%)
8:30 AM ET. U.S. Weekly Export Sales
10:30 AM ET. EIA Weekly Natural Gas Storage Report
Working Gas In Storage (Cbf)
Working Gas In Storage, Net Chg (Cbf)
2:00 PM ET. June Monthly Treasury Statement of Receipts and Outlays of the U.S. Government
4:30 PM ET. Federal Discount Window Borrowings
4:30 PM ET. Foreign Central Bank Holdings
The STOCK INDEXES? http://quotes.ino.com/ex?changes/?c=indexes
The STOCK INDEXES: The September NASDAQ 100 was slightly higher overnight and set the stage for a higher opening when the day session begins trading. Stochastics and the RSI have turned neutral to bullish signaling that sideways to higher prices are possible near-term. If September renews this year's rally, the 87% retracement level of the 2021-2022-decline on the weekly continuation chart crossing at 15,957.86 is the next upside target. Closes below the June 26th low crossing at 14,853.50 would confirm that a double top has been posted. First resistance is the June 16th high crossing at 15,475.50. Second resistance is the 87% retracement level of the 2021-2022-decline on the weekly continuation chart crossing at 15,957.86. First support is the June 26th low crossing at 14,853.50. Second support is the June 6th low crossing at 14,420.00.
The September S&P 500 was slightly higher overnight as it extends the rally off Monday's low. Overnight trading sets the stage for a slightly higher opening when the day session begins trading. Stochastics and the RSI are neutral to bullish signaling that sideways to higher prices are possible near-term. If June resumes the rally off March's low, the 75% retracement level of the 2022 decline crossing at 4505.40 is the next upside target. Closes below the June 26th low crossing at 4368.50 would confirm that a double top has been posted. First resistance is June's high crossing at 4498.00. Second resistance is the 75% retracement level of the 2022 decline crossing at 4505.40. First support is the June 26th low crossing at 4368.50. Second support is the 50-day moving average crossing at 4316.50.
INTEREST RATES http://quotes.ino.com/ex changes/?c=interest"
INTEREST RATES: September T-bonds was higher overnight and sets the stage for a higher opening when the day session begins trading. Stochastics and the RSI are turning neutral to bullish signaling that sideways to higher prices are possible near-term. Closes above 20-day moving average crossing at 126-14 would signal that a short-term low has been posted. If September resumes the decline off April's high, the March 22nd low on the continuation chart crossing at 122-22 is the next downside target. First resistance is the 10-day moving average crossing at 125-13. Second resistance is the 20-day moving average crossing at 126-14. First support is Monday's low crossing at 122-30. Second support is the March 22nd low on the weekly continuation chart crossing at 122-22.
September T-notes were slightly higher overnight as it extends the rally off last-Thursday's low. Overnight trading sets the stage for a slightly higher opening when the day session begins trading. Stochastics and the RSI are neutral to bullish signaling that sideways to higher prices are possible near-term. Closes above the 20-day moving average crossing at 112.108 would signal that a short-term low has been posted. If September renews the decline off May's high, the October-2022 low on the weekly continuation chart crossing at 108.265 is the next downside target. First resistance is the 10-day moving average crossing at 111.194. Second resistance is the 20-day moving average crossing at 112.106. First support is last-Thursday's low crossing at 110.050. Second support is the October-2022 low on the weekly continuation chart crossing at 108.265.
ENERGY MARKETS? http://quotes.ino.com/ex?changes/?c=energy ""
ENERGIES:Augustcrude oil was slightly higher overnight and sets the stage for a higher opening when the day session begins trading. Stochastics and the RSI are overbought but remain bullish signaling that sideways to higher prices are possible near-term. If August extends the rally off the June 28th low, the June 5th high crossing at $75.70 is the next upside target. Closes below the 20-day moving average crossing at $71.01 would signal that a short-term top has been posted. First resistance is today's high crossing at $75.25. Second resistance is the June 5th high crossing at $75.70. First support is the 20-day moving average crossing at $71.01. Second support is the June 28th low crossing at $67.05.
August heating oil was slightly higher overnight and set sets the stage for a slightly higher opening when the day session begins trading. Stochastics and the RSI are overbought but remain neutral to bullish signaling that sideways to higher prices are possible near-term. If August extends the rally off May's low, the 38% retracement level of the 2022-2023 decline crossing at 2.6107 is the next upside target. Closes below the 20-day moving average crossing at 2.4532 would signal that a short-term top has been posted. First resistance is Tuesday's high crossing at 2.5962. Second resistance isthe 38% retracement level of the 2022-2023 decline crossing at 2.6107. First support is the 20-day moving average crossing at 2.4532. Second support is the 50-day moving average crossing at 2.3881.
September unleaded gas was slightly higher overnight as it extends the rally off May's low. Overnight trading sets the stage for a slightly higher opening when the day session begins trading. Stochastics and the RSI are overbought but remain neutral to bullish signaling that sideways to higher prices are possible near-term. If September extends the rally off May's low, the 87% retracement level of the April-May decline crossing at $2.5764 is the next upside target. Closes below the 20-day moving average crossing at 2.4405 would signal that a short-term top has been posted. First resistance is the 87% retracement level of the April-May decline crossing at $2.5764. Second resistance is April's high crossing at $2.6388. First support is the 20-day moving average crossing at $2.4405. Second support is the 50-day moving average crossing at $2.3912.
September natural gas was slightly higher overnight and sets the stage for a slightly higher opening when the day session begins trading. Stochastics and the RSI are turning neutral to bullish signaling that sideways to higher prices are possible near-term. If August renews the rally off June's low, the 25% retracement level of the 2022-2023 decline crossing at 3.193 is the next upside target. Closes below the 50-day moving average crossing at 2.552 would signal that a short-term low has been posted while opening the door for additional weakness near-term. First resistance is the June 26th high crossing at 2.911. Second resistance is the 25% retracement level of the 2022-2023 decline crossing at 3.193. First support is the 50-day moving average crossing at 2.552. Second support is the June 1st low crossing at 2.249.
CURRENCIEShttp://quotes.ino.com/ex changes/?c=currencies"
CURRENCIES:The September Dollar was lower overnight as it extends the decline off last-Thursday's high. Overnight trading sets the stage for a lower opening when the day session begins trading later this morning. Stochastics and the RSI are oversold but remain neutral to bearish signaling that sideways to lower prices are possible near-term. If September extends the decline off last-Thursday's high, May's low crossing at $100.340 is the next downside target. Closes above the 50-day moving average crossing at $102.482 would signal that a short-term low has been posted. First resistance is the 50-day moving average crossing at $102.482. Second resistance is last-Thursday's high crossing at $103.275. First support is the overnight low crossing at $101.030. Second support is May's low crossing at $100.340.
The September Euro was slightly higher overnight and sets the stage for a slightly higher opening when the day session begins trading. Stochastics and the RSI are overbought but remain neutral to bullish signaling that sideways to higher prices are possible near-term. If September resumes the rally off May's low, May's high crossing at $1.11710 is the next upside target. Closes below the 50-day moving average crossing at 1.09299 would signal that a short-term top has been posted while opening the door for additional weakness near-term. First resistance is the overnight high crossing at $1.10740. Second resistance is May's high crossing at $1.11710. First support is last-Thursday's low crossing at 1.08715. Second support is May's low crossing at 1.07025.
The September British Pound was slightly lower in late-overnight trading as it consolidates some of the rally off the June 29th low. Overnight trading and sets the stage for a steady to slightly lower opening when the day session begins trading. Stochastics and the RSI are overbought but remain neutral to bullish signaling that sideways to higher prices near-term. If September extends the rally off May's low, the 75% retracement level of the 2022-2023 decline crossing at 1.3253 is the next upside target. Closes below the 20-day moving average crossing at 1.2756 would signal that a short-term top has been posted. First resistance is the overnight high crossing at 1.2973. Second resistance is the 75% retracement level of the 2022-2023 decline crossing at 1.3253. First support is the 20-day moving average crossing at 1.2756. Second support is the 50-day moving average crossing at 1.2607.
The September Swiss Franc was higher overnight as it extends the rally off May's low. Overnight trading sets the stage for a higher opening when the day session begins trading. Stochastics and the RSI are overbought but remain neutral to bullish signaling that sideways to higher prices are possible near-term. If September extends the rally off May's low, May's high crossing at 1.14920 is the next upside target. Closes below the 50-day moving average crossing at 1.12706 would signal that a short-term top has been posted while opening the door for additional weakness near-term. First resistance is today's high crossing at 1.14915. Second resistance is May's high crossing at 1.14920. First support is the June 30th low crossing at 1.11790. Second support is June's low crossing at 1.10920.
The September Canadian Dollar was higher overnight and sets the stage for a higher opening when the day session begins trading. Stochastics and the RSI are neutral to bullish signaling that sideways to higher prices are possible near-term. Closes above the 20-day moving average crossing at $75.61 would signal that a short-term low has been posted. Closes below the 50-day moving average crossing at $74.87 would open the door for additional weakness near-term. First resistance is the 38% retracement level of the 2022-2023 decline crossing at $76.28. Second resistance is the September-12th -2022 high crossing at $77.11. First support is the 50-day moving average crossing at $74.87. Second support is the June 5th low crossing at $74.45.
The September Japanese Yen was higher overnight as it extends the rally off May's low. Overnight trading sets the stage for a higher opening when the day session begins trading. Stochastics and the RSI are overbought but remain neutral to bullish signaling that sideways to higher prices are possible near-term. If September extends the rally off May's low, the 50-day moving average crossing at 0.072804 is the next upside target. Closes below the 10-day moving average crossing at 0.070721 would signal that a short-term top has been posted. First resistance is the 50-day moving average crossing at 0.072804. Second resistance is June's high crossing at 0.073430. First support is the 20-day moving average crossing at 0.072805. Second support is the 10-day moving average crossing at 0.070721.
PRECIOUS METALS http://quotes.ino.com/ex changes/?c=metals"
Precious Metals: Augustgold was slightly higher overnight and sets the stage for a slightly higher opening when the day session begins trading later this morning. Stochastics and the RSI are neutral to bullish signaling that sideways to higher prices are possible near-term. Closes above the 20-day moving average crossing at $1937.70 would signal that a short-term low has been posted. If August resumes the decline off May's high, the 50% retracement level of the September-May rally crossing at $1892.30 is the next downside target. First resistance is the 20-day moving average crossing at $1937.70. Second resistance is the 50-day moving average crossing at $1978.60. First support is the 50% retracement level of the September-May rally crossing at $1892.30. Second support is the 62% retracement level of the September-May rally crossing at $1842.60.
September silver was steady to slightly higher overnight and sets the stage for a slightly higher opening when the day session begins trading later this morning. Stochastics and the RSI are neutral to bullish signaling that sideways to lower prices are possible near-term. Closes above the 20-day moving average crossing at $23.315 would signal that a short-term low has been posted while opening the door for additional short-term gains. If July resumes the decline off May's high, the 75% retracement level of the March-April rally crossing at $21.982 is the next downside target. First resistance is the 20-day moving average crossing at $23.315. Second resistance is the 50-day moving average crossing at $24.048. First support is the 75% retracement level of the March-April rally crossing at 21.982. Second support is the 87% retracement level of the March-April rally crossing at 21.233.
September copper was slightly higher overnight and sets the stage for a slightly higher opening when the day session begins trading. Stochastics and the RSI are turning neutral to bullish signaling that sideways to higher prices are possible near-term. Closes above the 20-day moving average crossing at 3.8122 would signal that a short-term low has been posted. If September renews the decline off the June 22nd high, the May 31st low crossing at 3.6380 is the next downside target. First resistance the 20-day moving average crossing at 3.8122. Second resistance is the June 22nd high crossing at 3.9640. First support is the June 29th low crossing at 3.6830. Second support is May's low crossing at 3.5650.
GRAINS http://quotes.ino.com/ex changes/?c=grains
Grains: December corn was slightly higher overnight and sets the stage for a slightly higher opening when the day sessions begins trading. Stochastics and the RSI are oversold but remain bearish signaling that sideways to lower prices are possible near-term. If December extends the decline off the June 21st high, the September 2022 low crossing at $4.62 1/2 is the next downside target. Closes above the 50-day moving average crossing at $5.31 3/4 would signal that a short-term low has been posted. First resistance is the 50-day moving average crossing at $5.31 3/4. Second resistance is the 20-day moving average crossing at $5.45 1/4. First support is last-Wednesday's low crossing at $4.85 1/2. Second support is the September 2022 low crossing at $4.62 1/2.
September wheat was lower overnight as it extends the trading range of the past two-weeks. Overnight trading sets the stage for a lower opening when the day session begins trading. Stochastics and the RSI are oversold but remain neutral to bearish signaling that sideways to lower prices are possible near-term. If September renews the decline off June's high, the June 8th low crossing at $6.23 1/4 is the next downside target. Closes above the 20-day moving average crossing at $6.81 1/2 would signal that a short-term low has been posted. First resistance is the 20-day moving average crossing at $6.81 1/2. Second resistance is June's high crossing at $7.70 1/4. First support is last-Monday's low crossing at $6.38. Second support is May's low crossing at $5.87 3/4.
September Kansas City wheat was slightly higher overnight. Overnight trading sets the stage for a slightly higher opening when the day session begins trading later this morning. Stochastics and the RSI are neutral to bearish signaling that sideways to lower prices are possible near-term. If September extends the decline off last-Thursday's high, July's low crossing at $7.87 1/4 is the next downside target. If September renews the rally off July's low, June's high crossing at $8.89 1/2 is the next upside target. First resistance is last-Thursday's high crossing at $8.55 3/4. Second resistance is June's high crossing at $8.89 1/2. First support is July's low crossing at $7.87 1/4. Second support is the June 14th low crossing at $7.76 3/4.
September Minneapolis wheat was steady to slightly lower overnight as it consolidates some of the rally off July's low. Overnight trading sets the stage for a slightly lower opening when the day session begins trading. Stochastics and the RSI are neutral to bullish signaling that sideways to higher prices are possible near-term. If September extends the rally off July's low, June's high crossing at $8.94 1/2 is the next upside target. Closes below the 50-day moving average crossing at $8.31 1/4 would temper the near-term friendly outlook. First resistance is Tuesday's high crossing at $8.69 3/4. Second resistance is June's high crossing at $8.94 1/2. First support is the 50-day moving average crossing at $8.31 1/4. Second support is July's low crossing at $8.07 1/4.
SOYBEAN COMPLEX? http://quotes.ino.com/ex?changes/?c=grains "
November soybeans were higher overnight and sets the stage for a higher opening when the day session begins trading later this morning. Stochastics and the RSI are neutral to bullish signaling that sideways to higher prices are possible near-term. If November renews the rally off May's low, the 87% retracement level of the 2022-2023 decline crossing at $14.07 1/2 is the next upside target. Closes below the 20-day moving average crossing at $13.21 would signal that a short-term top has been posted. First resistance is the 87% retracement level of the 2022-2023 decline crossing at $14.07 1/2. Second resistance is the December 2022 high crossing at $14.27 3/4. First support is the 10-day moving average crossing at $13.32. Second support is the 20-day moving average crossing at $13.21.
December soybean meal was higher overnight as it extends the rally off last-Friday's low. Overnight trading sets the stage for a higher opening when the day session begins trading. Stochastics and the RSI are turning neutral to bullish signaling that sideways to higher prices are possible near-term. If December renews the rally off the June 29th low, the 75% retracement level of the March-May decline crossing at $418.80 is the next upside target. If December resumes last-week's decline, the June 29th low crossing at $374.60 is the next downside target. First resistance is the 75% retracement level of the March-May decline crossing at $418.80. Second resistance is the June 21st high crossing at $432.60. First support is the June 29th low crossing at $374.60. Second support is the June 14th low crossing at $372.80.
December soybean oil was higher overnight and sets the stage for a higher opening when the day session begins trading. Stochastics and the RSI are neutral to bullish signaling that sideways to higher prices are possible near-term. If December renews the rally off May's low, the 75% retracement level of the 2022-2023 decline crossing at 65.45 is the next upside target. Closes below the 20-day moving average crossing at 57.26 would signal that a short-term top has been posted. First resistance is the 62% retracement level of the 2022-2023 decline crossing at 61.75. Second resistance is the 75% retracement level of the 2022-2023 decline crossing at 65.45. First support is the 10-day moving average crossing at 59.03. Second support is the 20-day moving average crossing at 57.26.
Thanks, tallpine!
USDA report coming up is whats moving the price right now.
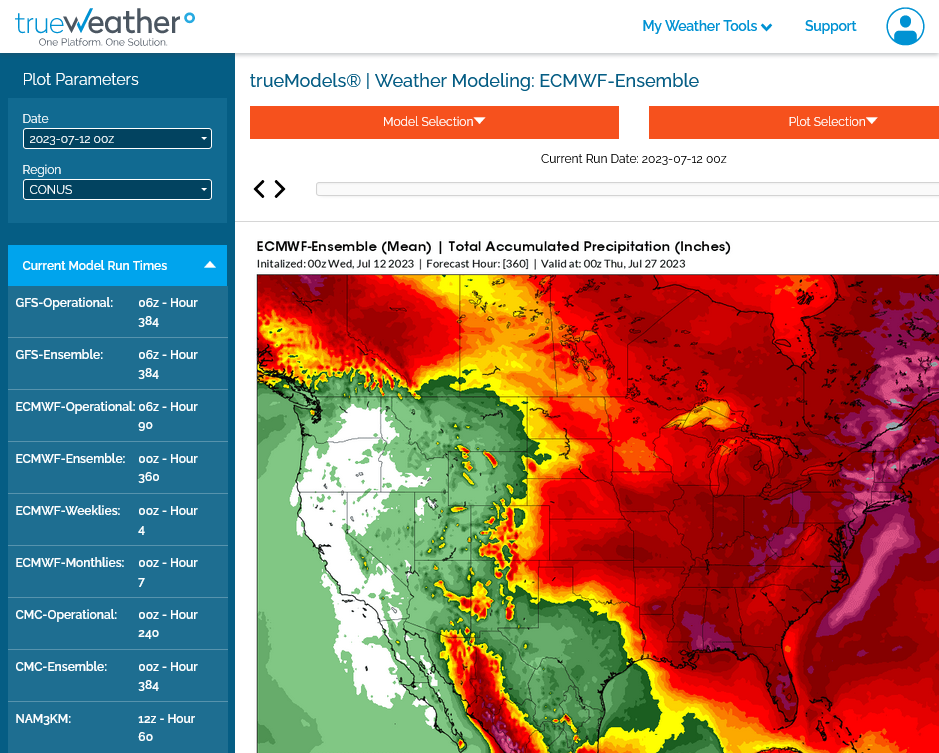
Overnight, the heat dome in the Southwest to Rockies actually backs up, farther from the Midwest and we see cooler weather in the Midwest forecast as a result.
Less of a threat and cooler temps than earlier this week.
The main concern is for rain amounts in the Upper Midwest.
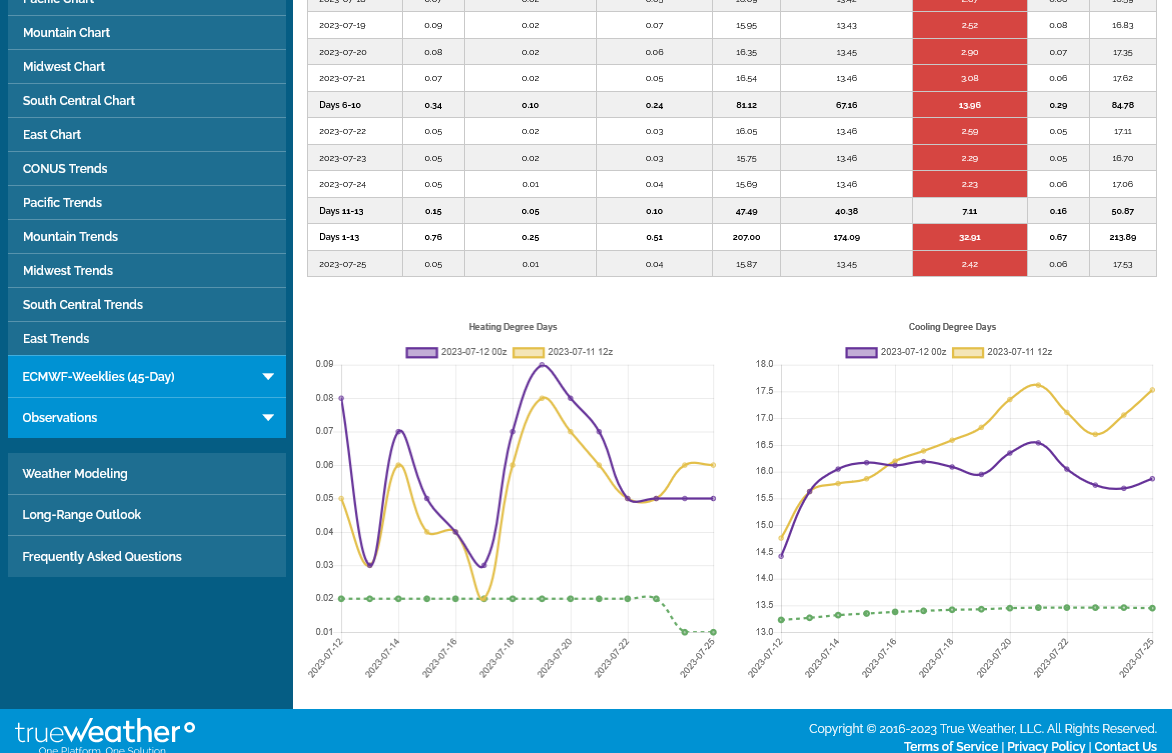
Last 2 week forecast maps from the European model.

0z EE a whopping -7 CDDs. Bottom right purple line. GEFS not that much change.
Amid signs of weak underlying fundamentals, and with forecasts advertising more moderate summer temperatures for population centers in the Midwest and East, natural gas futures gave back some of their recent gains in early trading Wednesday. The August Nymex contract was off 4.5 cents to $2.686/MMBtu at around 8:40 a.m. ET. Even after posting back-to-back…
July 12, 2023
+++++++++
I just gave you the REAL reason that ng is -$850/contract here.