KEY EVENTS TO WATCH FOR:
Monday, July 10, 2023
10:00 AM ET. June Employment Trends Index
ETI (previous 116.15)
ETI, Y/Y%
10:00 AM ET. May Monthly Wholesale Trade
Inventories, M/M% (previous -0.1%)
3:00 PM ET. May Consumer Credit
Consumer Credit Net Chg (USD) (previous +23.0B)
Tuesday, July 11, 2023
6:00 AM ET. June NFIB Index of Small Business Optimism
Small Business Idx (previous 89.4)
8:55 AM ET. Johnson Redbook Retail Sales Index
Ret Sales Mo-to-Date, Y/Y% (previous +0.6%)
Latest Wk, Y/Y% (previous +0.7%)
10:00 AM ET. July IBD/TIPP Economic Optimism Index
Economic Optimism Idx (previous 41.7)
6-Mo Economic Outlook (previous 34.5)
4:30 PM ET. API Weekly Statistical Bulletin
Crude Stocks, Net Chg (Bbls) (previous -4.4M)
Gasoline Stocks, Net Chg (Bbls) (previous +1.6M)
Distillate Stocks, Net Chg (Bbls) (previous +0.6M)
Wednesday, July 12, 2023
7:00 AM ET. MBA Weekly Mortgage Applications Survey
Composite Idx (previous 206.5)
Composite Idx, W/W% (previous -4.4%)
Purchase Idx-SA (previous 162.4)
Purchase Idx-SA, W/W% (previous -4.6%)
Refinance Idx (previous 421.3)
Refinance Idx, W/W% (previous -4.1%)
8:30 AM ET. June CPI
CPI, M/M% (previous +0.1%)
Core CPI, M/M% (previous +0.4%)
Energy Idx, M/M% (previous -3.6%)
Food Idx, M/M% (previous +0.2%)
Real Avg Wkly Pay-Infla Adj, M/M% (previous -0.1%)
CPI, Y/Y% (previous +4.0%)
Core Annual, Y/Y% (previous +5.3%)
8:30 AM ET. June Real Earnings
10:00 AM ET. June Online Help Wanted Index
10:30 AM ET. EIA Weekly Petroleum Status Report
Crude Oil Stocks (Bbl) (previous 452.182M)
Crude Oil Stocks, Net Chg (Bbl) (previous -1.508M)
Gasoline Stocks (Bbl) (previous 219.456M)
Gasoline Stocks, Net Chg (Bbl) (previous -2.549M)
Distillate Stocks (Bbl) (previous 113.366M)
Distillate Stocks, Net Chg (Bbl) (previous -1.045M)
Refinery Usage (previous 91.1%)
Total Prod Supplied (Bbl/day) (previous 21.235M)
Total Prod Supplied, Net Chg (Bbl/day) (previous +0.929M)
12:00 PM ET. World Agricultural Supply & Demand Estimates (WASDE)
Corn, End Stocks (Bushels)
Soybeans, End Stocks (Bushels)
Wheat, End Stocks (Bushels)
Cotton, End Stocks (Bales)
2:00 PM ET. U.S. Federal Reserve Beige Book
Thursday, July 13, 2023
8:30 AM ET. Unemployment Insurance Weekly Claims Report - Initial Claims
Jobless Claims (previous 248K)
Jobless Claims, Net Chg (previous +12K)
Continuing Claims (previous 1720000)
Continuing Claims, Net Chg (previous -13K)
8:30 AM ET. June PPI
PPI, M/M% (previous -0.3%)
Ex-Food & Energy PPI, M/M% (previous +0.2%)
Personal Consumption (previous -0.4%)
8:30 AM ET. U.S. Weekly Export Sales
10:30 AM ET. EIA Weekly Natural Gas Storage Report
Working Gas In Storage (Cbf)
Working Gas In Storage, Net Chg (Cbf)
2:00 PM ET. June Monthly Treasury Statement of Receipts and Outlays of the U.S. Government
4:30 PM ET. Federal Discount Window Borrowings
4:30 PM ET. Foreign Central Bank Holdings
The STOCK INDEXES? http://quotes.ino.com/ex?changes/?c=indexes
The Dow closed higher on Monday as it consolidated some of the decline off the June 30th high. The high-range close sets the stage for a steady to higher opening when Tuesday's day session begins trading. Stochastics and the RSI are neutral to bearish signaling that sideways to lower prices are possible near-term. If the Dow extends last-week's decline, the 50-day moving average crossing at 33,663.27 is the next downside target. If the Dow renews the rally off the June 26th low, the December-2022 high crossing at 34,712.28 is the next upside target. First resistance is June's high crossing at 34,588.68. Second resistance is the December-2022 high crossing at 34,712.28. First support is the 50-day moving average crossing at 33,663.27. Second support is the June 26th low crossing at 33,610.32.
The September NASDAQ 100 closed higher on Monday. The high-range close sets the stage for a steady to slightly lower opening when Tuesday's night session begins trading. Stochastics and the RSI are neutral to bearish signaling sideways to lower prices are possible. Closes below the 20-day moving average crossing at 15,154.40 would signal that a short-term top has been posted. If September resumes this year's rally, the 87% retracement level of the 2021-2022-decline on the weekly continuation chart crossing at 15,957.86 is the next upside target. First resistance is the June 16th high crossing at 15,475.50. Second resistance is the 87% retracement level of the 2020-2022-decline on the weekly continuation chart crossing at 15,957.86. First support is the 20-day moving average crossing at 15,154.40. Second support is June's low crossing at 14,420.00.
The September S&P 500 closed slightly higher on Monday. The high-range close sets the stage for a steady to slightly higher opening when Tuesday's night session begins trading. Stochastics and the RSI are neutral to bearish signaling that sideways to lower prices are possible near-term. Closes below the 20-day moving average crossing at 4429.02 would signal that a short-term top has been posted. If September renews the rally off March's low, the 75% retracement level of the 2022 decline on the weekly chart crossing at 4505.40 is the next upside target. First resistance is June's high crossing at 4498.00. Second resistance is the 75% retracement level of the 2022 decline on the weekly chart crossing at 4505.40. First support is the 20-day moving average crossing at 4429.02. Second support is the June 26th low crossing at 4368.50.
INTEREST RATES? http://quotes.ino.com/ex?changes/?c=interest ""
September T-bonds closed up 8/32's at 124-00.
September T-bonds closed higher on Monday as it consolidates some of the decline off April's high. The high-range close sets the stage for a steady to higher opening when Tuesday's day session begins trading. Stochastics and the RSI are oversold but remain neutral to bearish signaling that sideways to lower prices are possible near-term. If September extends the decline off April's high, the March 22nd low on the weekly continuation chart crossing at 122-22 is the next downside target. Closes above the 20-day moving average crossing at 126-23 would confirm that a short-term low has been posted while opening the door for additional gains near-term. First resistance is the 20-day moving average crossing at 126-23. Second resistance is the 50-day moving average crossing at 128-04. First support is today's low crossing at 122-30. Second support is the March 22nd low on the weekly continuation chart crossing at 122-22.
September T-notes closed up 150-pts. at 111.045.
September T-notes closed higher on Monday. The high-range close sets the stage for a steady to higher opening when Tuesday's day session begins trading. Stochastics and the RSI are oversold but are turning neutral to bullish signaling that sideways to higher prices are possible near-term. Closes above the 20-day moving average crossing at 112.171 would signal that a short-term low has been posted. If September extends the decline off May's high, the October 21st low on the weekly continuation chart crossing at 108.265 is the next downside target. First resistance is the 20-day moving average crossing at 112.171. Second resistance is the June 13th high crossing at 114.000. First support is last-Thursday's low crossing at 110.050. Second support is the October 21st low on the weekly continuation chart crossing at 108.265.
ENERGY MARKETS? http://quotes.ino.com/ex?changes/?c=energy ""
August crude oil closed lower on Monday as it consolidates some of the rally off the June 28th low crossing at $67.05. The low-range close sets the stage for a steady to lower opening when Tuesday's day session begins. Stochastics and the RSI are overbought but remain neutral to bullish signaling that sideways to higher prices are possible near-term. If August extends the aforementioned rally, June's high crossing at $75.70 is the next upside target. Closes below the 20-day moving average crossing at $70.41 would signal that a short-term top has been posted. First resistance is today's high crossing at $74.15. Second resistance is the June 5st high crossing at $75.70. First support is the 20-day moving average crossing at $70.41. Second support is the June 12thlow crossing at $66.96.
August heating oil closed slightly lower on Monday as it consolidates some of the rally off May's low. The mid-range close sets the stage for a steady to slightly lower opening when Tuesday's day trading session begins. Stochastics and the RSI are overbought but are neutral to bullish signaling that sideways to higher prices are possible near-term. If August extends the rally off May's low, the 38% retracement level of the 2022-2023 decline crossing at 2.6107 is the next upside target. Closes below the 50-day moving average crossing at 2.3798 would confirm that a short-term top has been posted. First resistance is today's high crossing at 2.5830. Second resistance is the 38% retracement level of the 2022-2023 decline crossing at 2.6107. First support is the 20-day moving average crossing at 2.4275. Second support the 50-day moving average crossing at 2.3799.
August unleaded gas closed lower on Monday as it consolidates some of last-Friday's rally. The mid-range close sets the stage for a steady to lower opening when Tuesday's day session begins trading. Stochastics and the RSI are overbought but remain neutral to bullish signaling that sideways to higher prices are possible near-term. If August extends the rally off the June 23rd low, the 87% retracement level of the April-May decline crossing at 2.6394 is the next upside target. Closes below the 20-day moving average crossing at 2.5006 would confirm that a short-term top has been posted. First resistance is the 87% retracement level of the April-May decline crossing at 2.6394. Second resistance is April's high crossing at 2.7047. First support is the 20-day moving average crossing at 2.5006. Second support is the 50-day moving average crossing at 2.4508.
August Henry natural gas closed higher on Monday as it consolidates some of the decline off June's high. The high-range close sets the stage for a steady to higher opening when Tuesday's day session begins trading. Stochastics and the RSI are neutral to bearish signaling that sideways to lower prices are possible near-term. Closes below the 50-day moving average crossing at 2.556 would open the door for a possible test of June's low crossing at 2.244. If August resumes this month's rally, the 25% retracement level of the 2022-2023 decline crossing at 3.193 is the next upside target. First resistance is the June high crossing at 2.936. Second resistance is the 25% retracement level of the 2022-2023 decline crossing at 3.193. First support is the 50-day moving average crossing at 2.556. Second support is the June 1st low crossing at 2.244.
CURRENCIES? http://quotes.ino.com/ex?changes/?c=currencies ""
The September Dollar closed lower for the third day in a row on Monday. The low-range close sets the stage for a steady to lower opening when Tuesday's session begins trading. Stochastics and the RSI are neutral to bearish signaling that sideways to lower prices are possible near-term. If September extends the decline off last-Thursday's high, June's low crossing at 101.485 is the next downside target. Closes above the 10-day moving average crossing at 102.507 would signal that a short-term low has been posted. First resistance is the 10-day moving average crossing at 102.507.Second resistance is last-Thursday's high crossing at 103.275. First support is June's low crossing at 101.485. Second support is May's low crossing at 100.340.
The September Euro closed higher for the third day in a row on Monday. The high-range close sets the stage for a steady to higher opening when Tuesday's day session begins trading. Stochastics and the RSI have turned neutral to bullish signaling that sideways to higher prices are possible near-term. If September extends the rally off last-Thursday's low, June's high crossing at 1.10615 is the next upside target. Closes below last-Thursday's low crossing at $1.08715 would signal that a short-term top has been posted. First resistance is the June 22nd high crossing at $1.10615. Second resistance is May's high crossing at 1.11710. First support is last-Thursday's low crossing at 1.08715. Second support is May's low crossing at $1.07025.
The September British Pound closed slightly higher on Monday. The high-range close sets the stage for a steady to higher opening when Tuesday's day session begins trading. Stochastics and the RSI are neutral to bullish signaling sideways to higher prices are possible near-term. If September renews the rally off May's low, the 75% retracement level of the 2022-2023 decline crossing at 1.3253 is the next upside target. Closes below the 50-day moving average crossing at 1.2593 would open the door for additional weakness near-term. First resistance is the June 22nd high crossing at 1.2874. Second resistance is the 75% retracement level of the 2022-2023 decline crossing at 1.3253. First support is the 50-day moving average crossing at 1.2593. Second support is June's low crossing at 1.2390.
The September Swiss Franc closed higher on Monday as it renewed the rally off May's low The high-range close sets the stage for a steady to higher opening when Tuesday's day session begins trading. Stochastics and the RSI are neutral to bullish signaling that sideways to higher prices are possible near-term. If September extends the rally off May's low, May's high crossing at 1.14920 is the next upside target. Closes below the 20-day moving average crossing at 1.12525 would signal that a short-term top has been posted. First resistance is today's high crossing at 1.13780. Second resistance is May's high crossing at 1.14920. First support is the June 30th low crossing at 1.11790. Second support is June's low crossing at 1.10920. Third support is May's low crossing at 1.10700.
The September Canadian Dollar posted an inside day on Monday. The high-range close sets the stage for a steady to higher opening when Tuesday's day session begins trading. Stochastics and the RSI are turning neutral to bullish signaling that sideways to higher prices are possible near-term. Closes above the 20-day moving average crossing at 75.58 would signal that a short-term low has been posted. Closes below the 50-day moving average crossing at 74.80 would open the door for additional weakness near-term. First resistance is the 38% retracement level of the 2021-2022 decline crossing at 76.28. Second resistance is the September 12th high crossing at 77.11. First support is the 50-day moving average crossing at 74.80. Second support is last-Friday's low crossing at 74.78.
The September Japanese Yen closed higher for the third day in a row on Monday. The high-range close sets the stage for a steady to higher opening when Tuesday’s day session begins trading. Stochastics and the RSI are bullish signaling that sideways to higher prices are possible near-term. Today's close above the 20-day moving average crossing at 0.071137 signals that a short-term low has been posted. If September resumes the decline off March's high, the October-2022 low crossing at 0.069270 is the next downside target. First resistance is the 20-day moving average crossing at 0.071137. Second resistance is the 50-day moving average crossing at 0.072942. First support is June's low crossing at 0.069755. Second support is the October-2022 low crossing at 0.069270.
PRECIOUS METALS? http://quotes.ino.com/ex?changes/?c=metals ""
August gold closed slightly lower on Monday. The high-range close sets the stage for a steady to higher opening when Tuesday's day session begins trading. Stochastics and the RSI are neutral to bullish signaling that sideways to higher prices are possible near-term. Closes above the 20-day moving average crossing at $1941.30 would signal that a short-term low has been posted. If August resumes the decline off May's high, the 50% retracement level of the 2022-2023 rally crossing at $1892.30. First resistance is the 20-day moving average crossing at $1941.30. Second resistance is the 50-day moving average crossing at $1981.80. First support is June's low crossing at $1911.40. Second support is the 50% retracement level of the 2022-2023 rally crossing at $1892.30.
September silver closed higher on Monday. The high-range close sets the stage for a steady to higher opening when Tuesday's day session begins trading. Stochastics and the RSI are turning neutral to bullish signaling that sideways to higher prices are possible near-term. Closes above the 20-day moving average crossing at 23.428 would signal that a low has been posted. If July renews the decline off May's high, the 75% retracement level of the March-May rally crossing at 21.708 is the next downside target. First resistance is the 20-day moving average crossing at 23.428. Second resistance is the 50-day moving average crossing at 24,132. First support is June's low crossing at 22.140. Second support is the 75% retracement level of the March-May rally crossing at 21.708.
September copper closed slightly higher on Monday. The high-range close sets the stage for a steady to higher opening when Tuesday's day session begins trading. Stochastics and the RSI are turning neutral to bullish signaling that sideways to higher prices are possible near-term. Closes above the 20-day moving average crossing at 3.8135 would signal that a short-term low has been posted. If September resumes the decline off June's high, June's low crossing at 3.6600 is the next downside target. First resistance is June's high crossing at 3.9640. Second resistance is May's high crossing at 4.0100. First support is June's low crossing at 3.6600. Second support is May's low crossing at 3.5650.
GRAINS? http://quotes.ino.com/ex?changes/?c=grains "
December Corn closed up $0.05-cents at $4.99 1/2.
December corn posted an inside day with a higher close on Monday. The mid-range close sets the stage for a steady to higher opening when Tuesday's night session begins trading. Stochastics and the RSI are oversold but remain bearish signaling that sideways to lower prices are possible near-term. If December extends the decline off June's high, the September 2022 low crossing at $4.62 1/2 is the next downside target. Closes above the 50-day moving average crossing at $5.32 3/4 would signal that a short-term low has been posted. First resistance is the 10-day moving average crossing at $5.19 1/2. Second resistance is the 50-day moving average crossing at $5.32 3/4. First support is last-Wednesday's low crossing at $4.85 1/2. Second support is the September 2022 low crossing at $4.62 1/2.
September wheat closed down $0.03 1/4-cents at $6.46 1/4.
September wheat closed lower on Monday. The low-range close sets the stage for a steady to lower opening when Tuesday's day session begins trading. Stochastics and the RSI are oversold but remain neutral to bearish signaling that sideways to lower prices are possible near-term. If September extends the decline off June's high, the June 8th low crossing at $6.23 1/4 is the next downside target. Closes above the 20-day moving average crossing at $6.80 would signal that a short-term low has been posted. First resistance is the 20-day moving average crossing at $6.80. Second resistance is June's high crossing at $7.70 1/4. First support is last-Monday's low crossing at $6.38. Second support is the June 8th low crossing at $6.23 1/4.
September Kansas City Wheat closed down $0.07-cents at $8.11 1/4.
September Kansas City wheat closed lower on Monday. The low-range close sets the stage for a steady to lower opening when Tuesday's day session begins trading. Stochastics and the RSI have turned neutral to bearish signaling that sideways to lower prices are possible near-term. If September renews the decline off June's high, the June 14th low crossing at $7.76 3/4 is the next downside target. If September renews week's rally, June's high crossing at $8.89 1/2 is the next upside target. First resistance is last-Thursday's high crossing at $8.55 3/4. Second resistance is June's high crossing at $8.89 1/2. First support is the June 14th low crossing at $7.76 3/4. Second support is the May 31st low crossing at $7.61 3/4.
September Minneapolis wheat closed up $0.02 1/2-cents crossing at $8.50 1/4.
September Minneapolis wheat closed slightly higher on Monday. The low-range close sets the stage for a steady to slightly higher opening when Tuesday's day session begins trading. Stochastics and the RSI are neutral to bullish signaling that sideways to higher prices are possible near-term. If September extends last-week's rally, June's high crossing at $8.94 1/2 is the next upside target. Closes below the 50-day moving average crossing at $8.28 3/4 would temper the near-term friendly outlook. First resistance is last-Thursday's high crossing at $8.66 1/2. Second resistance is June's high crossing at $8.94 1/2. First support is the June 14th low crossing at $8.01 1/4. Second support is the June 7th low crossing at $7.92 3/4.
SOYBEAN COMPLEX? http://quotes.ino.com/ex?changes/?c=grains "
November soybeans closed up $0.27 3/4-cents at $13.45 1/2.
November soybeans closed higher on Monday and the high-range close sets the stage for a steady to higher opening when Tuesday's day session begins trading. Stochastics and the RSI are neutral to bearish signaling that sideways to lower prices are possible near-term. Closes below the 20-day moving average crossing at $13.07 3/4 would signal that a short-term top has been posted. If November renews the rally off the June 28th low, the 87% retracement level of the 2022-2023 decline crossing at $14.07 1/2 is the next upside target. First resistance is last-Monday's high crossing at $13.91 3/4. Second resistance is the 87% retracement level of the 2022-2023 decline crossing at $14.07 1/2. First support is the 10-day moving average crossing at $13.20. Second support is the 20-day moving average crossing at $13.04 3/4.
December soybean meal closed up $2.60 at $388.90.
December soybean meal closed slightly higher on Monday as it consolidated some of the decline off last-Monday's high. The mid-range close sets the stage for a steady to higher opening when Tuesday's day session begins trading. Stochastics and the RSI are neutral to bearish signaling that sideways to lower prices are possible near-term. If December extends the decline off June's high, the June 29th low crossing at $374.60 is the next downside target. Closes above last-Monday's high crossing at $415.20 are needed to renew the rally off June's low. First resistance is the 75% retracement level of the March-May decline crossing at $418.80. Second resistance is June's high crossing at $438.90. First support is the June 29th low crossing at $374.60. Second support is the June 8th low crossing at $362.40.
December soybean oil closed up 248-pts. at 60.81.
December soybean oil closed sharply higher on Monday.The high-range close sets the stage for a steady to higher opening when Tuesday's day session begins trading. Stochastics and the RSI are turning neutral to bullish signaling that sideways to higher prices are possible near-term. If December resumes the rally off May's low, January's high crossing at 61.68 is the next upside target. Closes below the 20-day moving average crossing at 56.41 would signal that a short-term top has been posted. First resistance is the 62% retracement level of the 2022-2023 decline crossing at 61.75. Second resistance is the 75% retracement level of the 2022-2023 decline crossing at 65.45. First support is the 20-day moving average crossing at 56.41. Second support is the 50-day moving average crossing at 51.97.
LIVESTOCKhttp://quotes.ino.com/exchanges/?c=livestock
August hogs closed down $0.85 at $94.30.
August hogs closed lower for the third day in a row on Monday as it consolidated some the rally off May's low. The low-range close sets the stage for a steady to lower opening when Tuesday's day session begins trading. Stochastics and the RSI are neutral to bearish signaling that sideways to lower prices are possible near-term. Closes below the 20-day moving average crossing at $91.53 would signal that a short-term top has been posted. If August renews the rally off May's low, the 87% retracement level of the 2022-2023 decline crossing at $104.40 is the next upside target. First resistance is the 75% retracement level of the 2022-2023 decline crossing at $100.14. Second resistance is the 87% retracement level of the 2022-2023 decline crossing at $104.40. First support is the 20-day moving average crossing at $91.53. Second support is the 50-day moving average crossing at $87.52.
August cattle closed up $0.15 at $177.15.
August cattle closed higher on Monday and is poised to resume the rally off the June 21st low. The mid-range close sets the stage for a steady to higher opening on Tuesday. Stochastics and the RSI are overbought but remain neutral to bullish signaling that sideways to higher prices are possible near-term. If August extends today's rally, June's high crossing at $178.10 is the next upside target. Closes below the 20-day moving average crossing at $173.16 would temper the near-term friendly outlook. First resistance is June's high crossing at $178.10. Second resistance is unknown. First support is the 20-day moving average crossing at $173.16. Second support is the June 21st low crossing at $168.10.
August Feeder cattle closed up $0.80 at $246.23.
August Feeder cattle closed higher on Monday. The high-range close sets the stage for a steady to higher opening when Tuesday's day session begins trading. Stochastics and the RSI are overbought but remain neutral to bullish signaling that sideways to higher prices are possible near-term. If August extends the rally off June's low into uncharted territory, upside targets will be hard to project. Closes below the 20-day moving average crossing at $238.84 would signal that a short-term top has been posted. First resistance is last-Wednesday's high crossing at $248.85. Second resistance is unknown. First support is the 20-day moving average crossing at $238.84. Second support is the June 27th gap crossing at $235.25.
FOOD & FIBERhttp://quotes.ino.com/ex changes/?c=food
September coffee posted an inside day with a slightly lower close on Monday. The low-range close sets the stage for a steady to lower opening on Tuesday. Stochastics and the RSI are oversold but remain neutral to bearish signaling sideways to lower prices are possible near-term. If September extends the decline off June's high, the 87% retracement level of the January-April rally crossing at $15.20 is the next downside target. Closes above the 20-day moving average crossing at $16.95 would signal that a short-term low has been posted. First resistance is the 10-day moving average crossing at $16.15. Second resistance is the 20-day moving average crossing at $16.95. First support is the 75% retracement level of the January-April rally crossing at $15.88. Second support is the 87% retracement level of the January-April rally crossing at $15.20.
September cocoa closed slightly higher on Monday. The mid-range close sets the stage for a steady to higher opening on Tuesday. Stochastics and the RSI are neutral to bearish signaling that sideways to lower prices are possible near-term. Closes below the 20-day moving average crossing at 32.62 would signal that a short-term top has been posted. If September extends the rally off March's low, monthly resistance crossing at 34.29 is the next upside target.
October sugar closed slightly lower on Monday. The high-range close sets the stage for a steady to slightly lower opening on Tuesday. Stochastics and the RSI are neutral to bullish signaling that sideways to higher prices are possible near-term. Closes above the 20-day moving average crossing at 24.22 would signal that a short-term low has been posted. If October renews the decline off June's high, the 50% retracement level of the October-April rally crossing at 21.34 is the next downside target.
December cotton closed sharply lower on Monday. The low-range close sets the stage for a steady to lower opening on Tuesday. Stochastics and the RSI are turning neutral to bearish signaling sideways to lower prices are possible near-term. If December renews this year's decline, the November 28th -2022 low crossing at 74.25 is the next downside target. If December extends the rally off June's low, June's high crossing at 82.49 is the next upside target.
Wow, tallpine was right here to give us his wonderful market reports right after we came back online! Thanks, man
Crop report and conditions this week:
https://www.marketforum.com/forum/topic/97032/
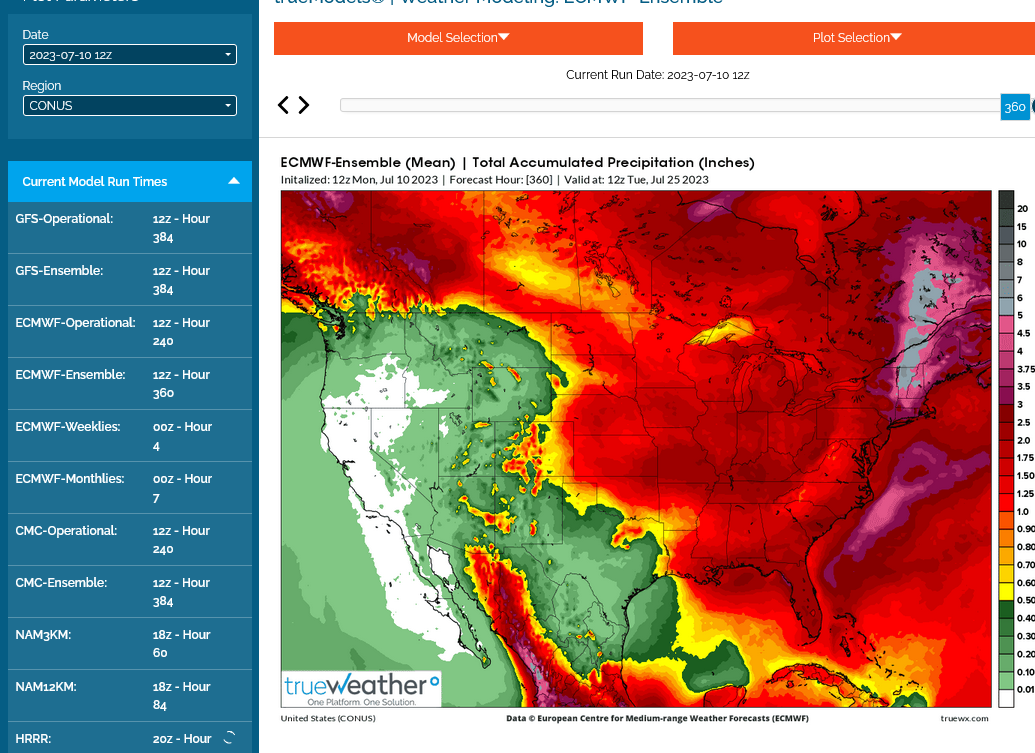
European model 12z: Close to 2 inches most places.......Upper Midwest/N.Plains drier.
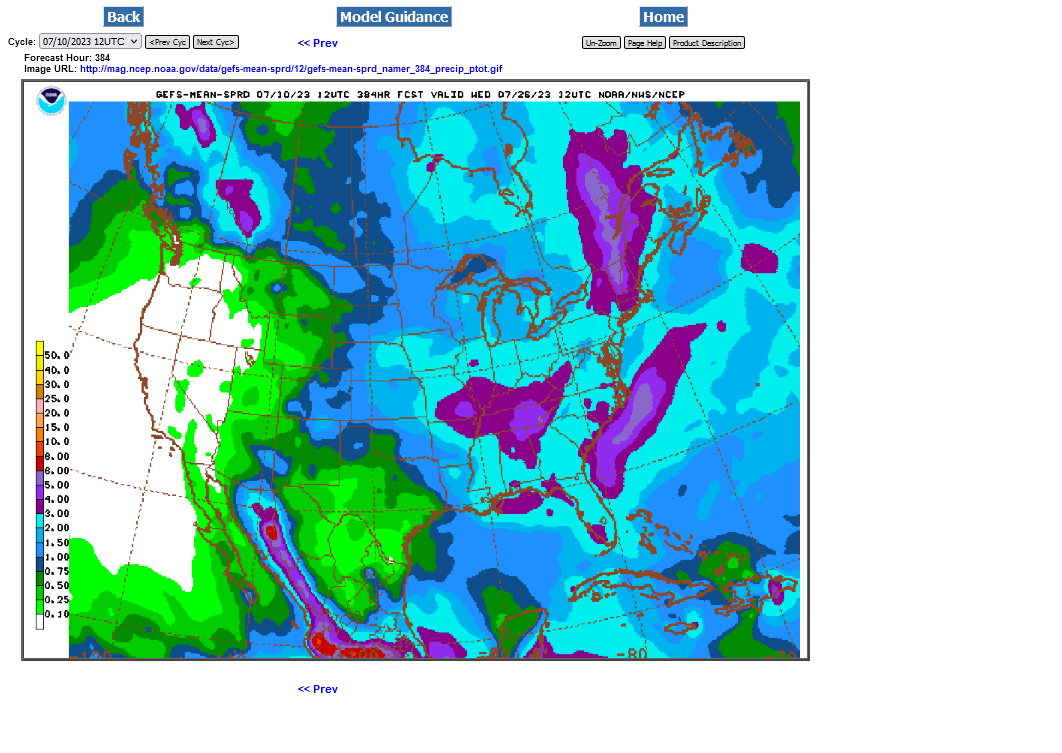
GEFS 12z was wetter......as usual