Time for a new thread!
Hey Mike,
I had seen what you said in the old NG thread about the AO especially crashing at the end of two weeks on today's GEFS based NCEP progs and slightly more quickly than yesterday's showed. I believe that this is in response to a **major** SSW coming next week, which should be centered on 2/15-6. Unlike the late January SSW, this one will be in the "major " category. That requires a reversal of the mean winds at 60N latitude at the 10 mb level in the atmosphere (mid stratosphere) to change from westerly (typical winter direction surrounding the stratospheric polar vortex (SPV)) to easterly as the SPV is displaced.
Even though it is going to be a major, that's still no guarantee that it will propagate downward into the troposphere and make it cold in the E US. So far, the jury is out only because it is still way too early for the models to bodily pick up on it due to lack of skill in the troposphere compared to the stratosphere. A warm E US is actually pretty common during and for much of the two week period following a SSW. It is only AFTER this period (very end of Feb (at earliest) through March in this case) when any change to a cold pattern typically takes hold in the E US, if it is ever going to do so.
The long range signs remain promising for the start of a multi-week long significant -AO/-NAO (as per yesterday's Euro weeklies) around the last days of Feb and then dominating March. Also, the greater than 40 mb Scandinavian-Greenland dipole early this week is (based on Simon Lee's studies) usually an indicator that any SSW will propagate to the troposphere within a few weeks of it. Finally, MJO forecasts in combination with this remain favorable to end the SE ridge domination by early March fwiw.
If I were still trading NG and considering the humongous recent plunge, current very mild 2 week forecasts, and seasonals per Mike suggesting a bottom often occurs around now, I'd have been very tempted to buy some OOM calls (if not too highly priced) this week with them not expiring til ~2/23. All the market sees now is warm, warm, warm. If there's a cold March (and possibly end of Feb) around the corner, that can't possibly be priced into the market. If this major SSW were to propagate to the troposphere, which I think odds favor right now, it is likely March will overall be a cold month for much of the E US.
Buckle up!
what is a ssw?
Thanks in advance
Cutworm,
An SSW is a sudden stratospheric warming. That refers to a sharp warming in the stratosphere over the Arctic. That is often on the order of warming 30-50+ C (54-90+ F) within a week's time. This occurs in concert with the stratospheric polar vortex weakening and moving away from the North Pole.
Thanks for starting the new thread Larry and the wonderful contribution.
Here's the link to the previous thread:
https://www.marketforum.com/forum/topic/92520/
cutworm,
Here's more on the SSW from somebody that's very descriptive.
A decade ago, nobody ever heard of this term. Now, this week there's dozens of stories and warning's of the extreme cold coming from what could end up being another bust.
We live in the age of sensationalizing, especially with weather.
By Author Andrej Flis
Larry did some great research for us on SSW's 3 weeks ago related to an event that was mostly a bust but the research is still good for this next potential SSW, that could again be a bust:
https://www.marketforum.com/forum/topic/92327/#92333
There's also some other great information on SSW's at that link if you scroll down, rather than copy it here.
Thanks, WX and Mike. Somehow, I missed that.
cutworm,
YW!
Being busy with chess stuff and all the other news, I totally missed it too! So don't feel bad. When Larry tipped us off and I did a search, there were tons of articles, some several days old.
We live in a different age. You can get seemingly unlimited information on many things but the trick sometimes is to know if what your getting is authentic, which is almost impossible in political realms and in science if its climate because that's mostly dominated by politics.
One way to apply the trick of authentic discernment is if you already have expertise or solid, reliable knowledge in a field, especially science and compare what's being stated to what you know the truth it. If they don't match up, the source might not be reliable and its time to be skeptical of other things.
Sorry for the political twist to the NON political thread but on SSW's there are some that believe they are caused by the warming of the planet by 1 deg. C ( +3-4 Deg in the Arctic and more than that in the Winter).......almost all of those also are convinced that we have a climate crisis, so there's a powerful bias to interpret the information based on the underlying assumptions about whether climate change is good or bad........and how bad.
So when you read a excellent piece/article like the one below, loaded with good science, the average person would not know it but I'll show you an article about the source/meteorologist first. So the source is really smart and is using solid science based on meteorological principles but he's making assumptions that are based on things that we don't know because we don't have enough data from SSW's going back before the satellite age(which is the age of global warming) to really know. He always gives the most weight to explanations in a field with unknowns that line up with what he wants to believe.
https://yaleclimateconnections.org/2019/11/a-meteorologist-bets-his-career-on-climate-change/
By Jeff Berardelli
/ CBS News
https://www.cbsnews.com/news/climate-change-texas-winter-storms-arctic-cold/
·
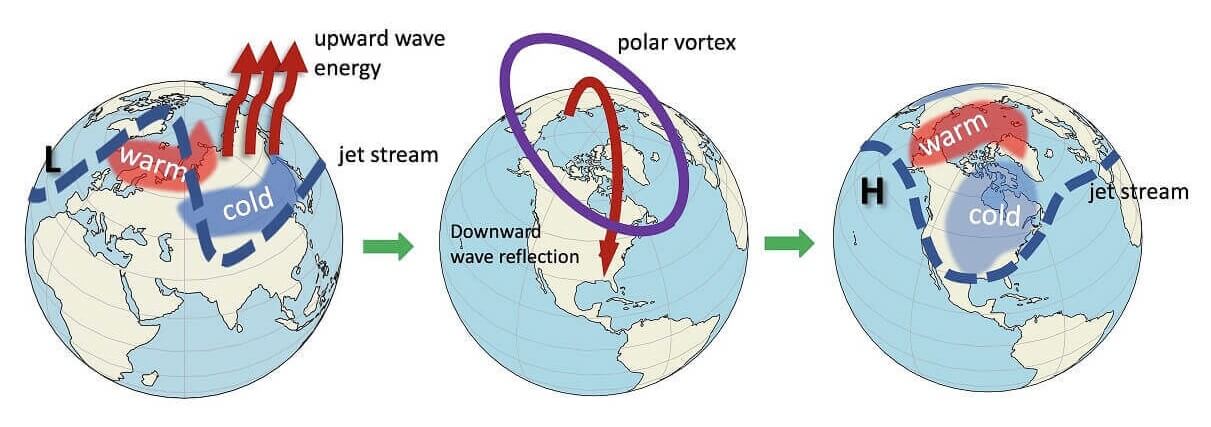
Meteorologists saw the extreme pattern coming weeks ahead. How? A Sudden Stratospheric Warming miles above the North Pole (a natural event) with a warmed Arctic due to climate change piggy backing on that pattern = unstable PV & wavy extreme jet stream, with extreme cold & warm.
metmike: In that same great article, below to his credit, we are provided with some excellent data that shows, overall how much warmer our January's and cold waves have been from global warming/climate change.
But biased meteorologists and especially journalists will often NOT give both sides, like this in the same article.
+++++++++++++++++++++
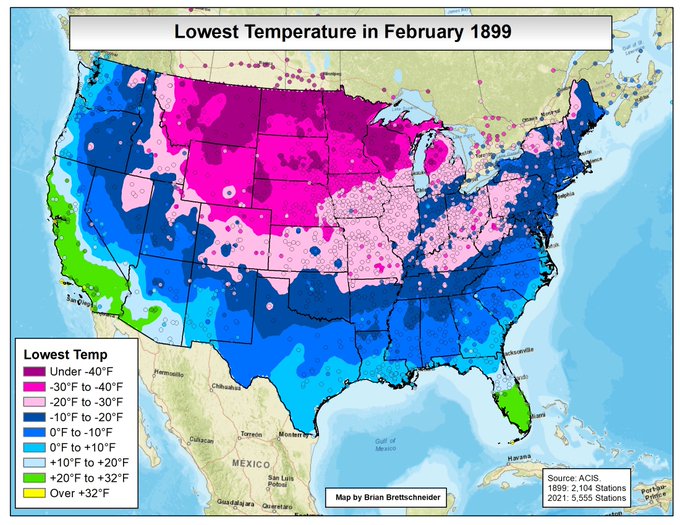
 Brian Brettschneider@Climatologist49
So which cold wave was more extreme? February 1899 or February 2021. The answer is ...... not even close. February 1899 was much colder nearly everywhere.
Brian Brettschneider@Climatologist49·
60-year trend in January temperatures using NCEI county-level data. #ThisIsFine
January 15, 2014
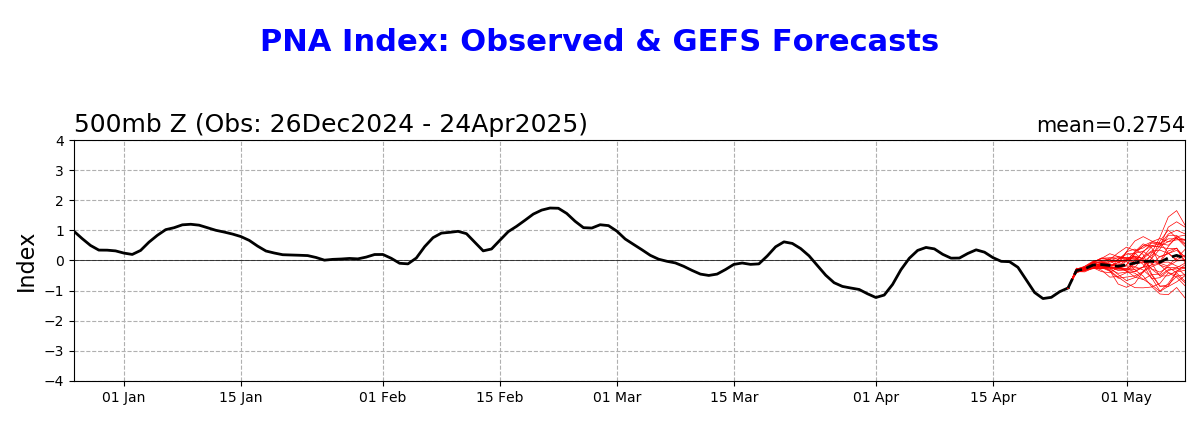
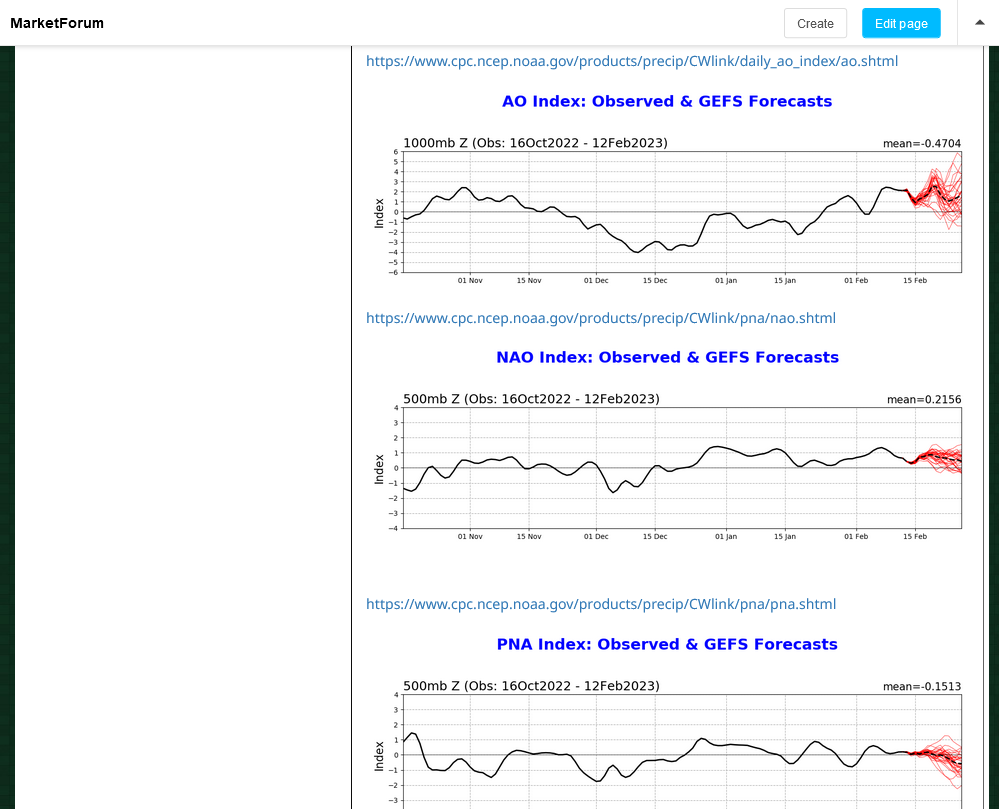
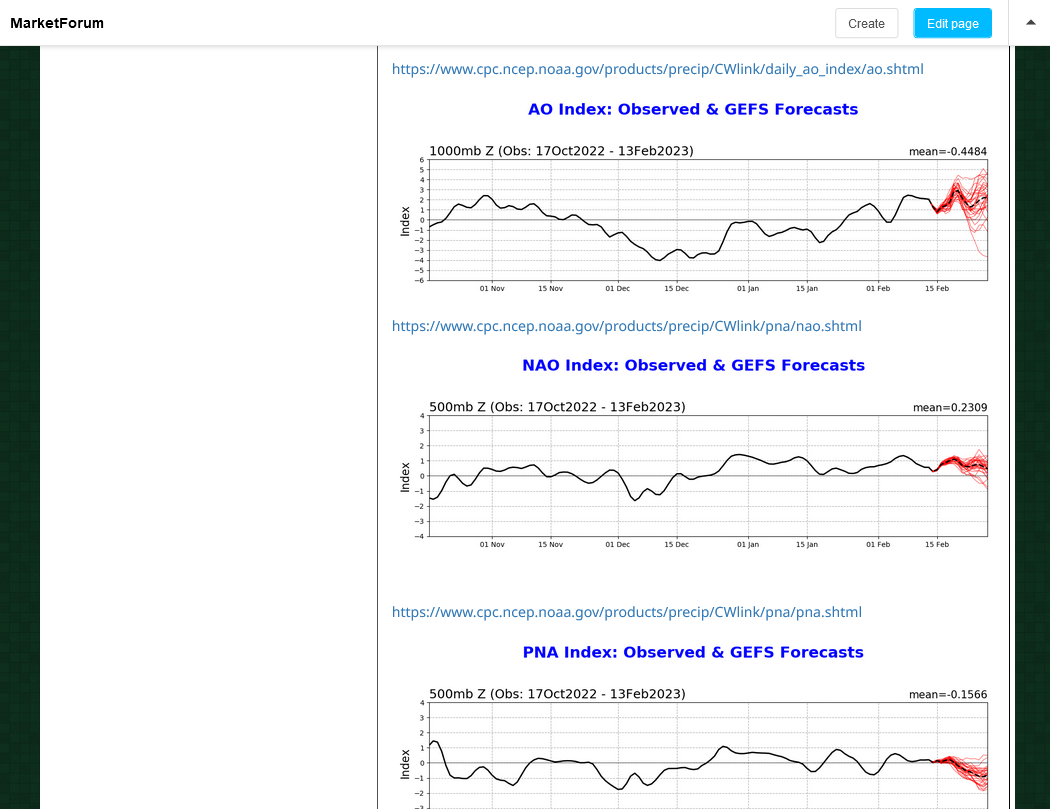
Here's the latest on our key indices with my interpretation:
AO=Extreme wide spread at the end of the period between individual members (-3 to +4. Great uncertainty
NAO= Wide spread too(the historical range of the NAO is around 50% less than the AO, so +1.5 to -1 is pretty wide) with the +NAO camp still greatly outnumbering -NAO members. The minority negative solutions greatly increase cold for, especially the Northeast.
PNA= More agreement that the others of -PNA with some solidly -PNA members. A couple of outliers with 0/+PNA. -PNA usually impedes the penetration of cold into, especially the Southeast 1/3rd of the country with the usual forcing being a potential southerly wind flow downstream of the -PNA regime based on teleconnections.
Arctic Oscillation Index, North Atlantic Oscillation Index, Pacific North American Index.
https://www.cpc.ncep.noaa.gov/products/precip/CWlink/daily_ao_index/ao.shtml
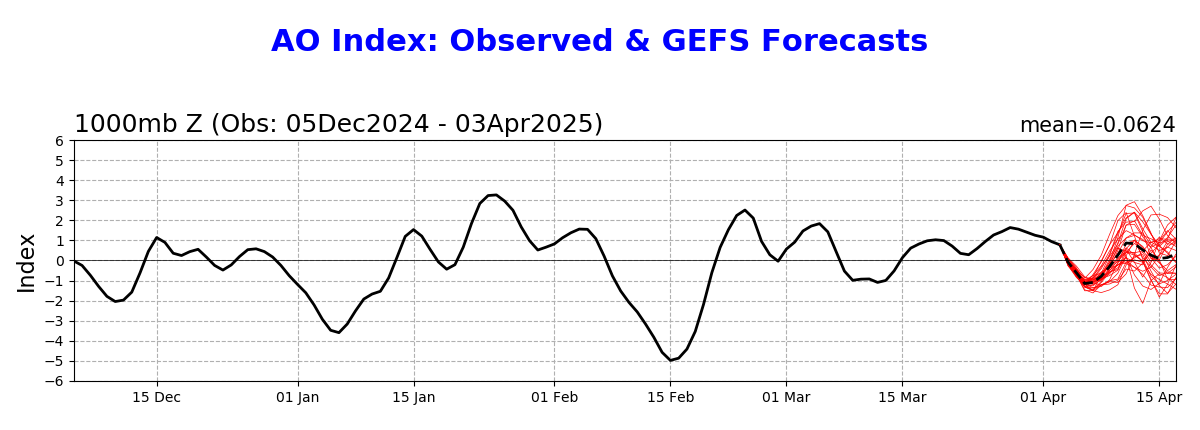
https://www.cpc.ncep.noaa.gov/products/precip/CWlink/pna/nao.shtml
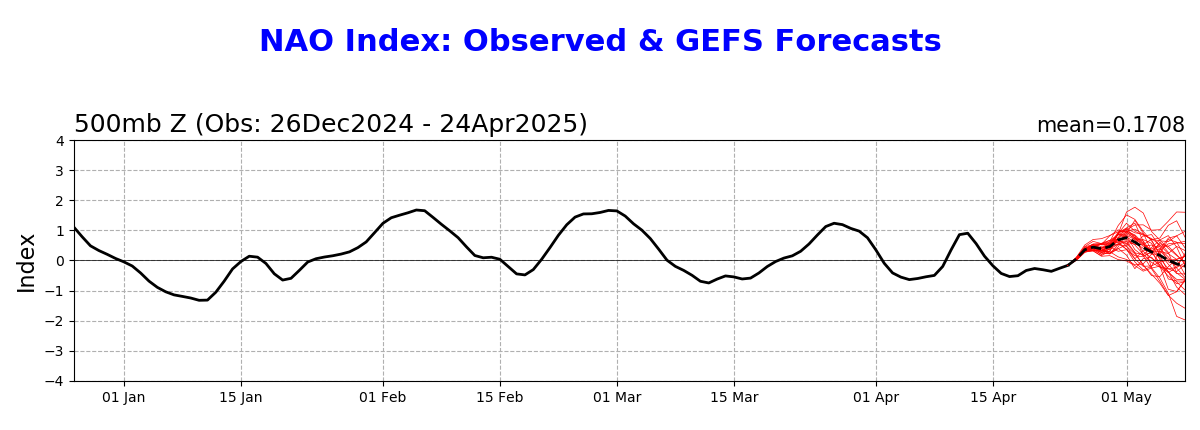
https://www.cpc.ncep.noaa.gov/products/precip/CWlink/pna/pna.shtml
MetMike, WX, others
I am 70.
I lived during weathers that were COLD! 0 to say -10. Snow, that 'never' melted. North Central Illinois
I have "interpreted" that the world has cycles! (not this expletive deleted climate change). High school was cold as h.. College not so much, law school even less much. Then my first born we had it like below ZERO for 21-30 days in a row! DOES NOT WEATHER EVOLVE, vary, have cycles???
In my mind, some as...politician invented c change.
Are we not in some 'warmer' cycle TO BE FOLLOWED by a colder, then colder yet cycle.
AND I DONT WANT TO HEAR WE OBAMA TO MANAGE THIS cycle (remove this last sentence if offensive)
tjc/Mike,
No disrespect intended, but I'm going to try to steer this thread away from CC/GW/politics as there's plenty of room for that in other threads and back toward "wx"/NG here.
The prior SSW (late Jan) was, indeed, a "fail" since it had a chance at finally leading to a cool down of the E US via a top down effect on the troposphere, which is why I first brought it up. Thus I had thought there was a good chance for the E US to cool off starting within the next few days (I had thought as early as Feb 10th, near the 2 week point). We now know this isn't going to happen. It turned out to be a "minor" SSW, which typically has less of a chance to do that. It wasn't minor because of the degree of warming, which was actually quite impressive Jan 23-8. It was because it didn't cause 60N 10 mb winds to switch from W to E. The models never favored the switch though it was rather close. The winds made it nearly 75% of the way from (+50 to +12 in m/s). They needed to get to below 0.
But now we have a different story. Ever since the 18Z Feb 1st run, the GFS model has shown a "major" SSW for mid Feb on every single run! This was well ahead of other models/ensemble means thus making it an early extreme outlier. But as of ~2/6, all models/ens means came on board. So, major kudos GFS!
So, a major SSW is now certain to become official on Feb 15th or 16th, when the 60N 10 mb winds switch to E from the normal W. They're targeted to get to -10 ~2/18, which means E winds at 10 m/s. The strongest 10 mb warming will occur 2/12-15, when above the N Pole it warms from -58 F tomorrow to +1 F just three days later!
So, now we'll have to see what happens to the E US starting ~~2 weeks after the SSW or, say, ~~March 1st. Even though it is going to be a major, it could also fail to lead to a colder pattern in the E US because they don't all do that. But in its favor is the Scandinavian-Greenland index, which I estimate hit 44 mb late on Feb 6th. Per Simon Lee's great research, it exceeding 40 mb increases the chance that this SSW will work its way down into the troposphere.
I'll be looking for a massive drop of the AO/NAO (thanks to Mike for posting about this) to start in advance of any potential colder E US change (as early as late Feb) as that would be the central mechanism a SSW uses to lead to colder. I also noticed the larger than normal spread, with 8 of the ~31 members projecting a solid -AO/-NAO starting prior to 2/25. But I'll also be looking for the MJO to get over to the left side of the diagram, which would make the Pacific more conducive than it is now for a cold E US.
Buckle up for possible atmospheric bedlam!
update: 2-13-23: I was not able to capture a snapshot, frozen image of the maps below last night. Instead the copied maps from the GEFS below are constantly updated every 24 hours and with the turning of the calendar page overnight my worded analysis applied to the PREVIOUS run. Tomorrow, that analysis from last night will be 48 hours old.
This is actually A good thing, most of the time, as long as we are aware Of the increasing dichotomy with time Between the aging analysis and the constantly updating maps. It’s good because it means the maps here are updated with the latest version.
The indices above, a couple of pages ago, for instance also had yesterdays analysis but were automatically updated today from the site and are now accompanied by graphs that start 1 day and end 1 day later, with fresher/later data by 24 hours.
However, in retrospect, I“ll have to consider trying a different way to permanently freeze frame images with analysis like this.
previous post below with verbiage describing the previous run and model initialization time of 2/11/23. The new maps were initialized on 2/12/23. Tomorrow will be 2/13/23. If you’re reading this tomorrow, then 2/13/23 is today. If you didn’t understand the products to begin with, then this doesn’t make a difference And apologies for getting so technical here even with an attempt for this to be an educational discussion.
++++++++++
Thanks, Larry!
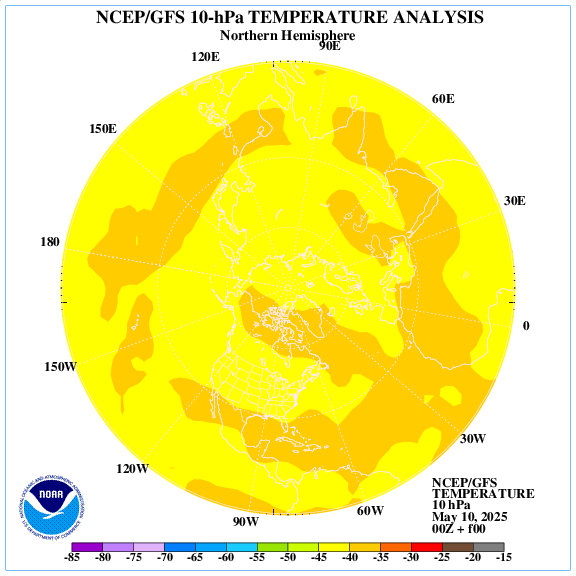
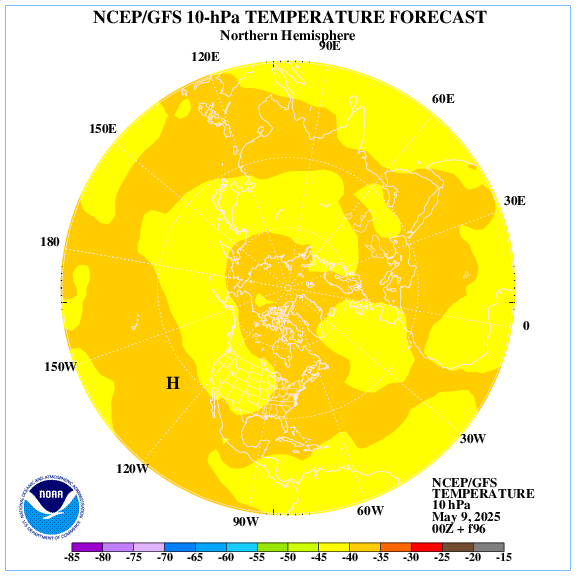
I see what you mean about the huge warming coming up. Maps below from 2-11 to 2-15, note the center of the North Pole vicinity isotherm on the 96 hour, map #2 is off the temperate chart/warmer than the warmest color(grey) band shown below the map.
https://www.cpc.ncep.noaa.gov/products/stratosphere/strat_a_f/
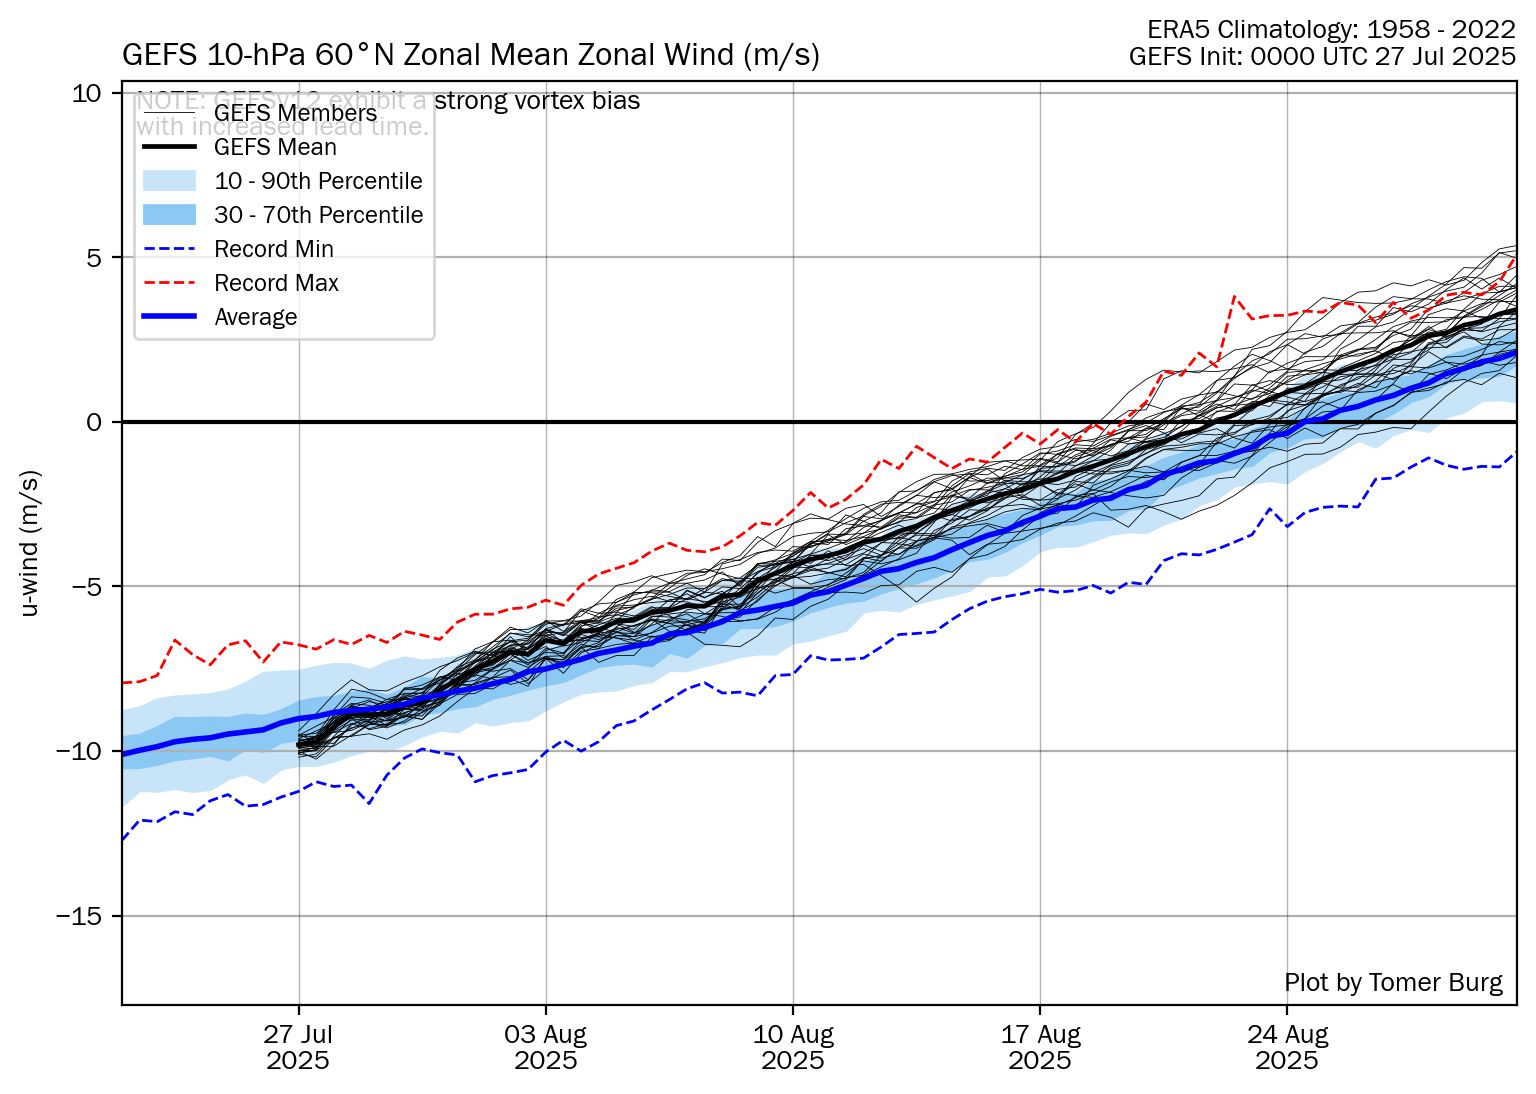
And wind flipping to easterly(some members have record min/easterly)
http://arctic.som.ou.edu/tburg/products/realtime/strat/
Here's the Euro........same thing(from Thursday)
https://charts.ecmwf.int/products/extended-zonal-mean-zonal-wind?area=nh&base_time=202302090000

Here's the blog site from the guy you sited and probably follow:
https://twitter.com/SimonLeeWx
This guy has some great stuff too:
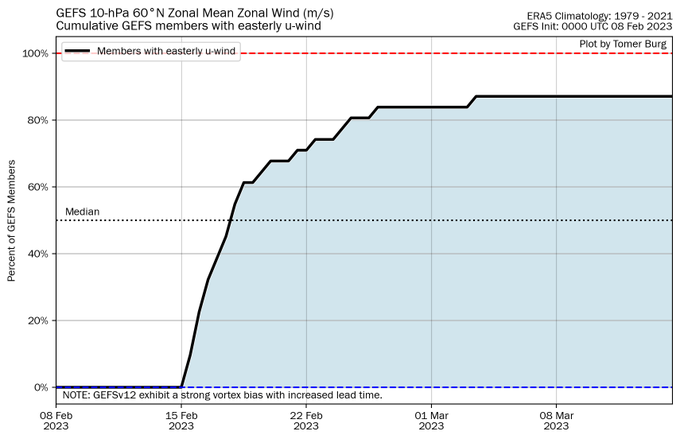
Added a new plot to my extended GEFS stratosphere page - cumulative easterly u-wind probability (thanks
for the suggestion)! As of the most recent extended GEFS cycle, 87% of GEFS members meet SSW criteria at some point over the entire run. http://arctic.som.ou.edu/tburg/products/realtime/strat/
AO, NAO, and PNA are less favorable for cold today In the US at the end of the period.
AO and NAO more positive today than yesterday, PNA still negative.
https://www.marketforum.com/forum/topic/93014/#93027
This is a FROZEN SNAPSHOT that will not update.
https://www.marketforum.com/forum/topic/93014/#93027
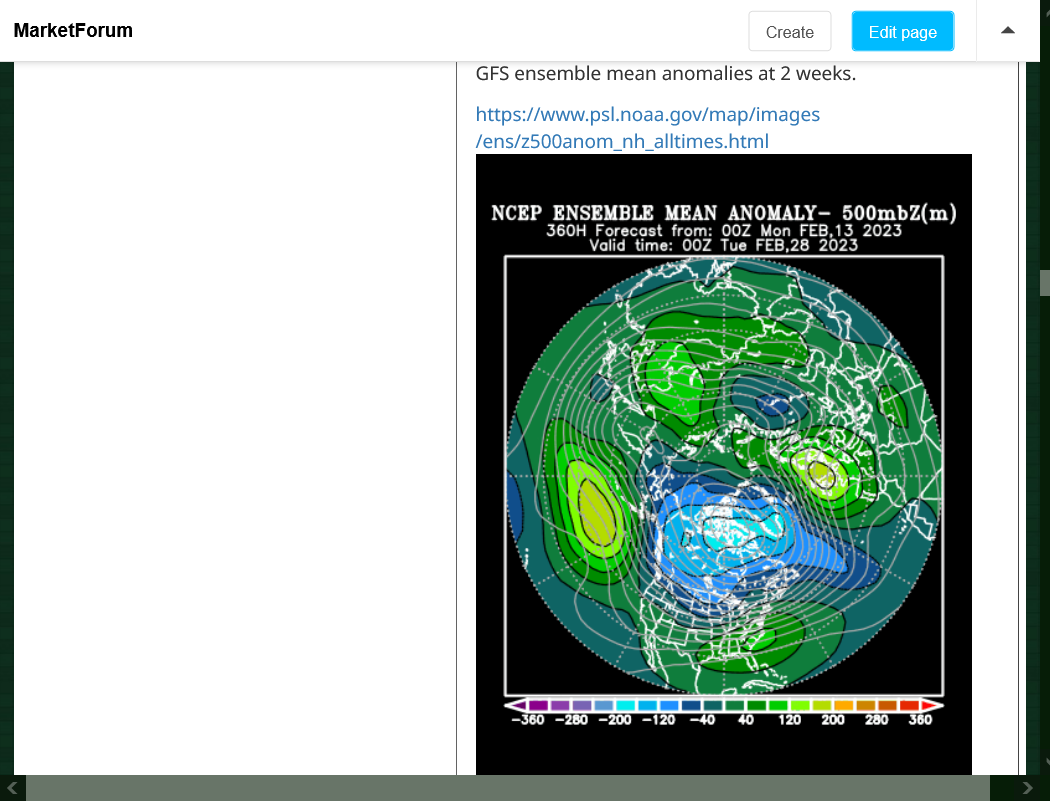
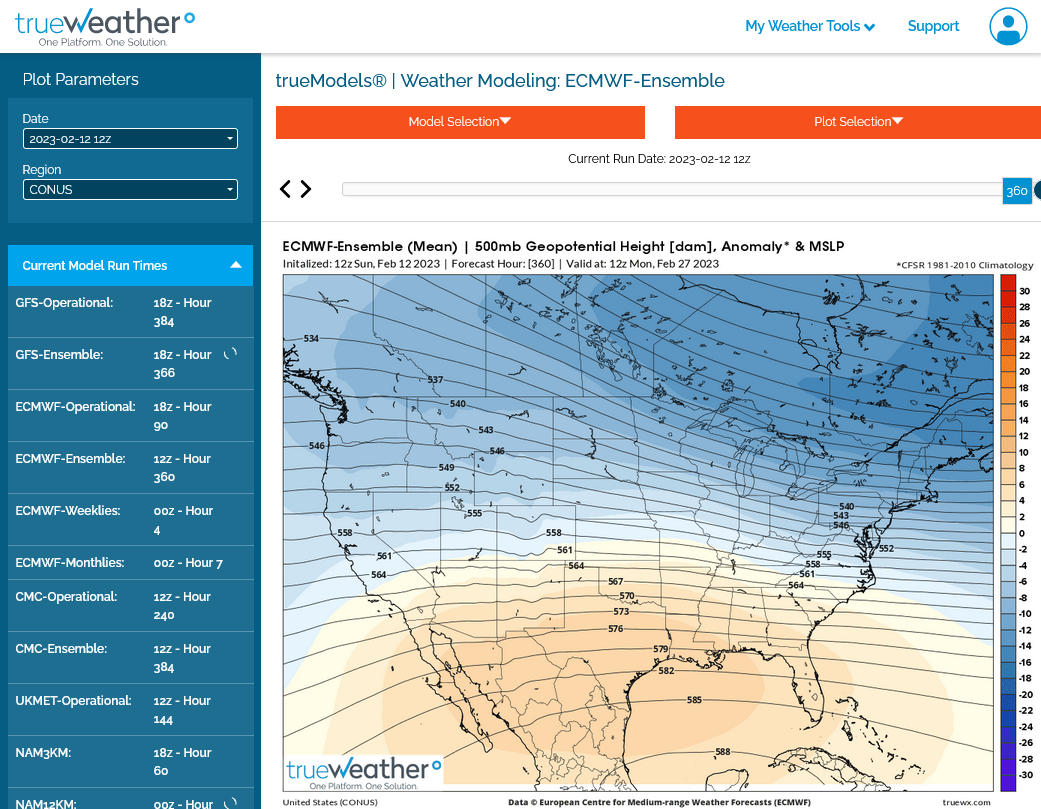
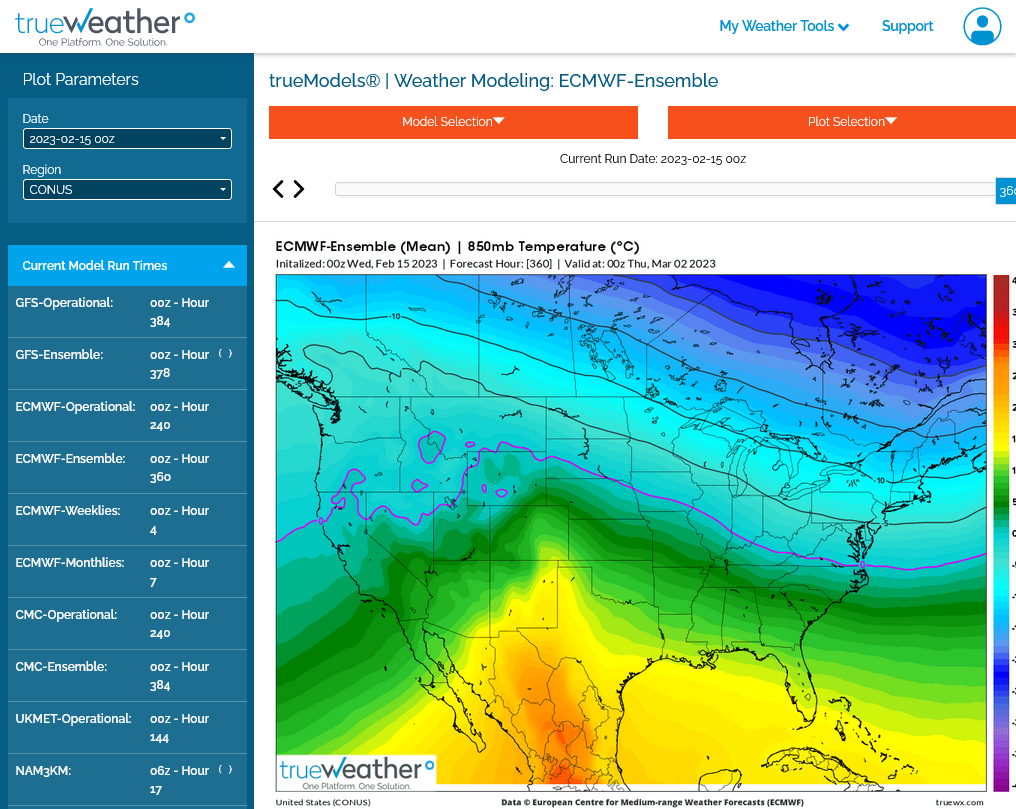
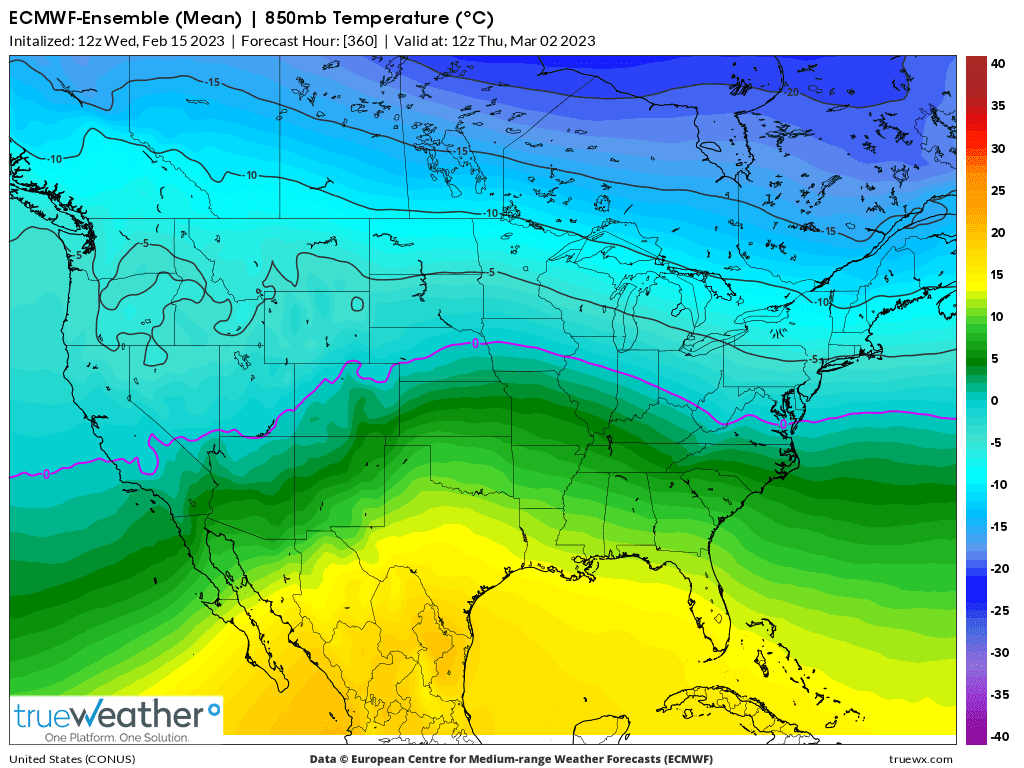
In tandem with the more positive AO/NAO today, there's less favorable conditions to transport cold from high latitudes to mid latitudes. Here's a frozen snap shot of the upper level 500 mb height chart, followed by the 850 temp chart at the end of 2 weeks below.
Most of the cold, which is very significant is locked up in ALL of Canada, with no mechanism to flush it deeply south, other than shallow intrusions into the northern US border states. In fact, the -PNA and the positive anomaly in the Southeast, strongly OPPOSE attempts of the cold to penetrate deeply towards the Southeast.
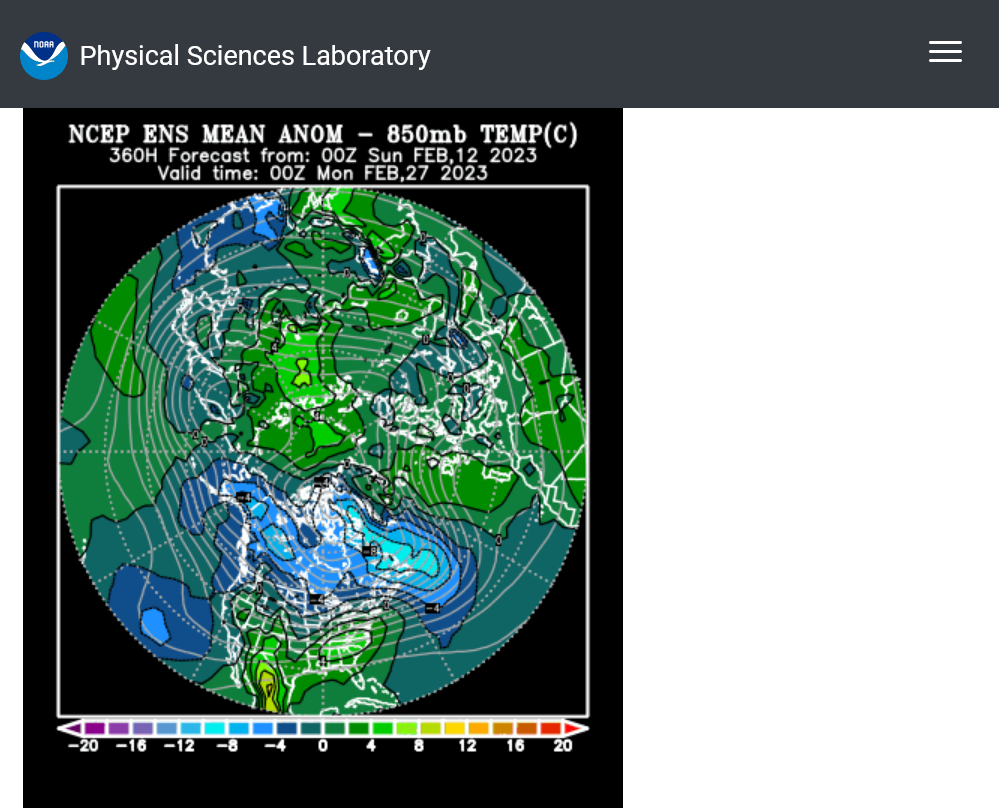
So the SSW dynamic puts in place the conditions to create some extreme cold below in the troposphere when the 2 levels couple/connect.
However, other more important forcing factors in the troposphere determine how that cold acts after it's created.
The other thing too.
The weather models are constantly being initialized with the latest data that goes into thousands of equations which mostly deal with physical laws in the troposphere. I doubt they are programmed to recognize the full extend of a SSW event(before it happens), which suddenly adds a connection to the stratosphere, an event that rarely happens and has no good math equations to represent it in a computer weather model.
Clearly, the model above is picking up on the cold though.
Also, there hasn't been enough of these events for modelers to have effectively updated models if there is an effective way to do that and I certainly have not studied them enough to be an authority.
With that being the case, we have great uncertainty and the models could suddenly catch on to the new dynamic created by the SSW that they didn't know about before.
For the 2nd day in a row, the key indicators/indices in the troposphere that count the most by far are NOT as favorable for cold delivery from high latitudes to lower latitudes.
+A0, +NAO and -PNA. This is the recipe for cold having a hard time pushing very deeply into the Eastern US, especially the Southeast. There are a couple of ISOLATED(outliers) that are -AO/-NAO.
Here's snapshot pictures:
As indicated yesterday, the cold stays locked up in Canada:
Are you still out there, WxFollower???
Yep! Wx is bearish too. But how much lower can we go down here???
Still no sign of major cold for the Eastern US(just the opposite).
12z GEFS was -5HDDs vs the 6z run, then the EE came out 2 hours later at +4 HDDs vs the 0z run and we had a small bounce after the regular close.
Like roses on Valentine’s Day, natural gas futures opened the week in the red as weather models trended warmer with the forecast for the next week or so. With production near recent highs and storage surpluses set to grow in the coming weeks, the March Nymex gas futures contract settled Monday at $2.405/MMBtu, off 10.9…
+++++++++++++++++++
Look at the unusually large drawdowns from last year that we will be comparing to the next 2 months.
https://www.marketforum.com/forum/topic/92520/#92588
| Release Date | Time | Actual | Forecast | Previous |
|---|
| Apr 28, 2022 | 09:30 | 40B | 38B | 53B | |
| Apr 21, 2022 | 09:30 | 53B | 37B | 15B | |
| Apr 14, 2022 | 09:30 | 15B | 15B | -33B | |
| Apr 07, 2022 | 09:30 | -33B | -26B | 26B | |
| Mar 31, 2022 | 09:30 | 26B | 21B | -51B | |
| Mar 24, 2022 | 09:30 | -51B | -56B | -79B | |
| Mar 17, 2022 | 09:30 | -79B | -73B | -124B | |
| Mar 10, 2022 | 10:30 | -124B | -117B | -139B | |
| Mar 03, 2022 | 10:30 | -139B | -138B | -129B | |
| Feb 24, 2022 | 10:30 | -129B | -134B | -190B | |
| Feb 17, 2022 | 10:30 | -190B | -193B | -222B | |
| Feb 10, 2022 | 10:30 | -222B | -222B | -268B | |
| Feb 03, 2022 | 10:30 | -268B | -216B | -219B | |
| Jan 27, 2022 | 10:30 | -219B | -216B | -206B | |
| Jan 20, 2022 | 10:30 | -206B | -194B | -179B | |
| Jan 13, 2022 | 10:30 | -179B | -173B | -31B | |
| Jan 06, 2022 | 10:30 | -31B | -54B | -136B |
++++++++++++++++++++++
These were temps last week for the upcoming EIA report on Thursday. Bearish, especially compared to the big one last year. So the surplus vs last year and the 5 year average will grow bigger.
+++++++++++++++++++++
https://www.marketforum.com/forum/topic/92520/#92970
Blue line is ABOVE the black line and will likely get farther above it the next 2 months.
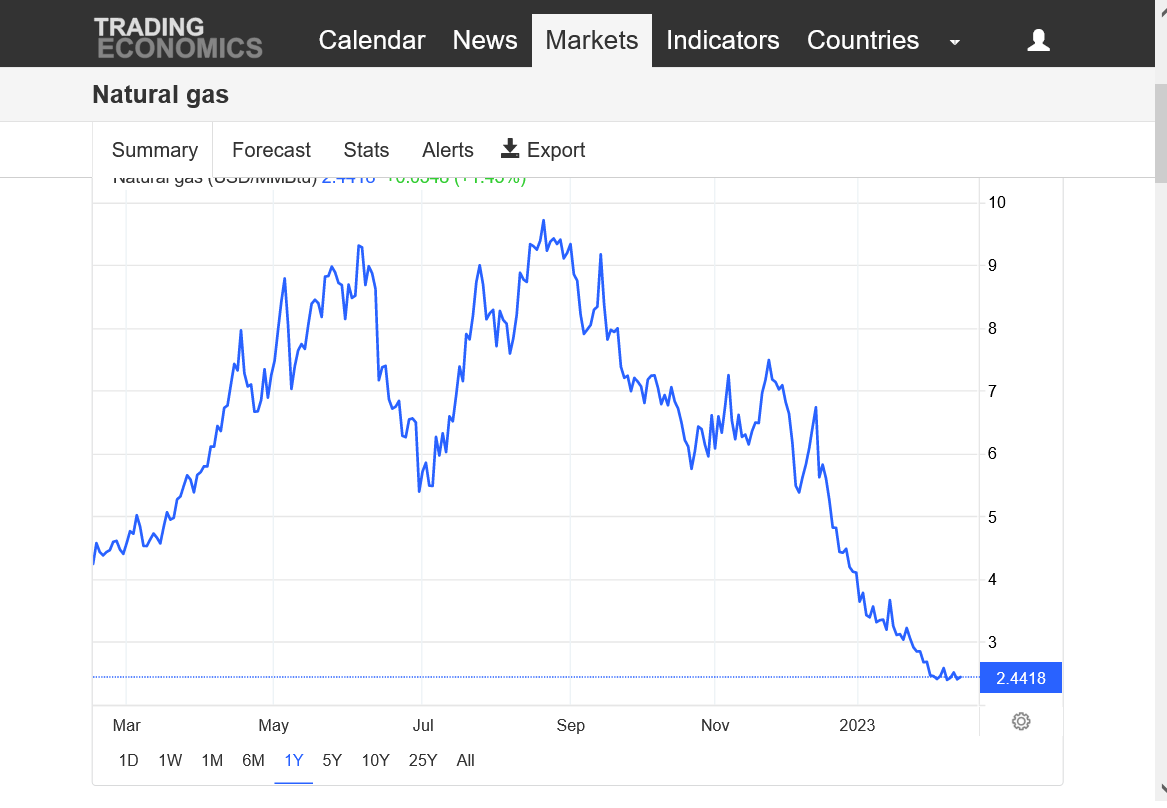
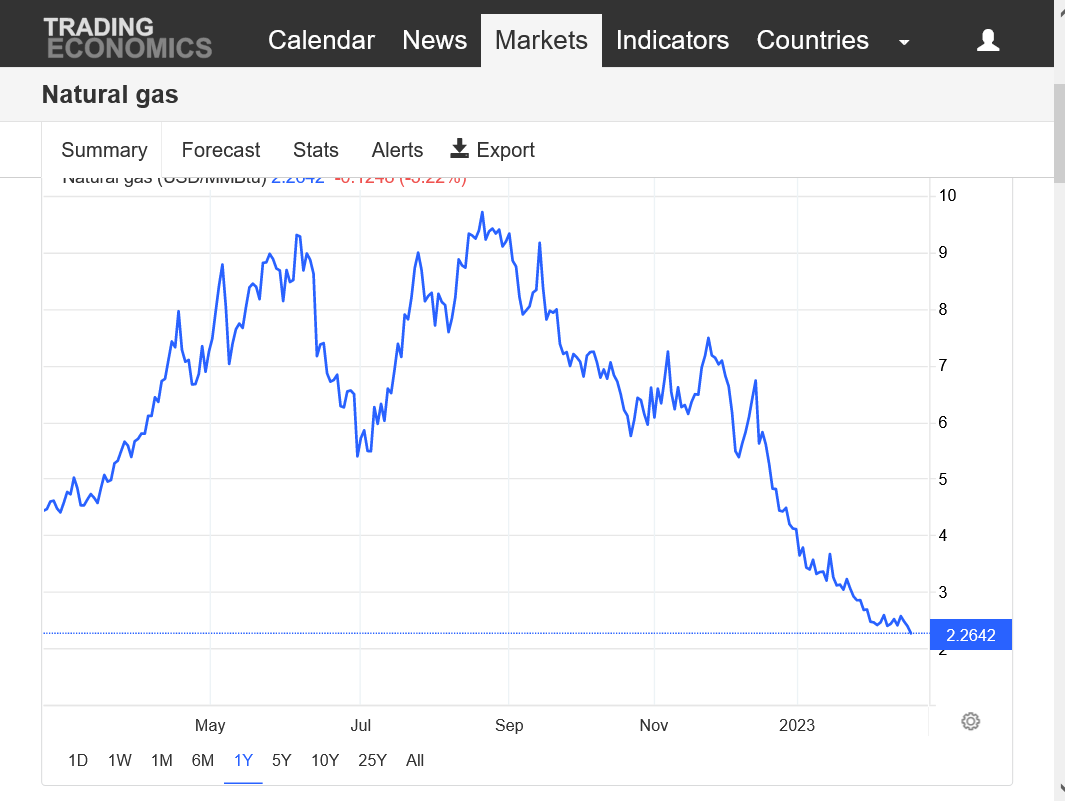
But the market knows this and that's why prices have dropped 75% since late last Summer when the NG supply gush started. The cure for low prices.........is low prices, just like the cure for last Summer's high prices......was high prices that drive financial incentive for producers.

+++++++++++++++
In 2020, COVID caused excessive inventory/storage and the lowest prices in 20 years. The rig count plunged. You can see how that resulted in the blue line above, being at a record high level at the far left...........eroding the huge surplus and the huge drawdowns a year ago caused that to turn into the biggest deficit in storage the last 5 years last year. So the rig count jumped higher as supplies also gushed out from previous already drilled wells and that's been the dynamic since last Summer........now we're back to a surplus again and corresponding very low prices.
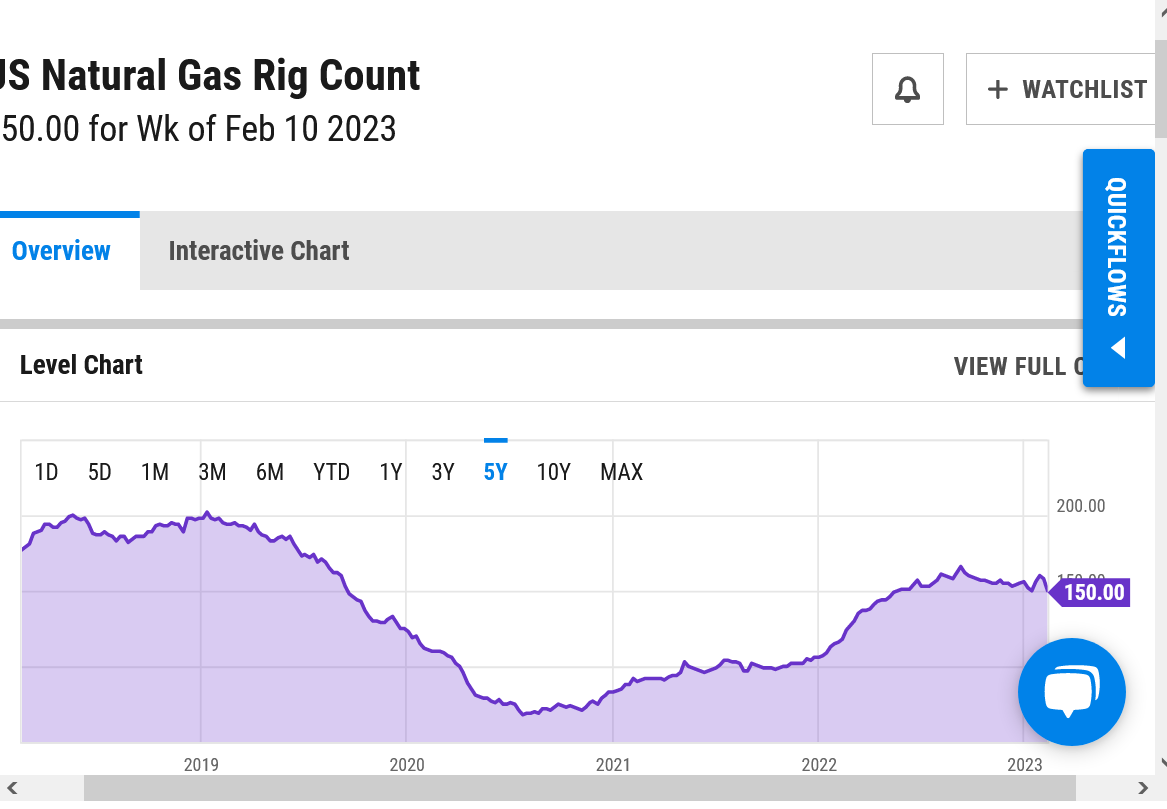
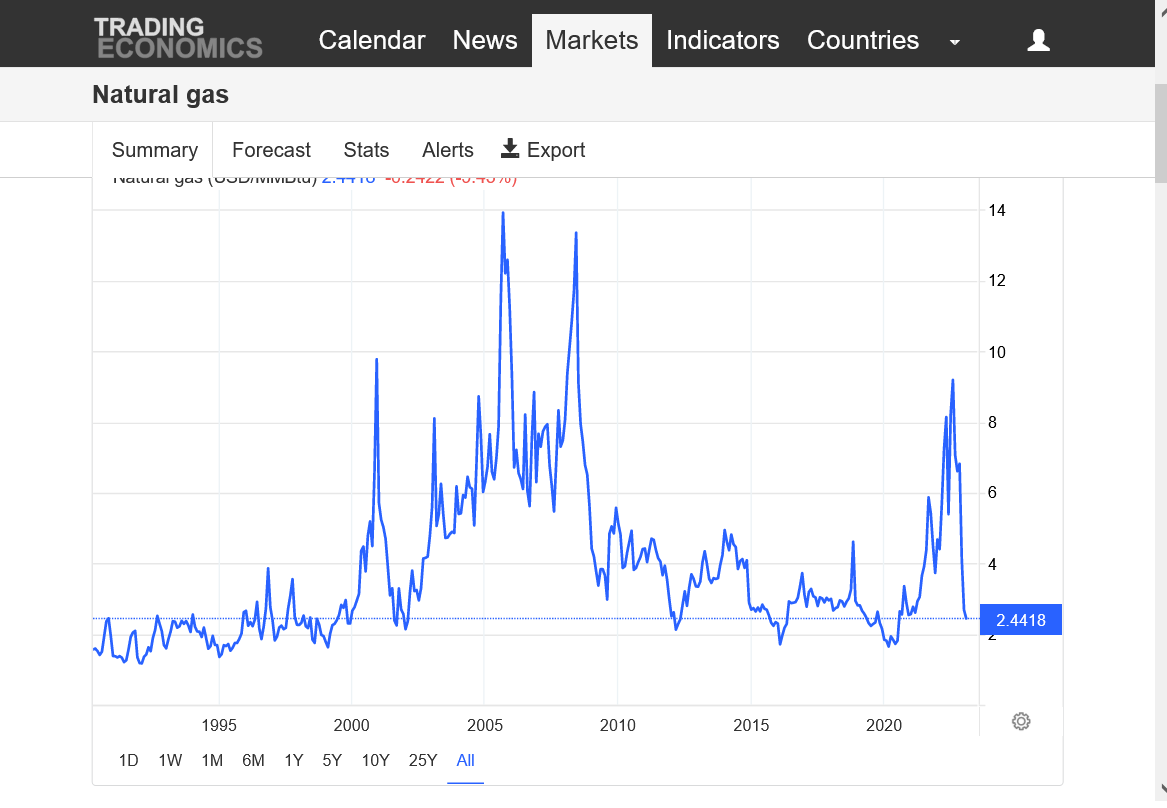
https://tradingeconomics.com/commodity/natural-gas
35 years below
5 years below
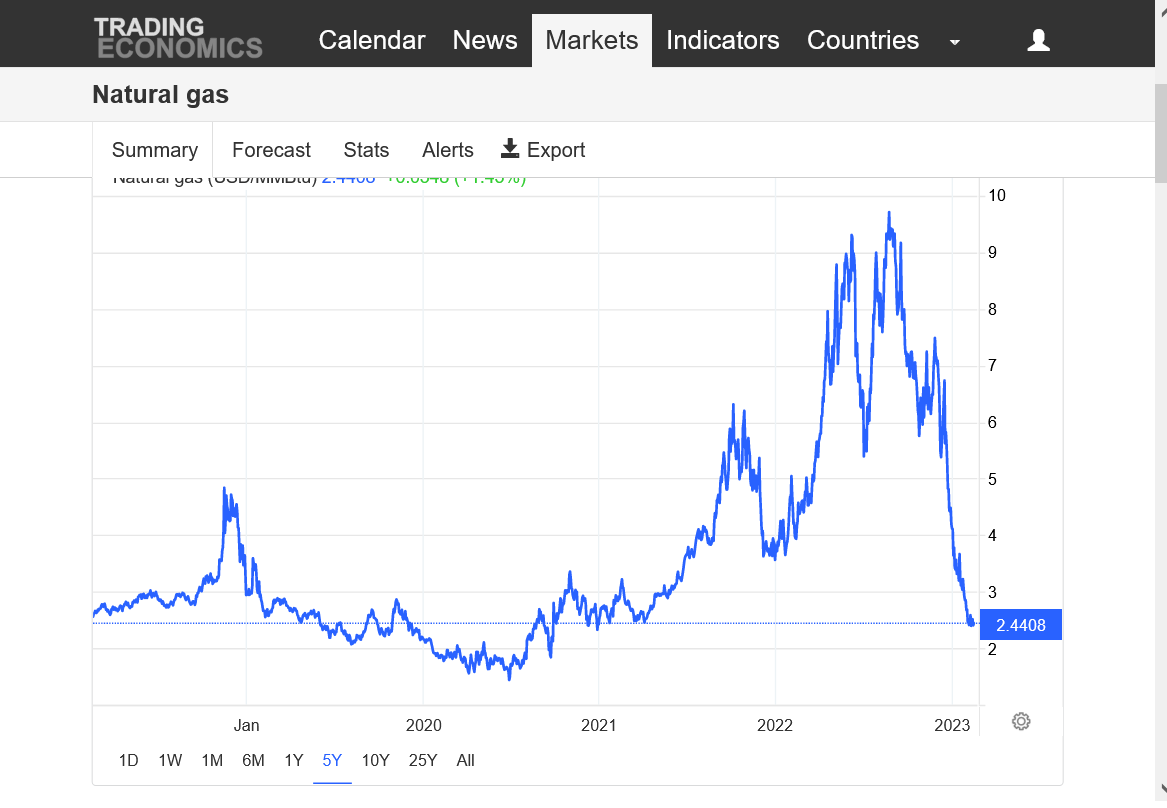
1 year below
A strengthening export demand outlook helped natural gas futures rebound in early trading Tuesday, though the prospect of continued padding of the storage cushion amid mild winter demand was seen limiting upside. Coming off a 10.9-cent sell-off in Monday’s session, the March Nymex contract was up 12.2 cents to $2.527/MMBtu at around 8:45 a.m.
+++++++++++++++
I mentioned that yesterday!
EE was +7 HDDs!
Hey Mike,
I'm back, sorry for the delay.
Whereas the AO hasn't looked that exciting, the GEFS trends toward a -NAO are getting stronger with one possibly starting as early as 2/27. The 0Z 2/14 run had 25% of members with a -NAO already by Feb 27th. The new run (12Z) mean for Feb 27th looks even closer to a -NAO. So, chances of it starting in very late Feb are rising imho. Furthermore, the major SSW is on schedule and the latest GFS based forecast has the 10 mb 60N winds down to -15 m/s at the first low point on 2/18. Whereas -15 isn't nearly strong as the strongest on record, which is well down into the -20s, a -15 is no slouch and probably is stronger than the average major SSW.
i missed this up move..was thinking inside week then outside week..came awful close .oh well
Last 18z GEFS was -4 HDDs.
"the GEFS trends toward a -NAO are getting stronger with one possibly starting as early as 2/27. The 0Z 2/14 run had 25% of members with a -NAO already by Feb 27th. The new run (12Z) mean for Feb 27th looks even closer to a -NAO. So, chances of it starting in very late Feb are rising imho."
Thanks for the comment, Larry but I respectfully disagree.
These were the individual ensembles from the 12z GEFS for March 2, 2023/384 hours:
http://www.meteo.psu.edu/fxg1/ENSHGT_12z/f384.gif
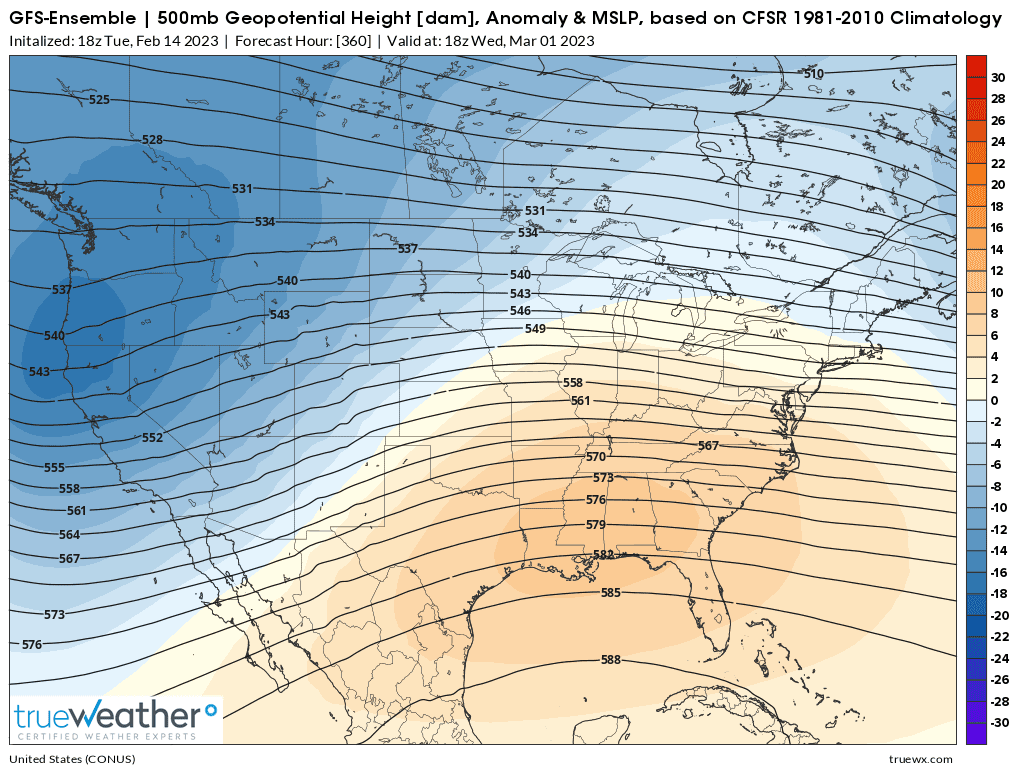
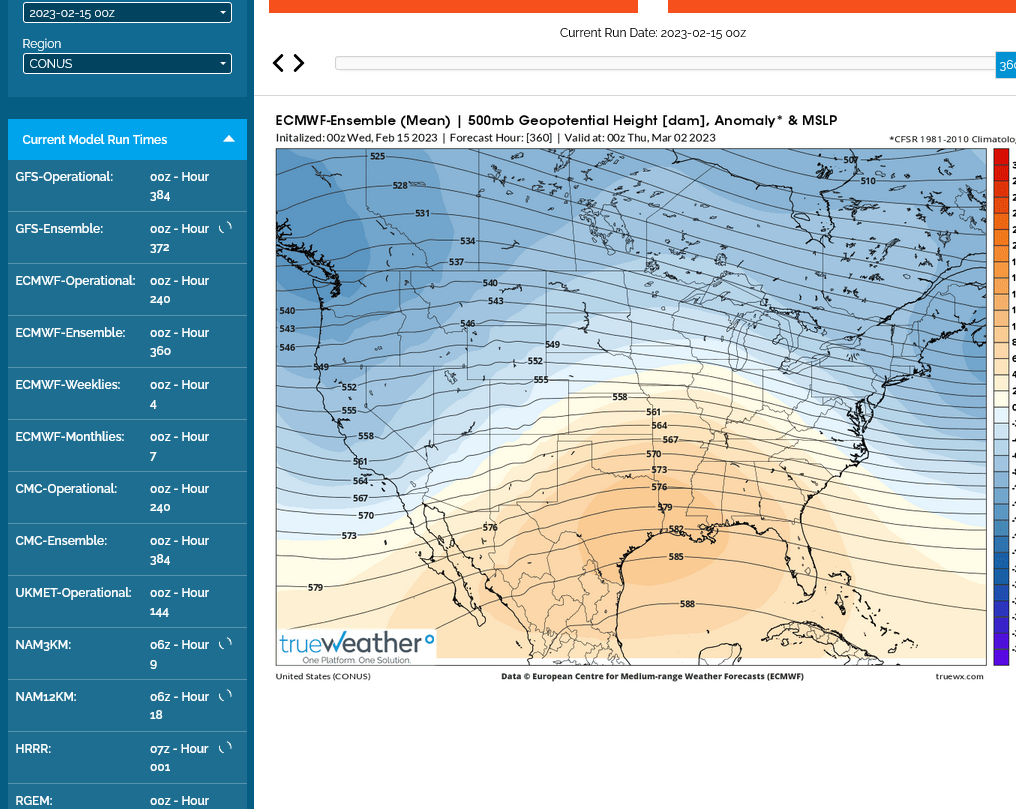
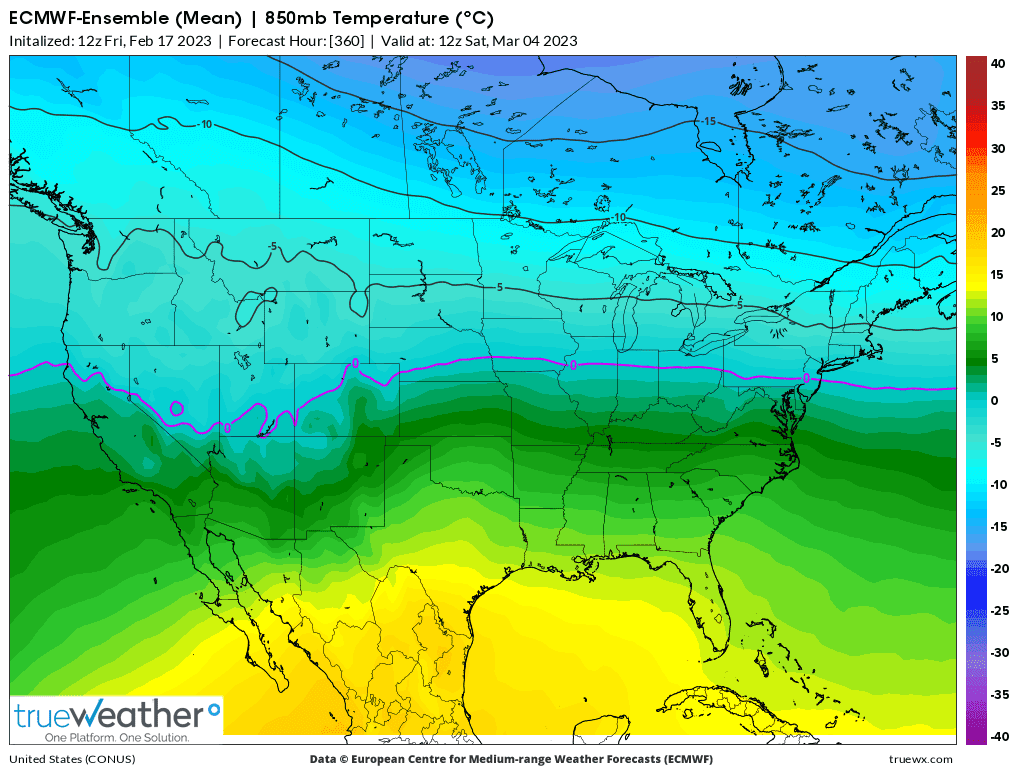
This was the just updated 18z GEFS ensemble mean for March 1, 2023/360 hours. Where do you get a potential -NAO from that? Things can change of course but the best maps for a -NAO were the ones we had on Saturday morning's forecasts.
+++++++++
The 12z run of the EE mean for March 1, 2023/360 hours would seem more favorable below but only if you didn't know it's going in the WRONG direction.
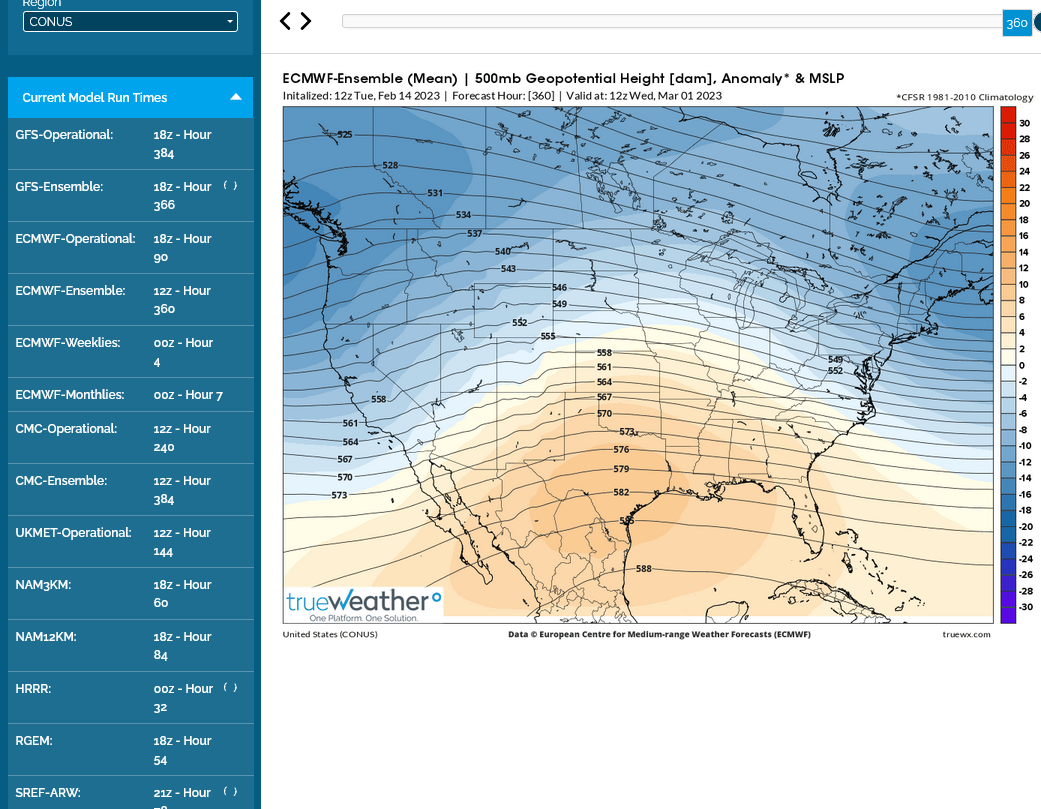
Same map below for the EE, except from 48 hours earlier on Sunday. Saturday morning is actually when the potential -NAO regime peaked on the forecast maps.
Hey Mike,
I'll respond about the individual members with what looks to me like an -NAO asap after I do something for my bro.
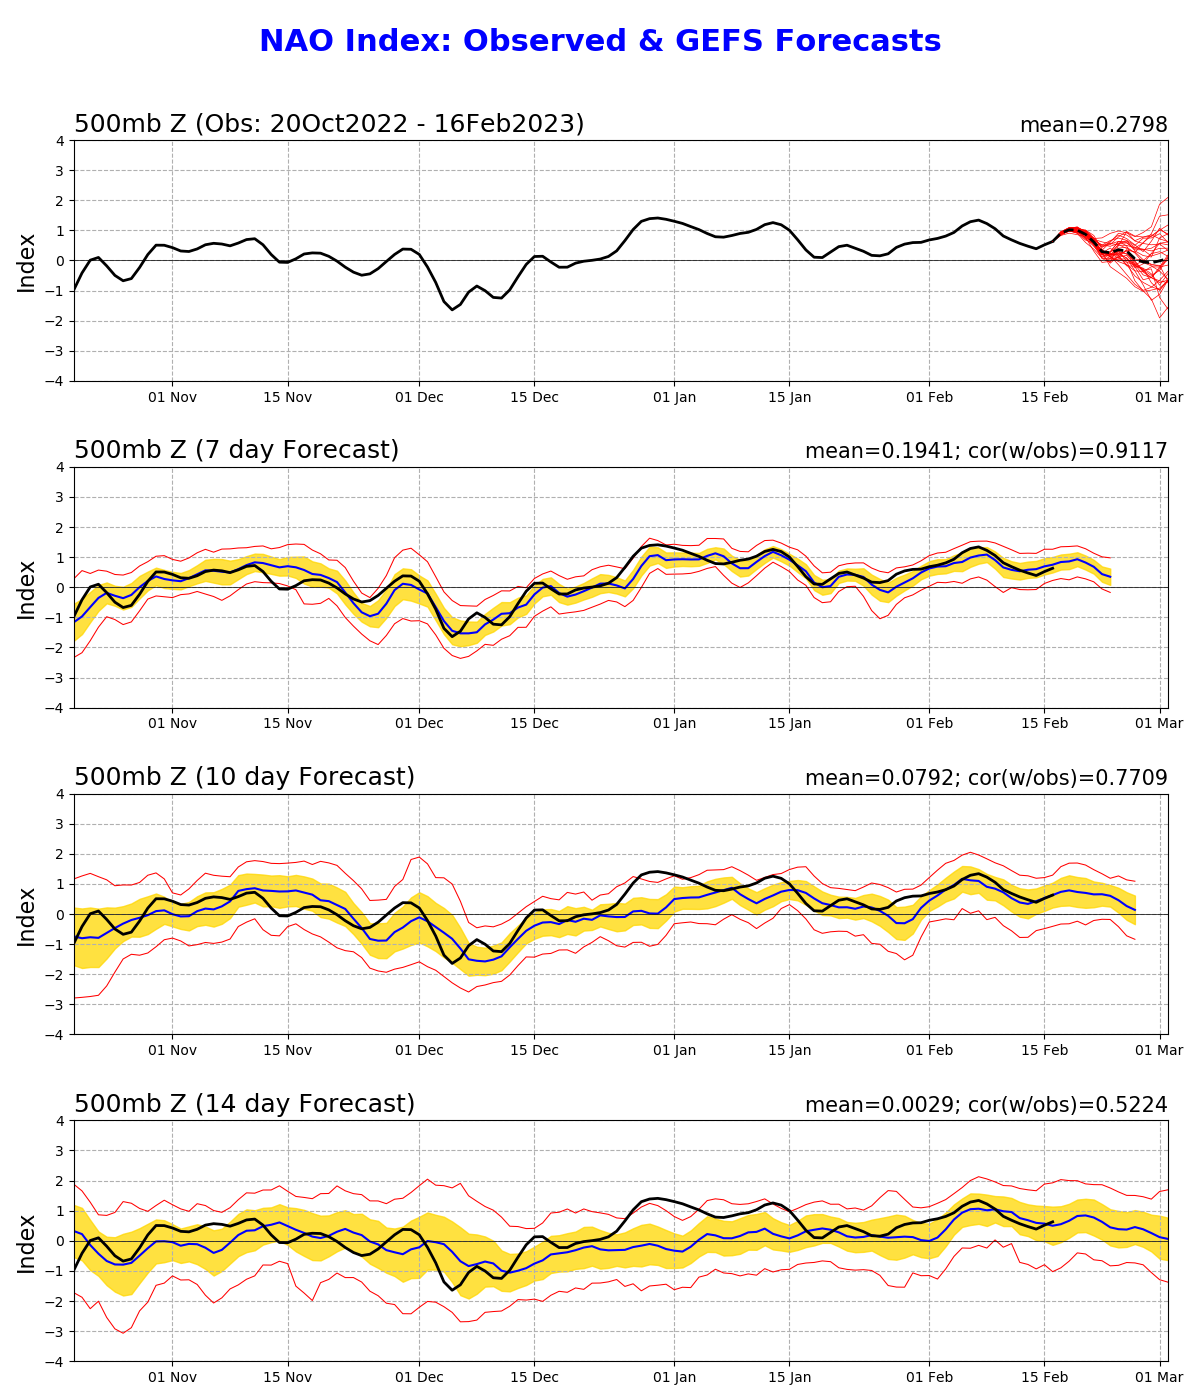
Edit: One thing is that if you look at today's GEFS based NAO forecast and you look at the individual red member lines, you can see the wide range of solutions late in the run with 8 that were sub -0.25 by Feb 27th.
More on looking at the 12Z and picking out the ones with a -NAO soon.......
Edit: Normal H5 is ~515 dm at S tip of Greenland ("G") the focus of this analysis
Here are just the obvious (to me) -NAOs:
C000 (strong), P001 (very strong), P004 (E based), P005 (W based), P007, P008, P011, P019 (strong), P024 (E based), P029 (E based), P030 (strong)
So, 11 of 32 non-mean members (~1/3) are clearly -NAOs with 4 strong+.
Why do I have P001 very strong? At S tip of G, heights are way up at 570 dm or a whopping 55 dm above normal while to the S offshore the Maritimes and NE US heights are well BN.
C000/P019/P030 have S G hts of 552 and MB hts to the S.
Thanks, Larry!
EE was -6 HDDs.
This was the last map of the latest 0z GEFS.
You can spin it -NAO based on overweighting a minority of the solutions that tell you what you want to see but this GEFS ensemble mean map below for March 3, 2023 is NOT cold.
And it's not been headed towards colder since last Saturday.
Things can always change and you might end up right because weather frequently changes but this is NOT a favorable pattern to bring cold from Canada deeply into the US and its NOT moving in that direction.
The just out 0z EE ensemble mean below was LESS bullish too. Some cold in the Northeast, yes but LESS cold then the runs over the weekend.
Compare the 850 temps on the map below from this run last run to the one from Sunday Morning (the 2nd one below) that had already started to warm up vs the Saturday morning solution. Look where the 10 Deg. isotherm was farther south on the 2nd map for the forecast from 60 hours earlier.
You are saying that the models are getting colder but they're getting milder. This is the indisputable proof.
NG may have hit a bottom and we might go up no matter what but it's NOT because of the weather forecasts getting colder.
Same run with last map from 60 hours earlier.
Indices were a bit more favorable overnight for cold in the Northeast (falling towards 0 at the end of the period) to cause cold in week 3 but have a very long way to go and still not as favorable as solutions from 2-11-23.
Eventually, after many weeks of NOT being cold, there will be some cold at some point.
+++++++++++++++++++++
Arctic Oscillation Index, North Atlantic Oscillation Index, Pacific North American Index.
https://www.cpc.ncep.noaa.gov/products/precip/CWlink/daily_ao_index/ao.shtml
https://www.cpc.ncep.noaa.gov/products/precip/CWlink/pna/nao.shtml
https://www.cpc.ncep.noaa.gov/products/precip/CWlink/pna/pna.shtml
++++++++++++++++++++++++++++++++++++++++++++
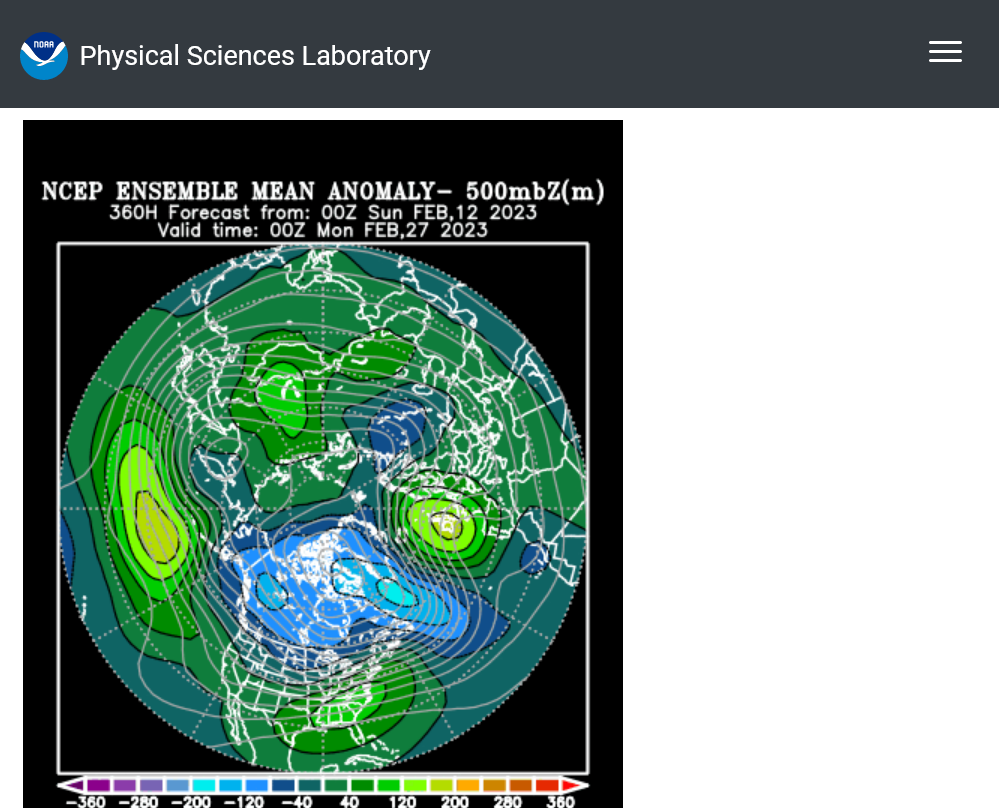
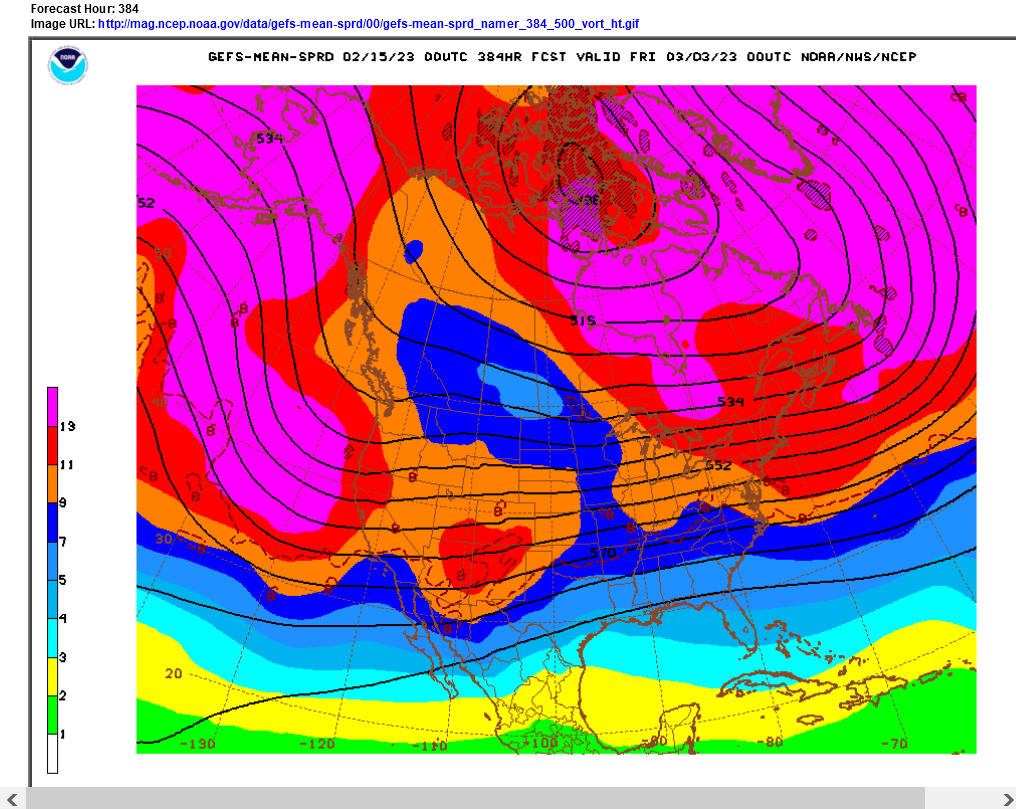
GFS ensemble mean anomalies at 2 weeks. Upper level ridge over Greenland can always turn into a Greenland block.
https://www.psl.noaa.gov/map/images/ens/z500anom_nh_alltimes.html 
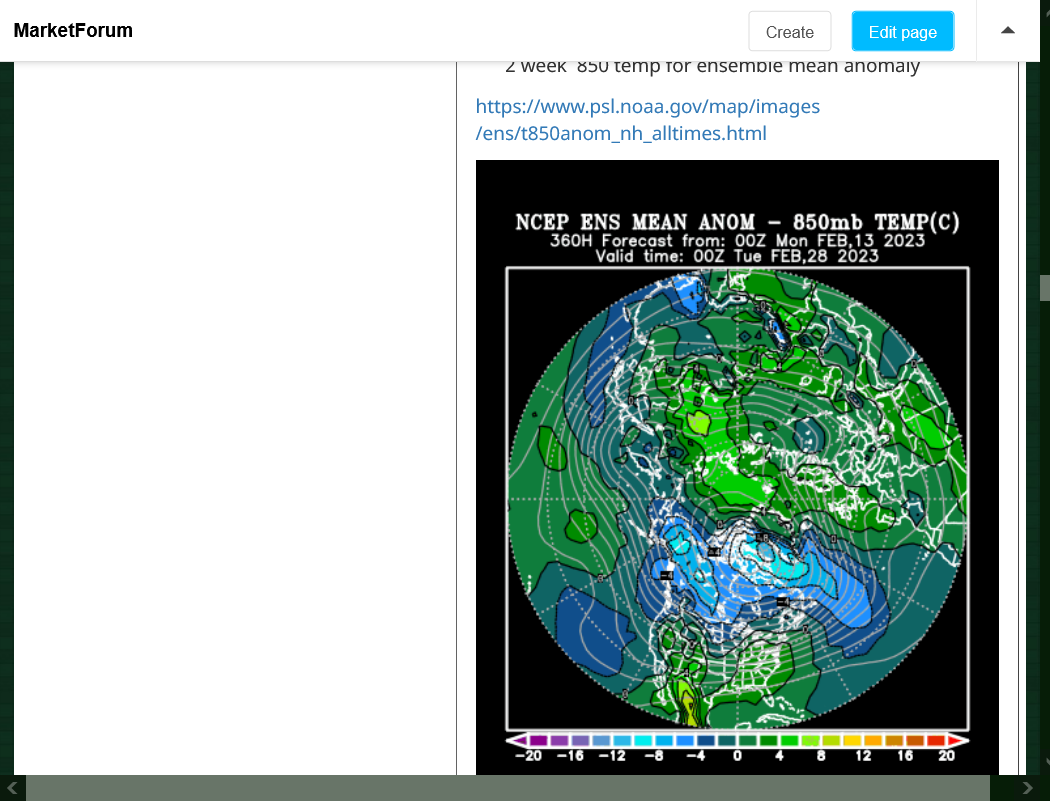
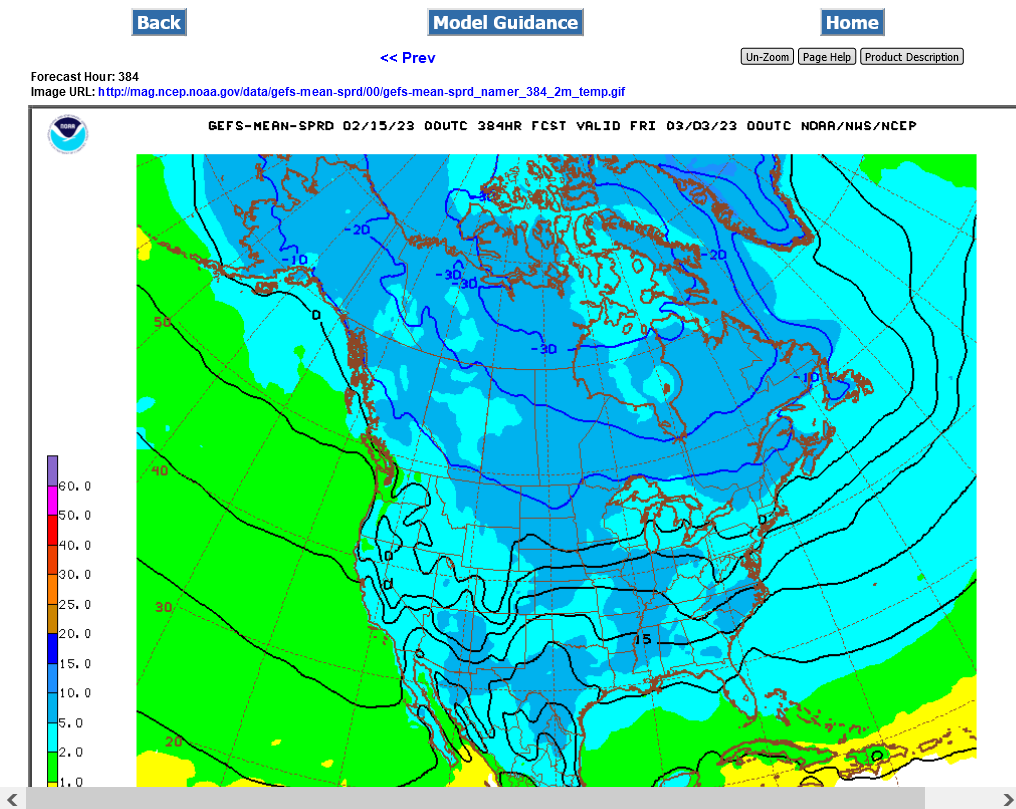
2 week 850 temp for ensemble mean anomaly. This is still very mild for much of the high population US.
https://www.psl.noaa.gov/map/images/ens/t850anom_nh_alltimes.html
Hey Mike,
This is what I said:
"I'm back, sorry for the delay.
Whereas the AO hasn't looked that exciting, the GEFS trends toward a -NAO are getting stronger with one possibly starting as early as 2/27. The 0Z 2/14 run had 25% of members with a -NAO already by Feb 27th. The new run (12Z) mean for Feb 27th looks even closer to a -NAO. So, chances of it starting in very late Feb are rising imho. Furthermore, the major SSW is on schedule and the latest GFS based forecast has the 10 mb 60N winds down to -15 m/s at the first low point on 2/18. Whereas -15 isn't nearly strong as the strongest on record, which is well down into the -20s, a -15 is no slouch and probably is stronger than the average major SSW."
------------------------------
I stand by every word of this. I'm not spinning anything and have no reason to spin. I was talking about a trend toward an earlier start to a -NAO. Since yesterday, that earlier trend continues. Here's an update:
- The 0Z GEFS based NAO forecast, as you just showed, is trending even earlier toward 0. Yesterday's 0Z GEFS had 8 members (25%) of 31 with a sub -0.25 NAO by Feb 27th. Today's has 10 of the 31 with sub -0.25 by 2/27. Also, the mean line already gets down to 0 on Feb 26th, which is two days earlier than yesterday's showed.
- The major SSW is underway with the latest GFS based forecast for a dip to an impressive -16 m/s on 2/18 vs -15 on yesterday's forecast.
Larry,
The vast majority of solutions DON'T have a -NAO and all you type/talk about is the minority ones that do.
I totally respect your views and they often see things that I miss .....which is how I take EVERY post of yours but I'm pointing this out as an observation to assist you.
When we disagree, my first assumption is that I'm completely missing something and I look hard to find it. It still hasn't shown up on any weather models this week but I'll remain vigilant. I mean this to sincerely point out something legit.
Days 6-10 of the EE came in -6 HDDs which is one reason why NG is getting hit hard towards the close. The other, which has been impacting trading all day is that there's no substantive indicator that suggests major cold the next 2+ weeks....other than outliers and minority solutions that often pop up and should not be used for reliable guidance, even though they should never be completely ignored.
The reason I've been emphasizing the minority of members with a -NAO is because I've been emphasizing the TREND toward an earlier -NAO. The number of members with a -NAO has been increasing for the same dates vs earlier runs. Now the mean NAO is already down to ~zero on Feb 26th. Yesterday it was Feb 28th. The point I've been trying to make is that the troposphere has been very difficult to forecast in the past vs forecasting the stratosphere. A major SSW is not the norm and the models may be slow to catch onto new NAO blocking resulting from the current SSW.
Thanks, Larry!
The 12 EE is completely out.
As has been the trend, the isotherms are shifting northeast as the colder air continues recede and be LESS threatening with time.
Previous run

Sunday morning run-colder than the ones since then.

As mentioned previously, the COLDEST run was on Saturday morning but I can't get that.
This can always change to colder, especially in light of the SSW but that's not what the majority of the objective weather guidance has been showing.
TJ.you still long
++++++++++++++++++
Just out 18z GEFS was -5.5 HDDs. Gave is a little spike lower. EIA report tomorrow should be bearish compared to last year and the 5 year average but will it be as bearish as expected?
Stopped out 932 am when declined into a new low. Horrible fill (1032 est) (Plus 600)
Thanks tjc,
The 0z EE was a whopping +14 HDDs colder which caused much of the strength overnight. This was after the 0z GEFS was +9 HDDS.
The next, 6z GEFS was -11 HDDs early this morning!
![]()
for week ending February 10, 2023 | Released: February 16, 2023 at 10:30 a.m. | Next Release: February 23, 2023
| Working gas in underground storage, Lower 48 states Summary text CSV JSN | |||||||||||||||||||||||||
|---|---|---|---|---|---|---|---|---|---|---|---|---|---|---|---|---|---|---|---|---|---|---|---|---|---|
| Historical Comparisons | |||||||||||||||||||||||||
| Stocks billion cubic feet (Bcf) | Year ago (02/10/22) | 5-year average (2018-22) | |||||||||||||||||||||||
| Region | 02/10/23 | 02/03/23 | net change | implied flow | Bcf | % change | Bcf | % change | |||||||||||||||||
| East | 498 | 529 | -31 | -31 | 442 | 12.7 | 470 | 6.0 | |||||||||||||||||
| Midwest | 601 | 641 | -40 | -40 | 504 | 19.2 | 545 | 10.3 | |||||||||||||||||
| Mountain | 114 | 120 | -6 | -6 | 115 | -0.9 | 118 | -3.4 | |||||||||||||||||
| Pacific | 122 | 124 | -2 | -2 | 178 | -31.5 | 197 | -38.1 | |||||||||||||||||
| South Central | 931 | 951 | -20 | -20 | 700 | 33.0 | 753 | 23.6 | |||||||||||||||||
| Salt | 262 | 271 | -9 | -9 | 178 | 47.2 | 220 | 19.1 | |||||||||||||||||
| Nonsalt | 670 | 680 | -10 | -10 | 522 | 28.4 | 532 | 25.9 | |||||||||||||||||
| Total | 2,266 | 2,366 | -100 | -100 | 1,938 | 16.9 | 2,083 | 8.8 | |||||||||||||||||
Totals may not equal sum of components because of independent rounding. | |||||||||||||||||||||||||
Working gas in storage was 2,266 Bcf as of Friday, February 10, 2023, according to EIA estimates. This represents a net decrease of 100 Bcf from the previous week. Stocks were 328 Bcf higher than last year at this time and 183 Bcf above the five-year average of 2,083 Bcf. At 2,266 Bcf, total working gas is within the five-year historical range.
For information on sampling error in this report, see Estimated Measures of Sampling Variability table below.
metmike: Bearish........as expected by the market. We're now at +183 BCF vs the 5 year average and +328 BCF vs last year/2022!
However, note the Pacific region above, at huge deficits to those comparisons.
https://calmatters.org/economy/2023/02/gas-prices-utilities-commission/
So their solution is to double down on the plan which is causing the problem. According to them, they should just shun NG even more and keep promising even more of the fake green fairy energy that is massively underperforming and will eventually save them by defying the laws of physics and energy (while enriching crony capitalism and self serving political agenda).
https://www.marketforum.com/forum/topic/88534/
How about doing what the rest of the country has been doing. INCREASE NG SUPPLIES.
Chance of that working to curb the highest prices in 20 years and alleviating the dangerously low amount of ng in storage for that region?
100%
Chance of using fake green energy to manage it along with the continued push for massively increasing demand from electric cars, while REDUCING natural gas dependence/supplies, working to bring energy prices back to being affordable?
Near 0%!
Just updated 12z GEFS continues with more confirmation that late week 2 and beyond will NOT feature the extreme cold generated by the SSW, coming bodily into the Eastern US with a -NAO.
As is often the case, there are still some outlier solutions that show the opposite and a chance THEY could be right because of the wide spread and uncertainty here.
12z EE coming out has given back much of the increase in HDDs from the previous run.
Hey Mike,
I noticed that the models had been rather unimpressive with their -NAO predictions the last 2 days or so in that they seemed to stop progressing forward. That includes today's Euro weeklies, which actually weakened the -NAO through March.
However, the brand new (0Z) GEFS mean has what appears to me the strongest -NAO yet for any GEFS run for late month into early March. It gets started ~2/26 and, intensifies into the first part of March, and persists through the end (3/4). This could very well be mainly due to the current SSW downwelling into the troposphere, which typically takes at least 10-14 days to get started assuming it actually does work its way down.
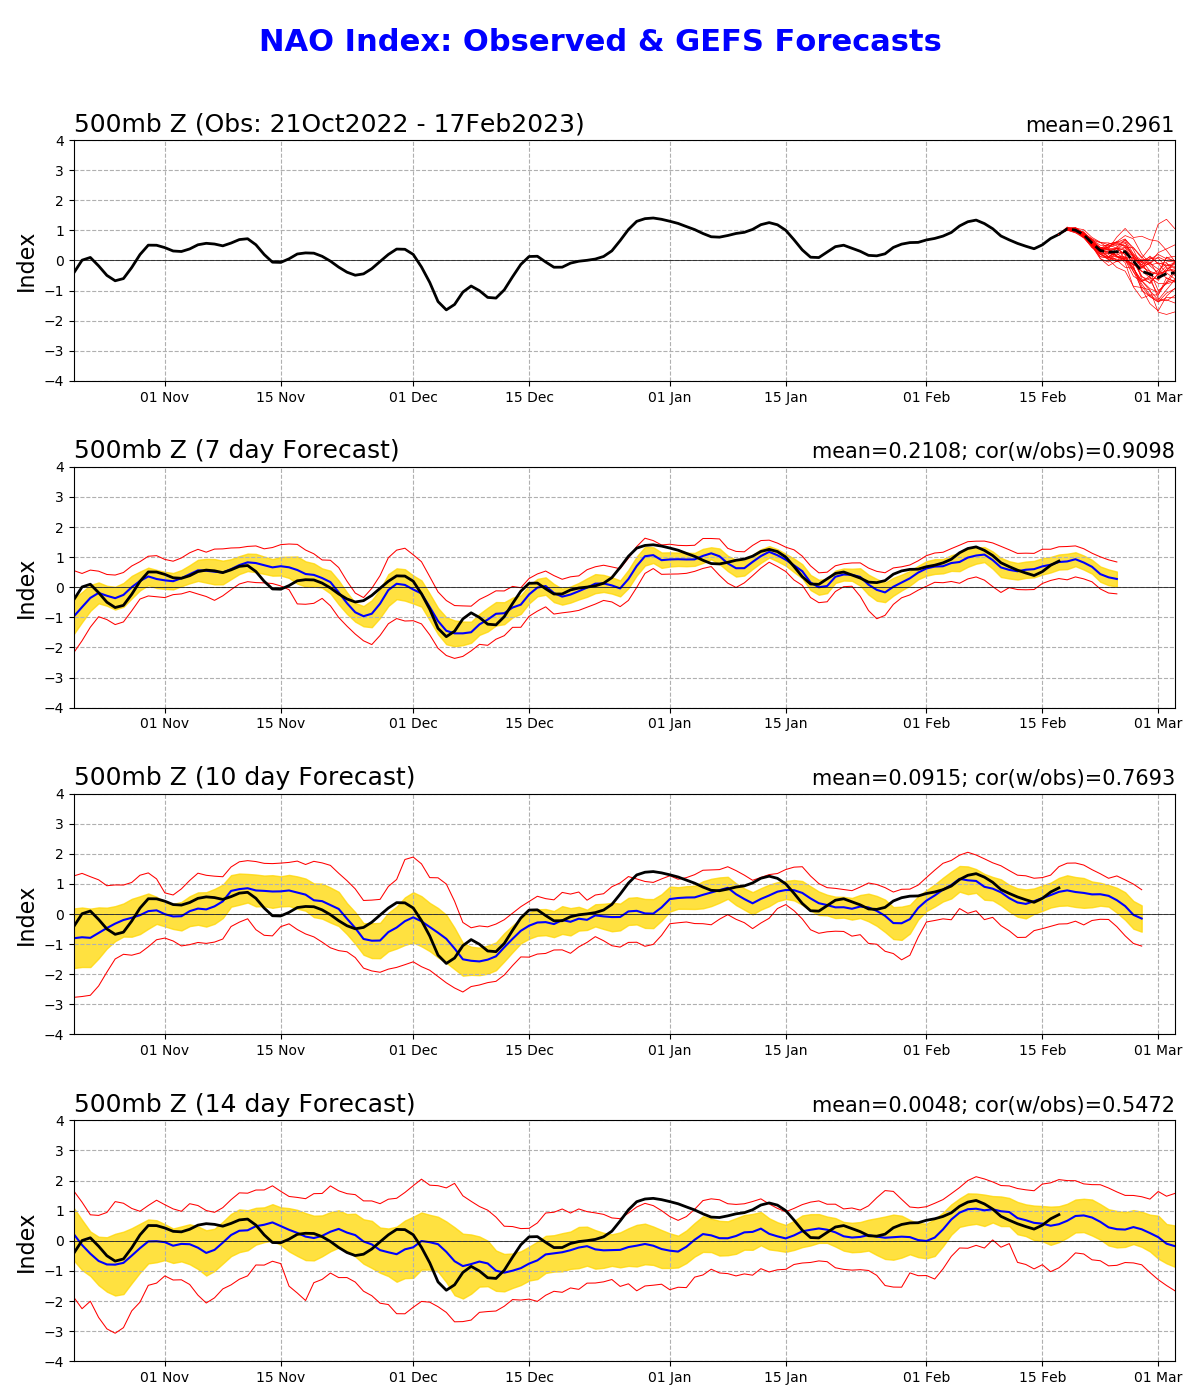
Let's see what the updated GEFS (2/17) based NAO graphs show. Whereas the last couple had a near 0 for 2/26-3/1, I expect to see it going sub 0 as early as 2/27 and even lower by 3/1. Let's see if my eyeballing ends up correct.
Here's the 2/16/23 GEFS NAO forecast: mean gets down to zero 2/26 and stays there to end but with wide spread

I CAN'T REMEMBER A WINTER AS WARM AS THIS ONE HAS BEEN, SO FAR.
I DOUBT IT'S BEEN COLD ENOUGH, FOR LONG ENOUGH, TO EVEN KILL OFF GRUBS.
AT LEAST MY PROPANE IS BACK UNDER $2.00
larry,
I see the -NAO in some of the solutions that you noted.
the spread in the NAO and especially the AO right now was as wide as I remember in my life! several have a record +4 or higher. A couple are -2.
there are more -NAO solutions today.
pits mainly from an extreme positive anomaly that’s east of Greenland. its too Far East in most situations to have sustained very cold implications for more than the far northeast.
scroll up to see that.
the gefs added a few HDDs overnight But the EE was -7HDDs and the actual gefs solution is very mild for much of the southeast at the end of 2 weeks, despite the -nao by more members overnight.
more later this morning.
i thought the contract didnt make a new low till this morning
thanks coffee,
NG getting crushed again. too much supply, not enough cold in the forecast.
I guess we need to plunge to a level that shuts down more supply.
this is the timeframe for a typical seasonal bottom and prices are extremely low but bottom picking without bullish weather in a Weather market is risky.
in a month. I’m betting it’s clear where and when the bottom happened and it might be a low tht we don’t penetrate for years.
or this could be 1 last washout and it’s clear next week if the pattern finally turns colder.
Hey Mike,
Last night I said:
"Let's see what the updated GEFS (2/17) based NAO graphs show. Whereas the last couple had a near 0 for 2/26-3/1, I expect to see it going sub 0 as early as 2/27 and even lower by 3/1. Let's see if my eyeballing ends up correct."
-------------------------------------------------------------------------------------------------------------------------------------------------------------
It verified almost exactly as my eyeballing of the GEFS maps suggested. The 2/17 (today's) GEFS forecast is a substantial change in the -NAO direction of the mean (earlier and stronger) vs yesterday's forecast:
Old GEFS (2/16/23): mean (black dashed line) fell to 0 on 2/26 and stayed near 0 through the end (3/2):
New GEFS (2/17/23): black dashed line again falls to 0 on 2/26, but instead of steadying out there it falls further to ~-0.5 on 3/1 and ends at ~-0.4 at the end (3/3):
- The 2/13 forecast had only 2 members (~6%) with a sub -0.25 NAO (what I consider -NAO) on 2/27. The mean for 2/27 on the 2/13 run was still up at +0.5 vs 0 on the 2/16 run and -0.3 on the 2/17 run.
- The 2/14 forecast had risen sharply from the 2/13 run from 2 to 8 members (~25%) with a sub -0.25 NAO on 2/27.
- The 2/15 and 2/16 forecasts each had ~10 members (~33%) with a sub -0.25 NAO on 2/27.
- The 2/17 forecast has ~15 members (~50%) with a sub -0.25 NAO on 2/27.
- The 2/16 forecast had ~10 members (~33%) with a sub -0.25 NAO on 3/1 vs ~23 (~75%) on the new one
- The 2/16 forecast had only 3 members (~10%) with a sub -1 NAO on 3/1. The 2/17 forecast has 10 (~33%).
- The 2/16 forecast had 12 members (~40%) with a +0.25+ NAO (what I consider +NAO) on 3/1 vs only 3 (~10%) now.
- The point I've been trying to make is that the NAO Forecast has been trending earlier and more negative.
so you are expecting first part of ,march to finally give us a shot of cold?
With a -NAO, the NE US would finally have a shot at cold (though far from a guarantee) in early March after a mild most of Feb. But due to a stubborn -PNA and +AO on models trying to counteract, it will be hard for the SE to get cold unless the -PNA especially were to lessen.
Thanks Larry,
I continue to think that you are not viewing the forest because certain trees are blocking your view.
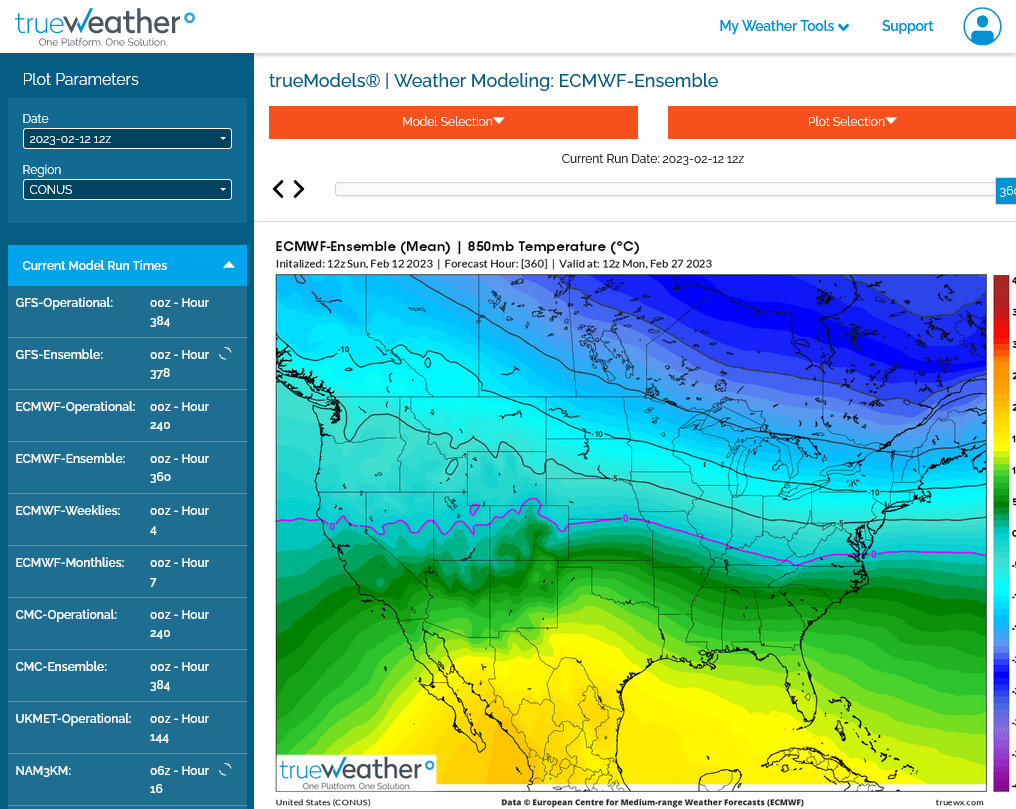
These were 850 mb temps from the EE on the 360 hour map going back to Sunday morning. Temps at this level are the best indicator of what actual temps will be. Much better than the value of the NAO.
It was a no brainer for the market to see the late week 2 period as bearish for natural gas this week.
850 temps from the 360 hour solution on 12z Sunday. -10 deg. C isotherm along NY/PA border.
Same map for 3 days later from 12z Wednesday run. -10 deg. C line shifted northward to northern tip of NY, along with all the isotherms shifting northeast in the entire eastern 1/2 of the country.

Same exact map but for the run 2 days farther out, from the last 12z Friday EE run. 850 temp isothern is now in Canada to far northern Maine and crystal clearly MILDER everywhere in the East using this key indicator.
So the market responded exactly as it should have if it was trading on weather. New lows for the move.
https://tradingeconomics.com/commodity/natural-gas
1 week below.
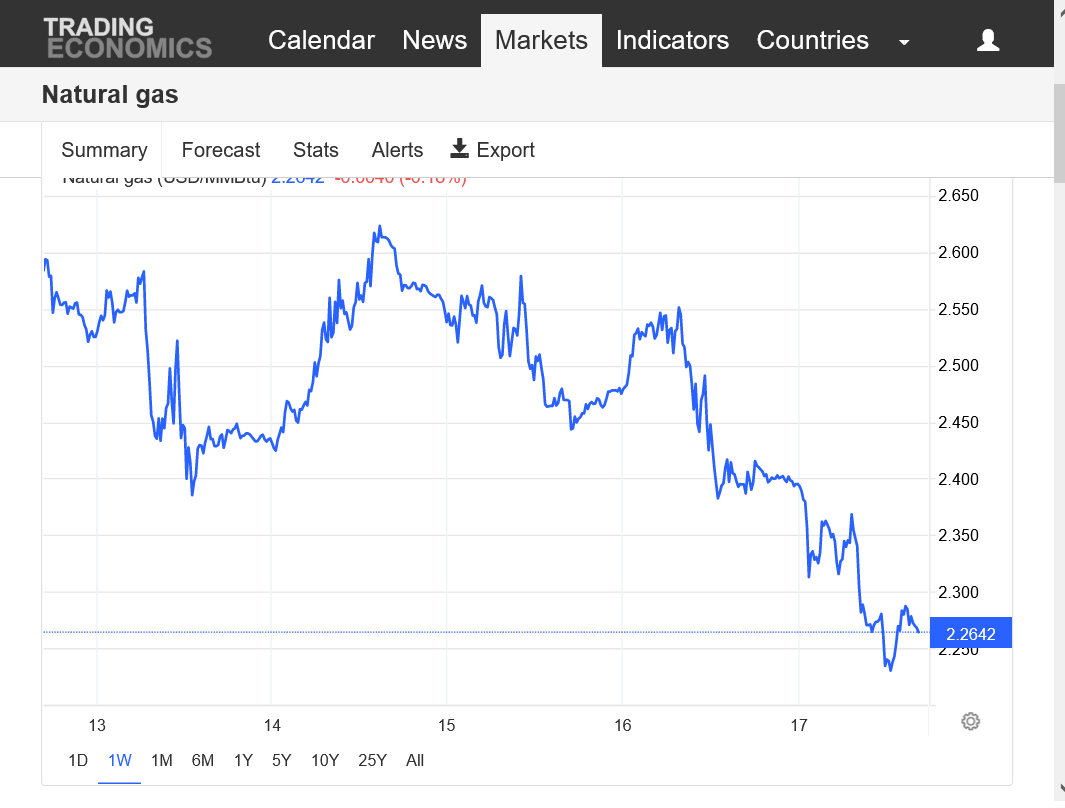
1 year chart below.
The -NAO is a legit, powerful signal that often modulates cold in much of the Eastern half of the country but but it's only 1 of several important elements which determine temps in the high population centers which matter when it comes to residential demand for NG during the heating season only. The NAO is not that important during the cooling demand season.
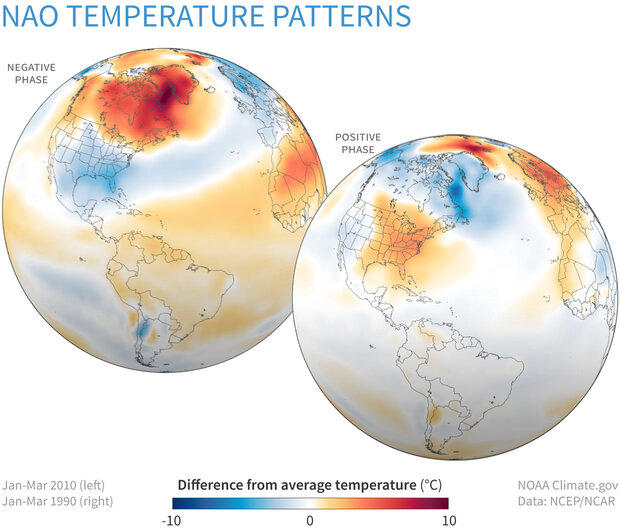
I think that if you look at the negative phase temp pattern above, it's a horrible match for what the model forecasts for late in week 2 and possibly beyond, other than a strong positive anomoly east of Greenland. The big ridge in the southeast is bad news for a -NAO.
The very low skill week 3-4 temp forecast has cold oozing out of Canada into the northern tier states.
Their discussion indicated that they gave no weight to the ongoing SSW event to this forecast, probably because there's so much uncertainty.
Again, that doesn't mean that we don't know alot...........which I just shared above and the market traded last week. Having uncertainty shouldn't increase your hope or risk that something might happen that contradicts the majority of evidence.
https://www.cpc.ncep.noaa.gov/products/predictions/WK34/

The -NAO is a bit more negative again today. Also, the AO is MUCH less positive. This increases the chances for cold in March.
https://www.marketforum.com/forum/topic/93014/#93136
Supporting this is the positive anomaly in the high latitudes is a bit farther west over Greenland at the end of 2 weeks. This is the feature that will be a key player for air from higher latitudes to move to mid latitudes but mainly if the mid latitudes accommodate.
An upper level ridge in the Southeast or East will OPPOSE that as will a -PNA which often results in such a ridge.
added: The reality, however is that the GEFS was -5 HDDs and has been LOSING HDD's in most runs recently and the market would likely NOT be threatened by this "theoretically possible" cold if we were trading today.
Glad you posted this.. Im reading rhetoric on the Ng board that the HDD had been lost and big gap down lol
coffee,
I just read your post after I added the comment in the previous post. I also fixed the link.
Oh damn
Double damn..I went long at the close Friday.. Literally I placed an order below the market 3o minutes before 5pm est and they filled me with a split second left
latest gfs suddenly showing a whopper of a storm for ny next weekend///they have teased before but this time the euro also shows something brewing`
Thanks coffee,
Hopefully you and Larry will get lucky. If not, there's always a lesson to learn about getting married to a position. Whether it's a loss from trading or biased view about weather.
If you think this is harsh. There was no legit WEATHER reason to buy last week for the objective trader.
I feel qualified to make this statement because I've done the same thing a dozen times and am constantly tempted to do it but have to fight the temptation. Otherwise, it's gambling, not smart weather trading for me.
If NG was open, it likely would be lower today. But that can change with the -NAO. Note that this is HOPE. Hoping that it will change to bullish because of something that isn't there right now but has a chance of happening.
This is also why I don't advise traders to use options, unless they are SELLING them(in most cases). There is a ton of hope premium built into the price of options. When the hoped for dynamic doesn't happen, the buyer loses the entire cost. Yes, it limits the loss but it limits the chance of being successful by even more!
Traders like tjc and Larry understand all of this and usually have good trading strategies to justify using options. But for the average or inexperienced trader......you will usually lose often enough that it exceeds the rare trading home run you hope to hit.
Big thanks to you for mentioning the NG trading forum!
It's extremely active and as I mentioned before, there are some solid opinions mixed in with the no nothings. I found this link there this morning to pass on. Commitment of traders. There is some extremely interesting and useful information on that report that I hadn't analyzed for over a decade.
https://www.cmegroup.com/tools-information/quikstrike/commitment-of-traders.html
I had no idea that the largest 4 traders have so much control. They were building a short position last year as the price soared higher but let up since the price peaked.
They've actually been building a long position since then too and have alot of control. Obvious the longs have been feeling extreme pain since last August.
In 2008, when the price peaked near $14, the largest 4 traders were 50% of the total interest for Short! This might include spreads??


Here's the NG forum again:
https://www.investing.com/commodities/natural-gas-commentary
Commitment traders data has not come out for the last 3 weeks there's some sort of problem
GFS took out all the snow for ny.. Euro too.. Why have they been playing this way all winter
Yeah actually and now they just taking the storm completely out of the forecast. It's a rain event.. What say you? Hdd
worse and worse?
CC,
Less HDDs for sure and that part is solidly bearish.
However, the potential pattern that Larry was hoping for may be taking shape heading towards the 2nd week in March.
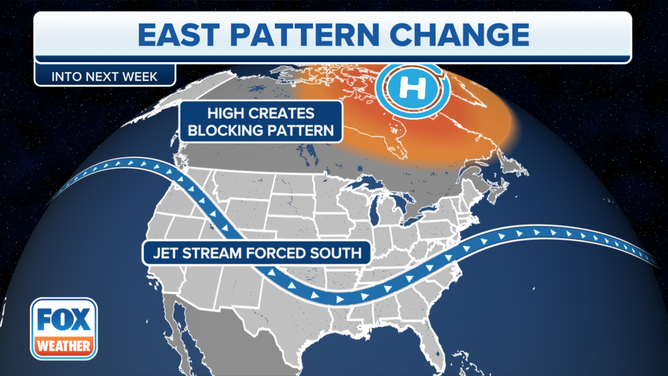
With the key feature I've been mentioning, the strong positive anomaly in Greenland acting as a potential Greenland block, forcing the jet stream pretty far south.
Interesting how it happens with a -PNA(which favors ridging and warmth in the Southeast/East.
The polar jet stream is sort of zonal across the country but its suppressed very far south and at the base of an extensive upper level trough elongated across most of the country, except the Southeast(and the Southeast ridge is breaking down with the -NAO).
The cold air will always be along and north of the polar jet and this pattern will allow that cold to drain south, into the US, especially in the Western 2/3rd of the country.
https://www.marketforum.com/forum/topic/93014/#93136
This was from an article from last December NOT NOW but I captured the image of the pattern below that illustrates it well. THIS time, the trough below will be farther west initially but the cold will be coming south in the western 1/2 of the country by late in week 2 and probably the northern tier. This will gradually beat down the upper ridge in the Southeast.
https://www.foxweather.com/weather-news/greenland-block-eastern-us-snow-arctic-air
Our pattern at 2+ weeks/March 6th is below:
This will NOT be extreme cold like we saw in December, when the pattern featured cross polar flow and Canada was filled with bitter cold from Siberia that came south bodily.
will the market even pay attention to this?
btw thanks mike for all your work and patience
YW,
the EE was -7HDDs bearish for the next 2 weeks. The impacts of this pattern will likely not start showing up until the 2nd week in March, as I was stating which is week 3.
im actually looking to get long now but not until we have the pattern playing out more. If the -PNA causes the ridge in the southeast to be much stronger from a mid latitude forcing that trumps the high latitude forcing mentioned above, there could be a lot of resistance to the cold.
I feel confident that even in that case, HDDs will still be close to average for the country as a whole.
so will the market pay attention to it?
doubtful on the open And we might have some very odd, low volume trading from the holiday Tonight that goes in the opposite direction tomorrow!
its also getting very late in the heating season.
moderate cold in March when storage is at a surplus and gaining is not a threat from weather.
in the past, i stopped active weather trading this late in the year for that reason.
however, all things considered, if we have a cold March this would line up perfectly with extremely positive seasonals, low prices and very oversold.
it’s the April onward contracts that have the best seasonal here. Front month, march can see a washout, spike lower towards expiration.
another item is the serious ng deficit out west. will that have an impact At some point on futures.
or exports ramped up?
CC,
I've been in your shoes before. Completely wrecks the enjoyment of your weekend as you wait and hope something changes.......but it doesn't and in fact gets worse as we get closer.
Then, we finally open and the worst part is often over, the NOT KNOWING how bad it might be because its not the worst case scenario.
Then, you have to decide what to do. I can't help you on this one. Sometimes, the worst thing that you can do is bail, when if you were NOT behind and panicking, you would actually be looking to put on the position that you're covering and the emotions cause you to to sell at the worst price of all, when being flat would be causing you to buy at the cheaper price!
However, when your criteria to put on a position is gambling reasons, then its hard to justify doing anything except minimizing risk to avoid potentially bigger losses and put in stops to avoid that, followed by trailing stops if the market moves in your direction.
When there is very solid fundamental and technical reasoning with high confidence, its worth risking more because you have a justification to do so. ......even though we are all wrong at some point and unless you trade NG for a living with inside information and deep pockets, getting married to a position when wrong can wipe out significant capital.
+++++++++++++++++
That reminds me, I never finished this story:
Mike I know it well Unfortunately I built up a tremendous amount of money and lost it all in 2006 and I've been pretty much struggling ever since. Ironically I'm a big fan of the weather and part of a weather chat but I don't usually trade weather based market decisions.. please post the end of your story
EE was +4 HDDs but the ridge in the Southeast is looking pretty tenacious on this run for all the models.
The Canadian model was the coldest 12 hours ago and it really warmed up.
I did exactly what you predicted proud to take a small loss instead of buying when I was supposed to be lol
when we were near the highs, you wished you were still in.
when we sold off below where you got out, you were glad you covered for a small loss, right?
happens to every trader on most trades, especially losses…even small ones. we Are judging the trade based on what we did last. Limit a loss…..feel good. Limit a profit…..feel bad. Cover too soon……feel really bad. Hold on too long to a loss that drains major equity…..the worst.
so the exit price will rarely be perfect. Tic exited his long last week at a much higher price and was unhappy about where he got out then. By the end of the week, he feels like a genius for covering before it turned into a big loss.
…………………………………
As mentioned very early this morning. The tenacious upper level ridge in the Southeast just won't break down because of the persistent -PNA(negative anomoly in the Northwest) which is controlling mid latitude forcing down stream in the Southeast and opposing the favorable high latitude forcing trying to send colder air southward from the Greenland positive anomoly(except farther west).
https://www.psl.noaa.gov/map/images/ens/z500anom_nh_alltimes.html