KEY EVENTS TO WATCH FOR:
Thursday, February 2, 2023
7:30 AM ET. January Challenger Job-Cut Report
Job Cuts, M/M% (previous -43%)
8:30 AM ET. 4th Quarter Preliminary Productivity & Costs
Non-Farm Productivity, Q/Q% (previous +0.3%)
Unit Labor Costs (previous +3.5%)
8:30 AM ET. U.S. Weekly Export Sales
8:30 AM ET. Unemployment Insurance Weekly Claims Report - Initial Claims
Jobless Claims (previous 186K)
Jobless Claims, Net Chg (previous -6K)
Continuing Claims (previous 1675000)
Continuing Claims, Net Chg (previous +20K)
10:00 AM ET. December Manufacturers' Shipments, Inventories & Orders (M3)
Total Orders, M/M% (previous -1.8%)
Orders, Ex-Defense, M/M% (previous -2.0%)
Orders, Ex-Transport, M/M% (previous -0.8%)
Durable Goods, M/M%
Durable Goods, M/M%
10:30 AM ET. EIA Weekly Natural Gas Storage Report
Working Gas In Storage (Cbf) (previous 2729B)
Working Gas In Storage, Net Chg (Cbf) (previous -91B)
12:00 AM ET. January Monthly U.S. Retail Chain Store Sales Index
4:30 PM ET. Federal Discount Window Borrowings
4:30 PM ET. Foreign Central Bank Holdings
Friday, February 3, 2023
8:30 AM ET. January U.S. Employment Report
Non-Farm Payrolls (previous +223K)
Unemployment Rate (previous 3.5%)
Avg Hourly Earnings (USD) (previous 32.82)
Avg Hourly Earnings-Net Chg (USD) (previous +0.09)
Avg Hourly Earnings, M/M% (previous +0.27%)
Avg Hourly Earnings, Y/Y% (previous +4.59%)
Overall Workweek (previous 34.3)
Overall Workweek Net Chg (previous -0.1)
Government Payrolls (previous +3K)
Private Payroll (previous +220K)
Participation Rate (previous 62.3%)
Non-Farm Payrolls Bench Net Chg
9:45 AM ET. January US Services PMI
PMI, Services (previous 44.7)
10:00 AM ET. January ISM Report On Business Services PMI
Services PMI (previous 49.6)
Business Activity Idx (previous 54.7)
Prices Idx (previous 67.6)
Employment Idx (previous 49.8)
New Orders Idx (previous 45.2)
11:00 AM ET. January Global Services PMI
PMI, Services (previous 48.1)
The STOCK INDEXES? http://quotes.ino.com/ex?changes/?c=indexes
The Dow closed slightly higher on Wednesday as it extended the rally off the January 20th low. The high-range close sets the stage for a steady to higher opening when Thursday's day session begins trading. Stochastics and the RSI are neutral to bullish signaling that sideways to higher prices are possible near-term. If the Dow extends the rally off the January 20th low, January's high crossing at 34,342.32 is the next upside target. If the Dow renews the decline off January's high, the December 22nd low crossing at 32,573.43 is the next downside target. First resistance is January's high crossing at 34,342.32. Second resistance is the December 13th high crossing at 34,712.28. First support is the January 5th low crossing at 32,812.33. Second support is the December 22nd low crossing at 32,573.43.
The March NASDAQ 100 closed sharply higher on Wednesday as it extends the rally off January's low. The high-range close sets the stage for a steady to higher opening when Thursday's day session begins trading. Stochastics and the RSI are overbought but remain neutral to bullish signaling sideways to higher prices are possible. If March extends the rally off January's low, the 62% retracement level of the August-October decline crossing at 12,624.66 is the next upside target. Closes below the 20-day moving average crossing at 11,631.02 would signal that a short-term top has been posted. First resistance is today's high crossing at 12,319.25. Second resistance is the 62% retracement level of the August-October decline crossing at 12,624.66. First support is the 10-day moving average crossing at 11,949.50. Second support is the 20-day moving average crossing at 11,631.02.
The March S&P 500 closed higher on Wednesday as it extends the rally off December's low. The high-range close sets the stage for a steady to higher opening when Thursday's day session begins trading. Stochastics and the RSI are overbought but remain neutral to bullish signaling that sideways to higher prices are possible near-term. If March extends the rally off December's low, the 75% retracement level of the August-October decline crossing at 4154.88 is the next upside target. Closes below the 20-day moving average crossing at 3992.56 would signal that a short-term top has been posted. First resistance is today's high crossing at 4124.50. Second resistance is the 75% retracement level of the August-October decline crossing at 4154.88. First support is the 10-day moving average crossing at 4041.00. Second support is the 20-day moving average crossing at 3992.49.
INTEREST RATES? http://quotes.ino.com/ex?changes/?c=interest ""
March T-bonds closed up 1-17-pts. at 131-13.
March T-bonds closed higher on Wednesday. The high-range close sets the stage for a steady to higher opening when Thursday's day session begins trading. Stochastics and the RSI are turning neutral to bullish signaling that sideways to higher prices are possible near-term. If March resumes the rally off December's low, the 62% retracement level of the August-October decline crossing at 133-30 is the next upside target. Closes below the 50-day moving average crossing at 128-30 would confirm that a short-term top has been posted. First resistance is the January 19th high crossing at 132-31. Second resistance is the 62% retracement level of the August-October-2022 decline crossing at 133-30. First support is the 20-day moving average crossing at 129-31. Second support is the 50-day moving average crossing at 128-30.
March T-notes closed up 280-pts. at 115.125.
March T-notes closed higher on Wednesday. The high-range close sets the stage for a steady to higher opening when Thursday's day session begins trading. Stochastics and the RSI are turning neutral to bearish signaling that sideways to higher prices are possible near-term. If December renews the rally off December's low, the 62% retracement level of the August-October-2022 decline crossing at 116.235 is the next upside target. Closes below the 50-day moving average crossing at 114.011 would signal that a short-term top has been posted. First resistance is January's high crossing at 116.080. Second resistance is the 62% retracement level of the August-October-2022 decline crossing at 116.235. First support is the 50-day moving average crossing at 114.011. Second support is the December 30th low crossing at 111.280.
ENERGY MARKETS? http://quotes.ino.com/ex?changes/?c=energy ""
March crude oil closed lower on Wednesday as it extended the decline off last-Friday's high. The low-range close sets the stage for a steady to lower opening when Thursday's day session begins. Stochastics and the RSI are neutral to bearish signaling that sideways to lower prices are possible near-term. Today's close below the 50-day moving average crossing at $77.69 confirms that a short-term top has been posted while opening the door for additional weakness into early-February.If March extends today's decline, the December-January uptrend line crossing near $74.97 is the next downside target. Closes above the 10-day moving average crossing at $79.85 would signal that a short-term low has been posted. If March renews the rally off January's low, December's high crossing at $83.14 is the next upside target. First resistance is December's high crossing at $83.14. Second resistance is the November 14th high crossing at $87.00. First support is today's low crossing at $76.05. Second support is the January 5thlow crossing at $72.74.
March heating oil closed sharply lower on Wednesday as it extends the decline off January's high. The low-range close sets the stage for a steady to lower opening when Thursday's day trading session begins. Stochastics and the RSI are neutral to bearish signaling that sideways to lower prices are possible near-term. Today's close below the December-January uptrend line crossing near $3.0000 signals that the intermediate-term trend has turned down. Closes above the 10-day moving average crossing at $3.2316 would signal that a short-term low has been posted. First resistance is the 10-day moving average crossing at $3.2316. Second resistance is January's high crossing at $3.4664. First support is January's low crossing at $2.8500. Second support is December's low crossing at $2.7047.
March unleaded gas closed sharply lower on Wednesday and below the 20-day moving average crossing at 2.4958 as it extended the decline off January's high. The low-range close sets the stage for a steady to lower opening when Thursday's day session begins trading. Stochastics and the RSI are neutral to bearish signaling that sideways to lower prices are possible near-term. If March extends the decline off January's high, the 50-day moving average crossing at 2.3664 is the next downside target. Closes above the 10-day moving average crossing at 2.5949 would signal that a short-term low has been posted. First resistance is the 10-day moving average crossing at 2.5949. Second resistance is January's high crossing at $2.7186. First support is the 50-day moving average crossing at 2.3664. Second support is January's low crossing at $2.2439.
March Henry natural gas closed lower on Wednesday as it extended the decline off September's high. The low-range close sets the stage for a steady to lower opening when Thursday's day session begins trading. Stochastics and the RSI are oversold but remain neutral to bearish signaling that sideways to lower prices are possible near-term. If March extends the decline off November's high, the December-2020 low on the monthly continuation chart crossing at 2.238 is the next downside target. Closes above the 20-day moving average crossing at 3.132 would signal that a short-term low has been posted. First resistance is the 20-day moving average crossing at 3.132. Second resistance is the 50-day moving average crossing at 4.470. First support is today's low crossing at 2.463. Second support is the December-2020 low on the monthly continuation chart crossing at 2.238.
CURRENCIES? http://quotes.ino.com/ex?changes/?c=currencies ""
The March Dollar closed lower on Wednesday and below the 75% retracement level of the January-September rally crossing at $101.331 marking a downside breakout of January's trading range. The low-range close sets the stage for a steady to lower opening when Wednesday's session begins trading. Stochastics and the RSI have turned neutral to bearish signaling that sideways to lower prices are possible near-term. If March extends the decline off September's high, the 87% retracement level of the January-September rally crossing at $99.229 is the next downside target. Closes above the 20-day moving average crossing at $102.216 would signal that a short-term low has been posted while opening the door for additional gains near-term. First resistance is the 20-day moving average crossing at $102.216. Second resistance is the 50-day moving average crossing at $103.637. First support is today's low crossing at $100.100. Second support is the 87% retracement level of the January-September rally crossing at $99.229.
The March Euro closed higher on Wednesday as it renewed the rally off September's low. The high-range close sets the stage for a steady to higher opening when Thursday's day session begins trading. Stochastics and the RSI are turning neutral to bullish signaling that sideways to higher prices are possible near-term. If March extends the rally off September's low, the 38% retracement level of the 2018-2022 decline crossing at $1.14137 is the next upside target. Closes below the 20-day moving average crossing at 1.08438 would signal that a short-term top has been posted. First resistance is today's high crossing at $1.10395. Second resistance is the 38% retracement level of the 2018-2022 decline crossing at $1.14137. First support is the 20-day moving average crossing at 1.08438. Second support is the 50-day moving average crossing at $1.06953.
The March British Pound closed sharply higher on Wednesday as it renewed the rally off September's low. The high-range close sets the stage for a steady to higher opening when Thursday's day session begins trading. Stochastics and the RSI are turning neutral to bullish signaling sideways to higher prices are possible near-term. If March extends the rally off January's low, the 62% retracement level of the 2021-2022 decline crossing at 1.2764 is the next upside target. Closes below the 50-day moving average crossing at 1.2200 would signal that a short-term top has been posted while opening the door for a possible test of the January 6th low crossing at 1.1867. First resistance is December's high crossing at 1.2479. Second resistance is the 62% retracement level of the 2021-2022 decline crossing at 1.2764. First support is the 20-day moving average crossing at 1.2285. Second support is the 50-day moving average crossing at 1.2200.
The March Swiss Franc closed sharply higher on Wednesday following yesterday's key reversal up. The high-range close sets the stage for a steady to higher opening when Thursday's day session begins trading. Stochastics and the RSI have turned neutral to bullish signaling that sideways to higher prices are possible near-term. If March resumes the rally off September's low, the 75% retracement level of the 2018-2022 decline crossing at 1.10351 is the next upside target. Closes below the 50-day moving average crossing at 1.08345 would signal that a short-term top has been posted. First resistance is January's high crossing at 1.10710. Second resistance is the 75% retracement level of the 2018-2022 decline crossing at 1.10351. First support is the 50-day moving average crossing at 1.08346. Second support is the January 6th low crossing at 1.06915.
The March Canadian Dollar closed higher on Wednesday as it extends the rally off January's low. The high-range close sets the stage for a steady to higher opening when Thursday's day session begins trading. Stochastics and the RSI are overbought but remain neutral to bullish signaling that sideways to higher prices are possible near-term. If March extends the rally off January's low, November's high crossing at 75.71 is the next upside target. Closes below the 50-day moving average crossing at 74.20 would confirm that a short-term top has been posted. First resistance is today's high crossing at 75.37. Second resistance is November's high crossing at 75.71. First support is the 50-day moving average crossing at 74.20. Second support is the January 19th low crossing at 73.99.
The March Japanese Yen closed higher on Wednesday. The high-range close sets the stage for a steady to higher opening when Thursday’s day session begins trading. Stochastics and the RSI are turning neutral to bullish signaling that sideways to higher prices are possible near-term. If March renews the rally off October's low, the May 24th -2021 high crossing at 0.080525 is the next upside target. Closes below the January 18th low crossing at 0.076550 would confirm that a short-term top has been posted while opening the door for additional weakness near-term. First resistance is the January 17th high crossing at 0.079190. Second resistance is the May 24th -2021 high crossing at 0.080525. First support is the January 18th low crossing at 0.076550. Second support is the January 6th low crossing at 0.074830.
PRECIOUS METALS? http://quotes.ino.com/ex?changes/?c=metals ""
April gold closed higher on Wednesday and posted a new high for the year as it extends the rally off November's low. The high-range close sets the stage for a steady to higher opening when Thursday's day session begins trading. Stochastics and the RSI are turning neutral to bullish signaling that sideways to higher prices are possible near-term. If April renews the rally off November's low, the 75% retracement level of the March-October decline crossing at $1978.50 is the next upside target. Closes below the 20-day moving average crossing at $1924.50 would signal that a short-term top has been posted while opening the door for additional weakness near-term. First resistance is today's high crossing at $1968.30. Second resistance is the 75% retracement level of the March-October decline crossing at $1978.50. First support is the 20-day moving average crossing at $1924.50. Second support is the 50-day moving average crossing at $1856.90.
March silver closed higher on Wednesday as it extends the December-January trading range. The high-range close sets the stage for a steady to higher opening when Thursday's day session begins trading. Stochastics and the RSI are turning neutral to bullish signaling that sideways to higher prices are possible near-term. If March renews the rally off October's low, the 87% retracement level of the March-August decline crossing at 25.995 is the next upside target. Closes below the 50-day moving average crossing at 23.330 would mark a downside breakout of the aforementioned trading range while opening the door for additional weakness near-term. First resistance is the 75% retracement level of the March-September decline crossing at 24.779. Second resistance is the 87% retracement level of the March-August decline crossing at 25.938. First support is the 50-day moving average crossing at 23.330. Second support is the December 12th low crossing at 22.735.
March copper closed lower on Wednesday. The high-range close sets the stage for a steady to slightly lower opening when Thursday's day session begins trading. Stochastics and the RSI are neutral to bearish signaling that sideways to lower prices are possible near-term. Closes below the 20-day moving average crossing at 4.1477 would signal that a short-term top has been posted. If March resumes the rally off September's low, the 75% retracement level of the March-July decline crossing at 4.4773 is the next upside target. First resistance is the January 18th high crossing at 4.3550. Second resistance is the 75% retracement level of the March-July decline crossing at 4.4773. First support is the 20-day moving average crossing at 4.1477. Second support is the 50-day moving average crossing at 3.9204.
GRAINS? http://quotes.ino.com/ex?changes/?c=grains "
March Corn closed up $0.01 1/4-cents at $6.81.
March corn closed higher on Wednesday. The high-range close sets the stage for a steady to higher opening when Thursday's night session begins trading. Stochastics and the RSI are overbought, diverging but remain neutral to bullish signaling that sideways to higher prices are possible near-term. If March renews the rally off January's low, the 75% retracement level of the October-December decline crossing at $6.92 1/2 is the next upside target. Closes below the 20-day moving average crossing at $6.70 3/4 would confirm that a short-term top has been posted. First resistance is the January 18th high crossing at $6.88 3/4. Second resistance is the 75% retracement level of the October-December decline crossing at $6.92 1/2. First support is the 20-day moving average crossing at $6.70 3/4. Second support is the 50-day moving average crossing at $6.64.
March wheat closed down $0.01 1/2-cents at $7.59 3/4.
March wheat closed lower on Wednesday as it consolidates some of the rally off January's low. The high-range close sets the stage for a steady to higher opening when Thursday's day session begins trading. Stochastics and the RSI are overbought but remain neutral to bullish signaling that sideways to higher prices are possible near-term. Closes above the October-November downtrend line crossing near $7.70 would signal that a short-term low has been posted while opening the door for a possible test of the December 30th high crossing at $7.99. If March renews this month's decline, the September 6th 2021 low crossing at $6.93 1/2 is the next downside target. First resistance is the October-November downtrend line crossing near $7.70. Second resistance is the December 30th high crossing at $7.99. First support is January's low crossing at $7.12 1/2. Second support is the September 6th 2021 low crossing at $6.93 1/2.
March Kansas City Wheat closed up $0.05 1/2-cents at $8.84 1/4.
March Kansas City wheat closed higher on Wednesday as it extends the rally off January's low. The high-range close sets the stage for a steady to higher opening when Thursday's day session begins trading. Stochastics and the RSI are overbought but remain neutral to bullish signaling that sideways to higher prices are possible near-term. If March extends the aforementioned rally, the December 27th high crossing at $8.94 3/4 is the next upside target. Closes below the 20-day moving average crossing at $8.44 3/4 would signal that a short-term top has been posted. If March renews the decline off December's high, the January 10th 2022 low crossing at $7.68 3/4 is the next downside target. First resistance is today's high crossing at $8.85. Second resistance is the December 27 high crossing at $8.94 3/4. First support is the January 23rd low crossing at $8.11. Second support is the January 10th low crossing at $8.03 1/4.
March Minneapolis wheat closed up $0.03 3/4-cents crossing at $9.26.
March Minneapolis wheat closed fractionally higher on Wednesday. The high-range close sets the stage for a steady to higher opening when Thursday's day session begins trading. Stochastics and the RSI are overbought but remain neutral to bullish signaling that sideways to higher prices are possible near-term. If March extends the rally off January's low, the 38% retracement level of the October-January decline crossing at $9.40 1/2 is the next upside target. Closes below the 20-day moving average crossing at $9.08 3/4 would signal that a short-term top has been posted. First resistance is today's high crossing at $9.28 1/2. Second resistance is the 38% retracement level of the October-January decline crossing at $9.40 1/2. First support is January's low crossing at $8.85. Second support is August's low crossing at $8.75 3/4.
SOYBEAN COMPLEX? http://quotes.ino.com/ex?changes/?c=grains "
March soybeans closed down $0.17 3/4-cents at $15.20 1/2.
March soybeans closed lower on Wednesday as it consolidated some of the rally off the January 25th low. The low-range close sets the stage for a steady to lower opening when Thursday's day trade begins. Stochastics and the RSI are neutral to bullish signaling that sideways to higher prices are possible near-term. If March renews this month's rally. last-June's high crossing at $15.72 1/4 is the next upside target. Closes below the 20-day moving average crossing at $15.07 1/2 would signal that a short-term top has been posted. First resistance is the January 18th high crossing at $15.48 1/2. Second resistance is last-June's high crossing at $15.72 1/4. First support is the 20-day moving average crossing at $15.07 1/2. Second support is the 50-day moving average crossing at $14.86 1/4.
March soybean meal closed up $0.50 at $484.70.
March soybean meal closed slightly higher on Wednesday. The mid-range close sets the stage for a steady to higher opening when Thursday's day session begins trading. Stochastics and the RSI are overbought but remain neutral to bullish signaling that sideways to higher prices are possible near-term. If March extends the rally off Monday's low, the March-21st-high on the monthly continuation chart crossing at $494.70 is the next upside target. Closes below the 20-day moving average crossing at $473.30 would signal that a short-term top has been posted. First resistance is Monday's high crossing at $490.30. Second resistance is the March-21st-high on the monthly continuation chart crossing at $494.70. First support is the 20-day moving average crossing at $473.30. Second support is January's low crossing at $452.80.
March soybean oil closed down 154-pts. At 60.79.
March soybean oil closed sharply lower on Wednesday. The low-range close sets the stage for a steady to lower opening when Thursday's day session begins trading. Stochastics and the RSI are turning neutral to bearish signaling that sideways to lower prices are possible near-term. If March renews the decline off the December 27th high, December's low crossing at 58.50 is the next downside target. Closes above the 20-day moving a crossing at 62.26 would signal that a short-term low has been posted. First resistance is the 20-day moving average crossing at 62.26. Second resistance is the 50-day moving average crossing at 64.00. First support is last-Friday's low crossing at 59.90. Second support is December's low crossing at 58.50.
LIVESTOCKhttp://quotes.ino.com/exchanges/?c=livestock
April hogs closed down $1.90 at $84.53.
April hogs closed lower on Wednesday as it extended the decline off December's high. The mid-range close sets the stage for a steady to lower opening when Thursday's day session begins trading. Stochastics and the RSI are turning neutral to bearish with today's loss signaling that sideways to lower prices are possible near-term. If April extends the decline off December's high, October's low crossing at $82.63 is the next downside target. Closes above the 20-day moving average crossing at $87.44 would signal that a short-term low has been posted. First resistance is the 20-day moving average crossing at $87.44. Second resistance is the January 17 high crossing at $89.08. First support is today's low crossing at $82.75. Second support is October's low crossing at $82.63.
April cattle closed down $0.85 at $162.17.
April cattle closed lower due to profit taking on Wednesday as it consolidated some of Monday's rally. The low-range close sets the stage for a steady to lower opening on Thursday. Stochastics and the RSI are overbought but remain neutral to bullish signaling that sideways to higher prices are possible near-term. If April extends the rally off January's low, the November-2014 on the monthly continuation chart crossing at $171.65 is the next upside target. Closes below the 50-day moving average crossing at $160.36 would signal that a short-term top has been posted. First resistance is Tuesday's high crossing at $163.58. Second resistance is the November-2014 on the monthly continuation chart crossing at $171.65. First support is the 20-day moving average crossing at $161.12. Second support is the 50-day moving average crossing at $160.36.
March Feeder cattle closed down $2.93 at $183.23.
March Feeder cattle closed sharply lower on Wednesday as it consolidates some of the rally off January's low. The low-range close sets the stage for a steady to lower opening when Thursday's day session begins trading. Stochastics and the RSI are neutral to bullish signaling that sideways to higher prices are possible near-term. If March extends the rally off January's low, January's high crossing at $187.28 is the next upside target. Closes below the 10-day moving average crossing at $183.13 would signal that a short-term top has been posted. First resistance is the January 10th high crossing at $187.28. Second resistance is January's high crossing at $188.75. First support is the 10-day moving average crossing at $183.13. Second support is January's low crossing at $179.18.
FOOD & FIBERhttp://quotes.ino.com/ex changes/?c=food
March coffee closed lower on Wednesday as it consolidated some of the rally off January's low. The low-range close sets the stage for a steady to lower opening on Thursday. Stochastics and the RSI are overbought but remain neutral to bullish signaling sideways to higher prices are possible near-term. If March extends the rally off January's low, the 50% retracement level of the August-January decline crossing at $18.92 is the next upside target. Closes below the 20-day moving average crossing at $15.98 would signal that a short-term top has been posted. First resistance is today's high crossing at $18.42. Second resistance is the 50% retracement level of the August-January decline crossing at $18.92. First support is the 20-day moving average crossing at $16.33. Second support is the 50-day moving average crossing at $15.98.
March cocoa closed higher on Wednesday. The low-range close sets the stage for a steady to lower opening on Thursday. Stochastics and the RSI are turning neutral to bearish signaling that sideways to lower prices are possible near-term. Closes below the 50-day moving average crossing at 25.58 would signal that a short-term top has been posted. If March extends the aforementioned rally, the January 17th high crossing at 26.75 is the next upside target.
March sugar closed lower on Wednesday ending a six-day rally but not before posting a new contract high. The low-range close sets the stage for a steady to lower opening on Thursday. Stochastics and the RSI are overbought but remain neutral to bullish signaling that sideways to higher prices are possible near-term. If March extends the rally off January's low, monthly resistance crossing at 22.64 is the next upside target. Closes below the 20-day moving average crossing at 20.03 would signal that a short-term top has been posted.
March cotton closed slightly lower on Wednesday as it extends the November-January trading range. The low-range close sets the stage for a steady to lower opening on Thursday. Stochastics and the RSI are neutral to bearish signaling that sideways to lower prices are possible near-term. Closes below the 50-day moving average crossing at 83.65 would signal that a short-term top has been posted. Closes above the November 16th high crossing at 89.92 would mark a potential upside breakout of the November-January trading range while opening the door for a possible test of the 50% retracement level of the August-October decline crossing at 93.31.
Thanks tallpine!
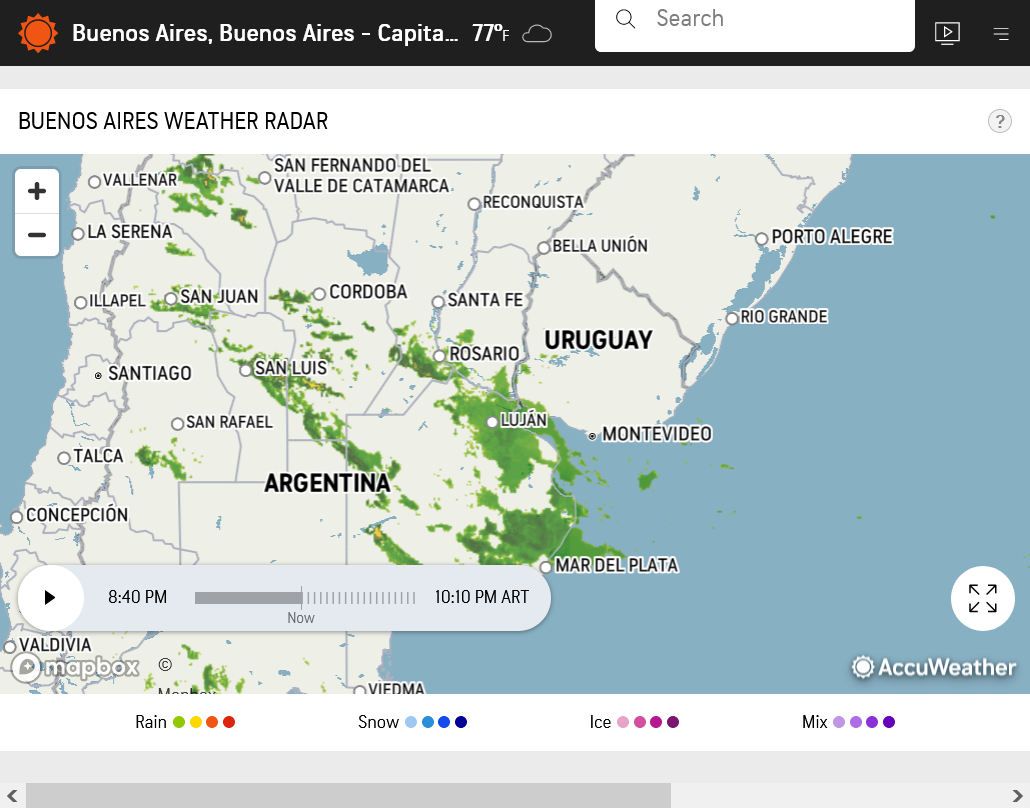
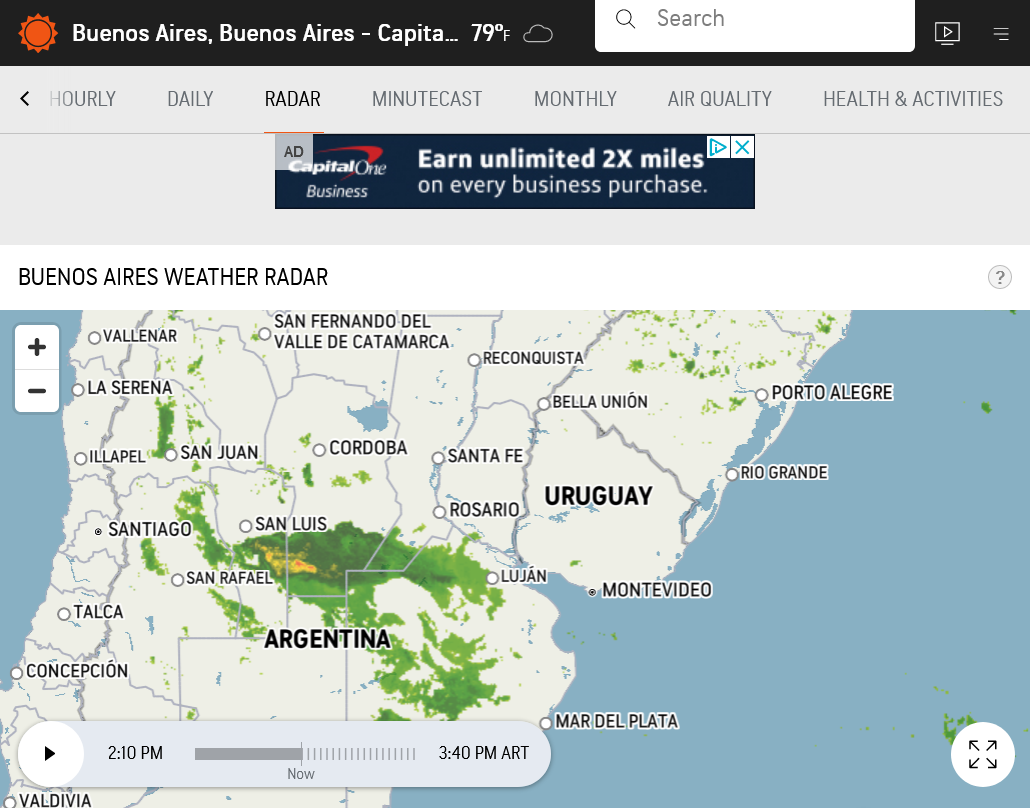
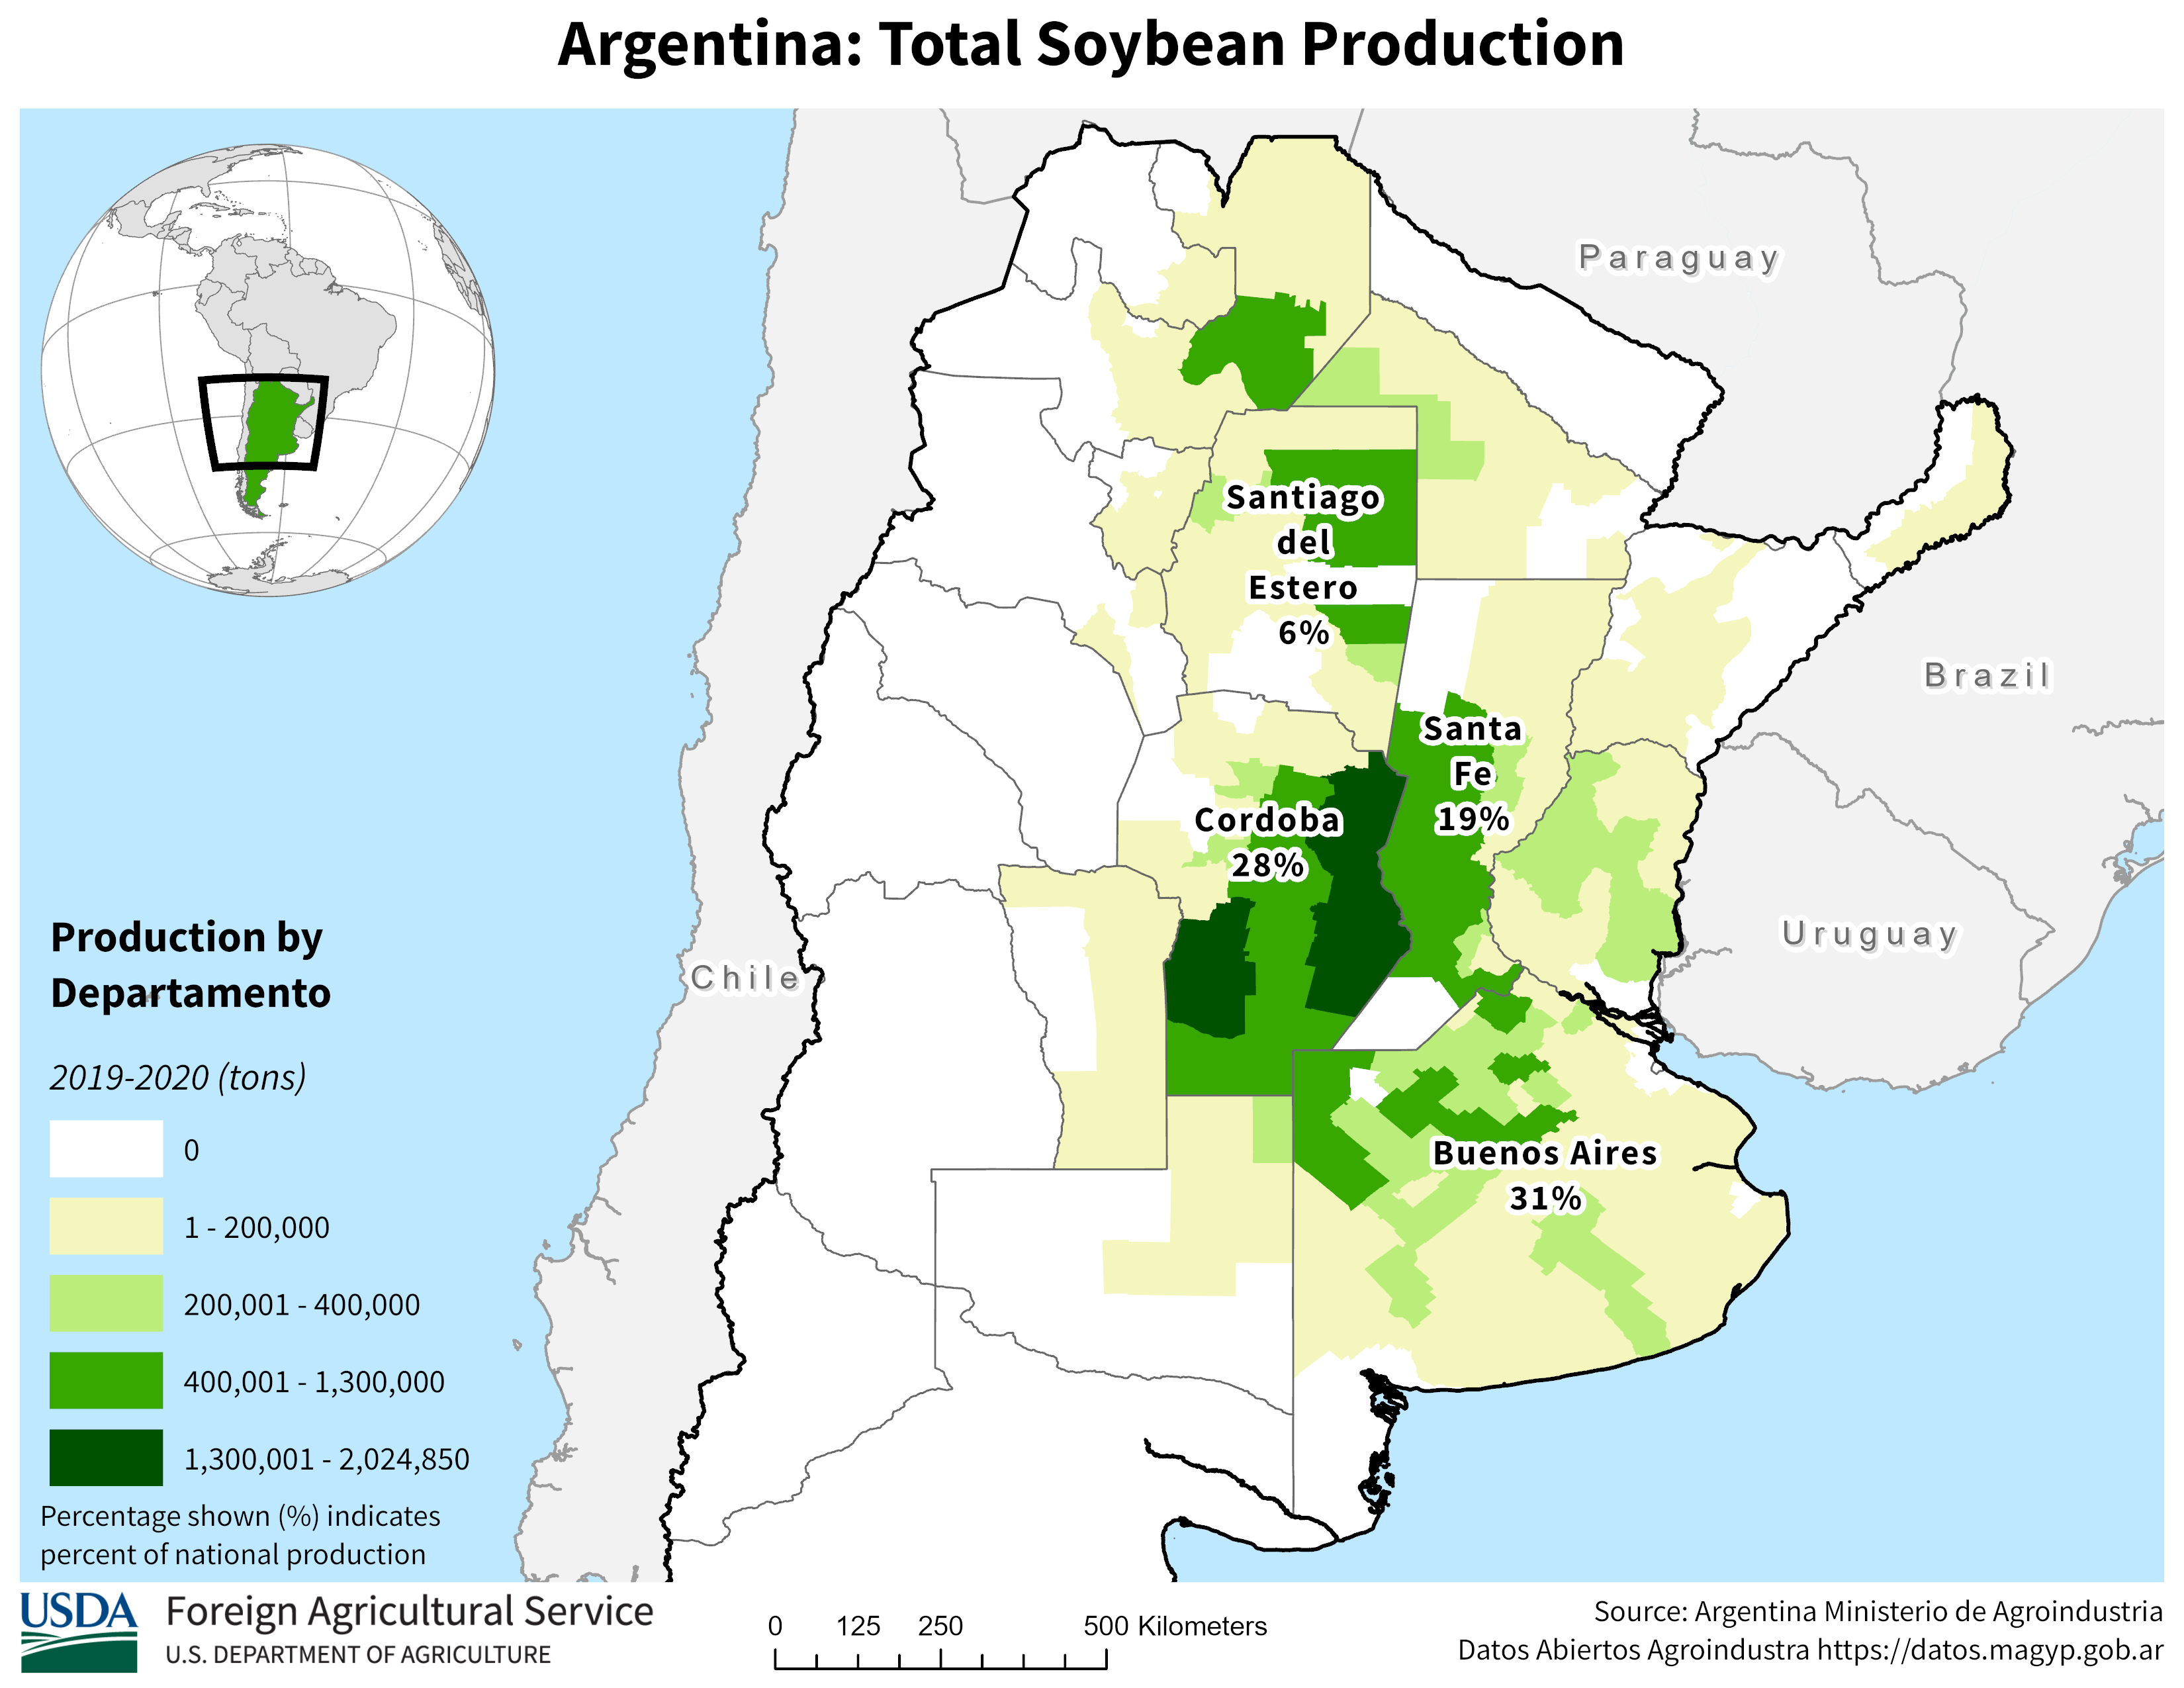
Big rains in key soybean-land of Argentina that erupted on the radar early this morning were a big factor that pressured beans.
Latest radar image below. 2nd radar image was the mid day rain event.
NG got decimated to new lows from mild weather forecasts continuing in the high population, high ng residential demand/usage areas of the East/Midwest thru mid February.
https://www.cpc.ncep.noaa.gov/products/predictions/814day/index.php

Big rains from earlier are diminishing in Argentina. The next rain event will be almost 10 days from now.
It's getting late in the season for weather to have a huge impact in most areas.