Previous thread here:
https://www.marketforum.com/forum/topic/91385/
Here's the temps for the EIA report released last Thursday at 9:30 am CST:
for week ending December 30, 2022 | Released: January 5, 2023 at 10:30 a.m. | Next Release: January 12, 2023
++++++++++++++++++++++++ -221 BCF, quite a bit less than you thought, Larry.
Interesting to note the blue line on the graph below diving lower and separating from the 5 year average in what would ordinarily be a bullish, fundamental storage signature.
Storage now is now -208 BCF lower than the 5 year average and -308 BCF vs storage last year and it did almost all of that in just 2 weeks(from extreme cold).
Why has the market been crashing lower, breaking out to the downside?
Because natural gas, like most futures markets is LOOKING AHEAD.
The pattern change to MUCH milder has been crystal clear since well before the extreme cold of December was over.
2022 featured huge draws thru late Winter.
2023 will feature much smaller draws.
The deficit in storage will quickly become a surplus with supplies gushing in as the La Nina is rapidly dying and a mild, beneficial El Nino type weather regime is taking over.
This warming in the Pacific Ocean temps will feature heat belching out and a resumption of the slight global warming pattern that had paused during the cooling La Nina.
https://www.marketforum.com/forum/topic/91060/#91893
++++++++++++++++++++++++
| Working gas in underground storage, Lower 48 states Summary textCSVJSN | |||||||||||||||||||||||||
|---|---|---|---|---|---|---|---|---|---|---|---|---|---|---|---|---|---|---|---|---|---|---|---|---|---|
| Historical Comparisons | |||||||||||||||||||||||||
| Stocks billion cubic feet (Bcf) | Year ago (12/30/21) | 5-year average (2017-21) | |||||||||||||||||||||||
| Region | 12/30/22 | 12/23/22 | net change | implied flow | Bcf | % change | Bcf | % change | |||||||||||||||||
| East | 691 | 747 | -56 | -56 | 768 | -10.0 | 740 | -6.6 | |||||||||||||||||
| Midwest | 839 | 899 | -60 | -60 | 897 | -6.5 | 876 | -4.2 | |||||||||||||||||
| Mountain | 157 | 166 | -9 | -9 | 173 | -9.2 | 173 | -9.2 | |||||||||||||||||
| Pacific | 165 | 165 | 0 | 0 | 221 | -25.3 | 247 | -33.2 | |||||||||||||||||
| South Central | 1,040 | 1,136 | -96 | -96 | 1,139 | -8.7 | 1,063 | -2.2 | |||||||||||||||||
| Salt | 270 | 323 | -53 | -53 | 344 | -21.5 | 317 | -14.8 | |||||||||||||||||
| Nonsalt | 770 | 813 | -43 | -43 | 795 | -3.1 | 747 | 3.1 | |||||||||||||||||
| Total | 2,891 | 3,112 | -221 | -221 | 3,199 | -9.6 | 3,099 | -6.7 | |||||||||||||||||
Working gas in storage was 2,891 Bcf as of Friday, December 30, 2022, according to EIA estimates. This represents a net decrease of 221 Bcf from the previous week. Stocks were 308 Bcf less than last year at this time and 208 Bcf below the five-year average of 3,099 Bcf. At 2,891 Bcf, total working gas is within the five-year historical range.
For information on sampling error in this report, see Estimated Measures of Sampling Variability table below.

By tjc - Jan. 5, 2023, 1:39 p.m.
Today's action appears to be a washout low.
26 weeks since last low, but a few days early on daily cycle, nevertheless I will buy tonight.
++++++++++++++++++++
By metmike - Jan. 5, 2023, 2:49 p.m.
Great to hear from you tjc, Happy New Year!
The price has plunged below fair value........unless of course we're about to have a major recession that will also cut industrial demand, besides the huge drop in residential demand from lack of cold the next 2 weeks.
This is what happened to natural gas in late 2008/early 2009.
However, the US now has huge exports that were not there just a few years ago and like crude oil is more of a global market than it was then. Those exports can soak up alot of extra supply and our ng price right now, outside of the Middle East is probably the cheapest in the world by a wide margin.
++++++++++++++++
By coffeeclotch - Jan. 5, 2023, 3:52 p.m.
definitely oversold...any specific support levels met mike?
++++++++++++++++++++++++
By WxFollower - Jan. 5, 2023, 6:01 p.m.
Mike,
Yep, clearly a bearish number considering the 24 more HDDs and 73 more freeze offs vs the prior week. As often is the case, the holiday slowdown effect is very hard to predict. That very well may be why today's draw was so low vs expectations. Who knows?
++++++++++++++++++++
By tjc - Jan. 5, 2023, 7:52 p.m.
Buy Stop Limit ngh 3.471 or 344.6 whichever comes first (buying 'breakout' after first hour)
Technical picture for NG as you requested coffee: analysis is above charts below.
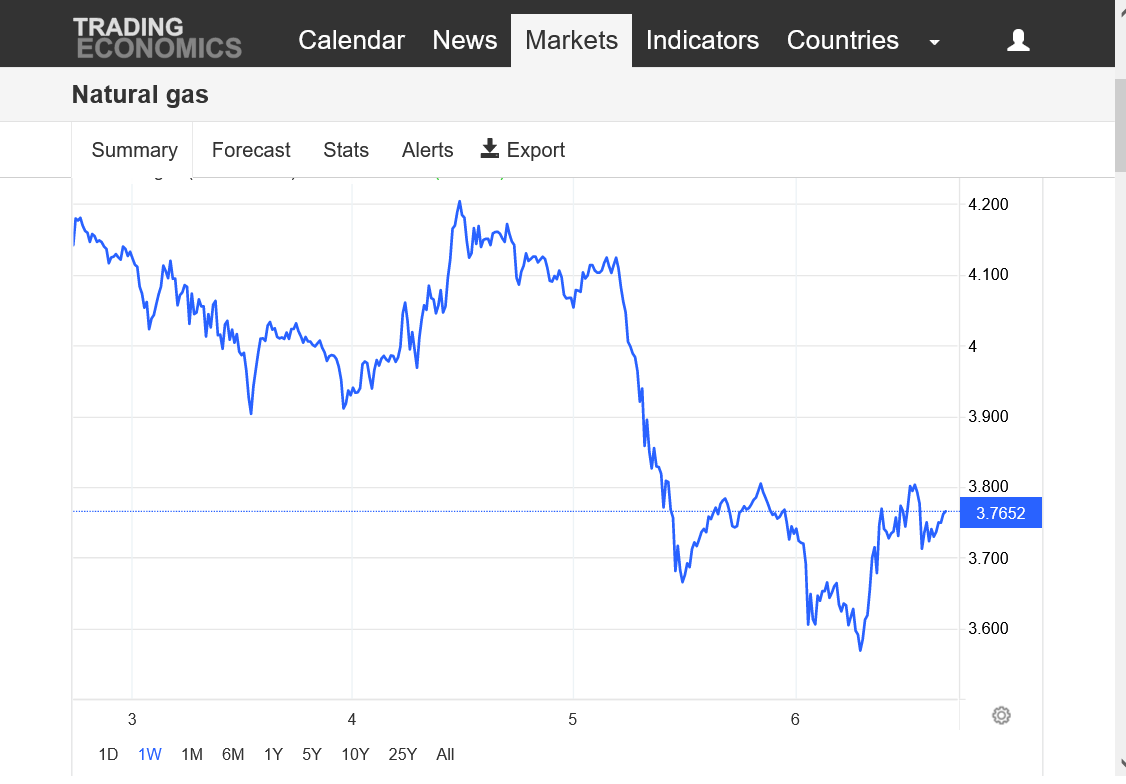
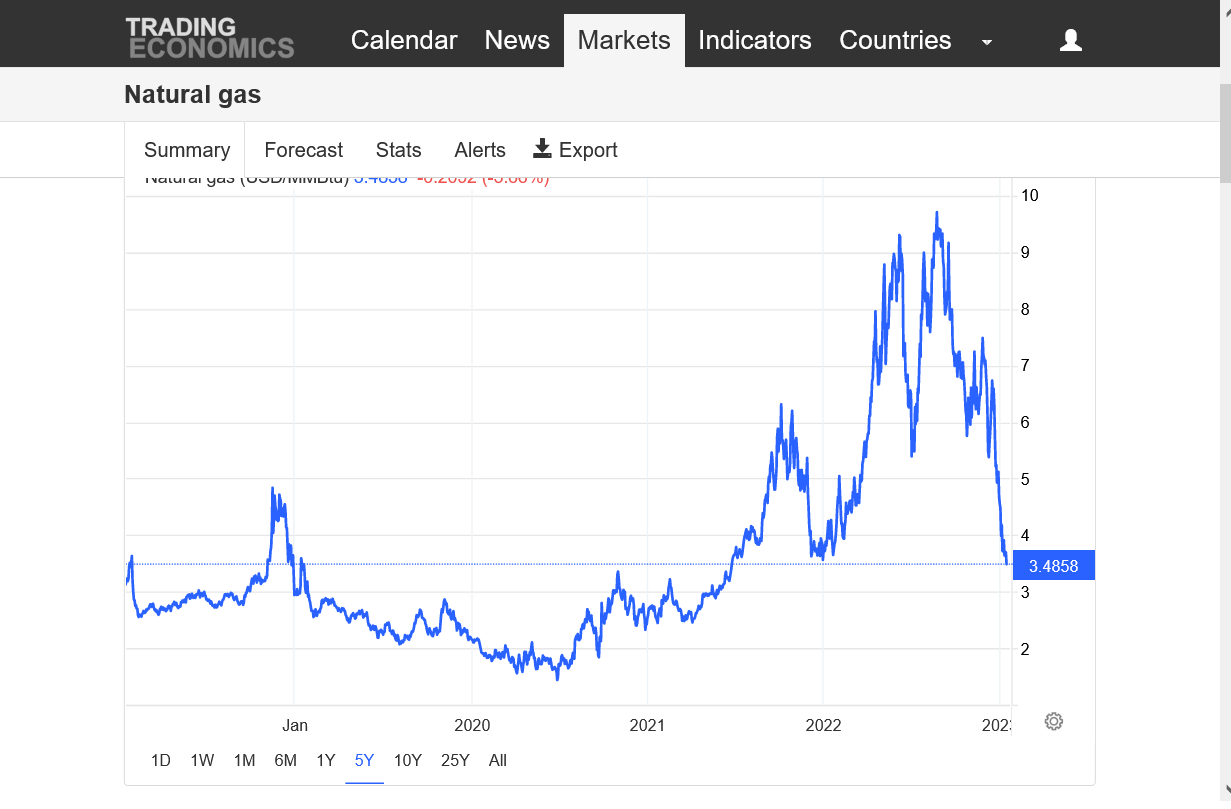
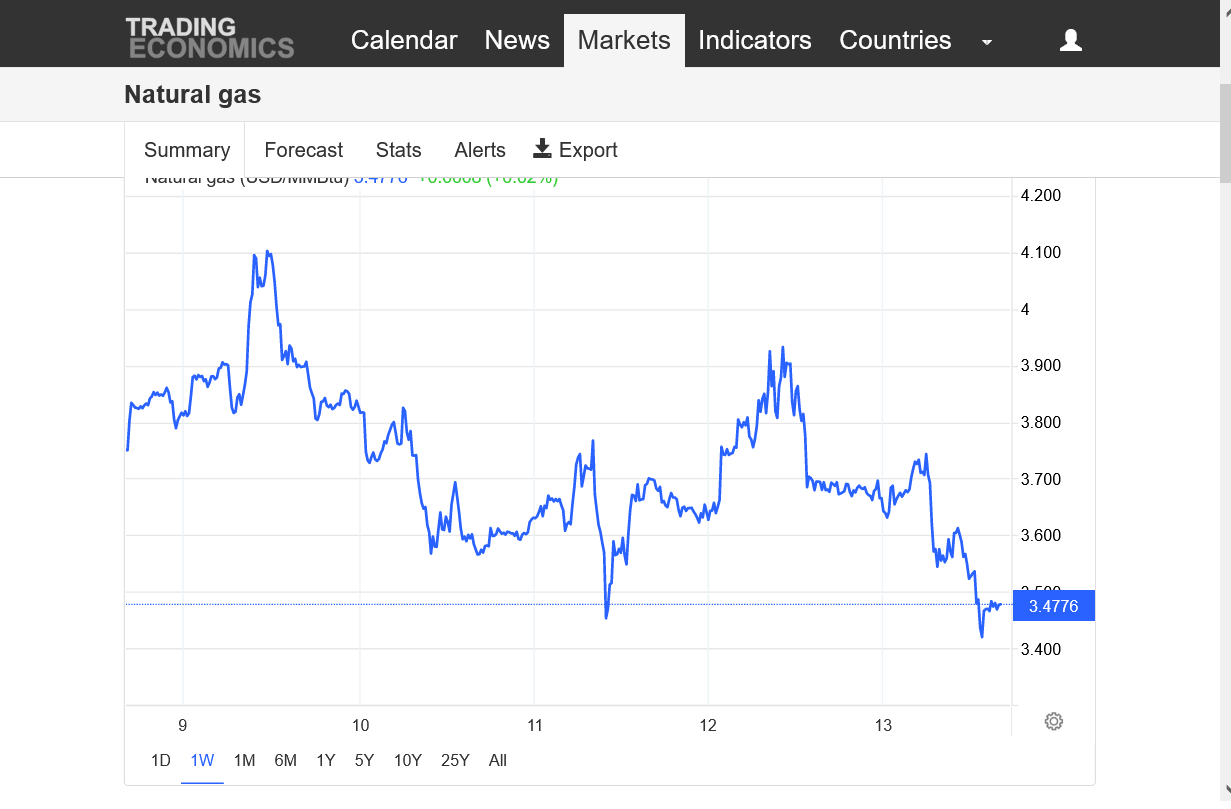
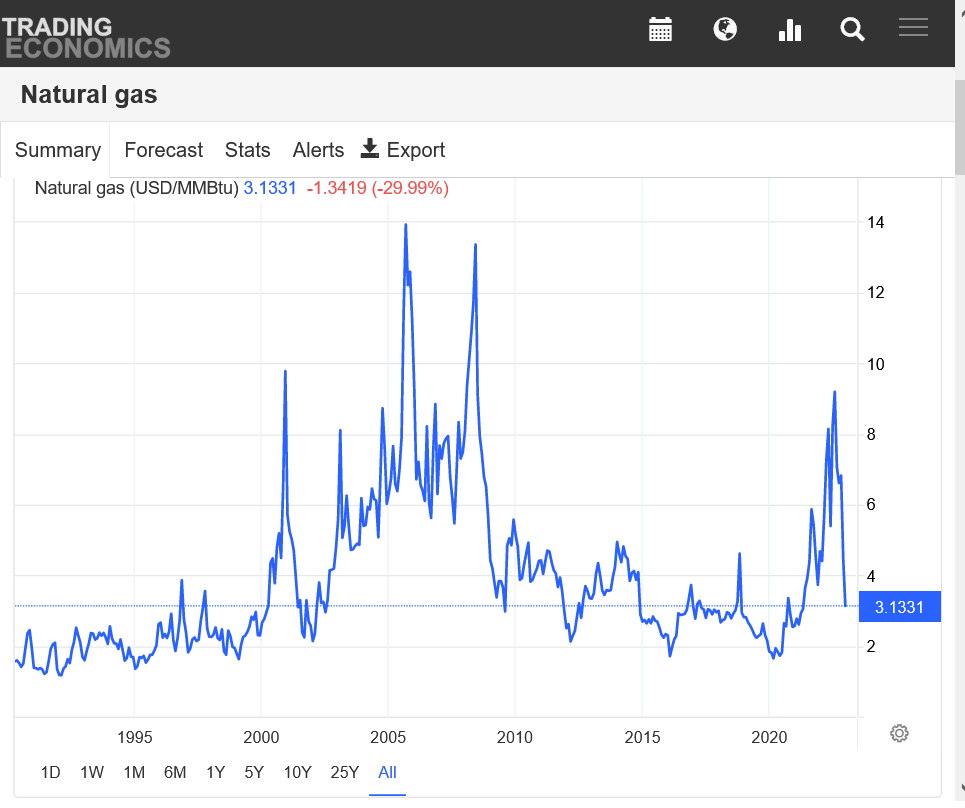
https://tradingeconomics.com/commodity/natural-gas
Huge spike higher to near $10 this past Summer (highest in well over a decade) after gas in storage was drawn down by the previous Winters cold(early 2022) and something like 300 BCF BELOW the 5 year average in storage.
This happened after COVID did just the opposite in 2020 and resulted in a 2 decade low from a huge storage surplus and a price just below $2 and a double bottom. 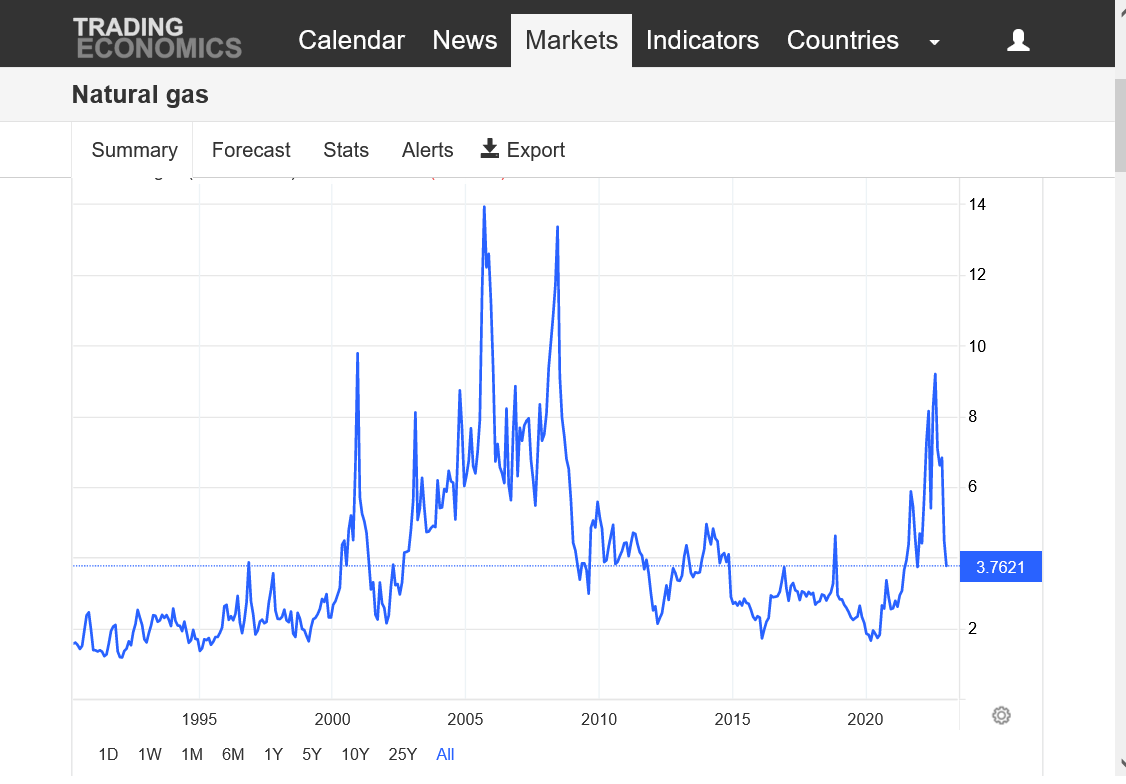
++++++++
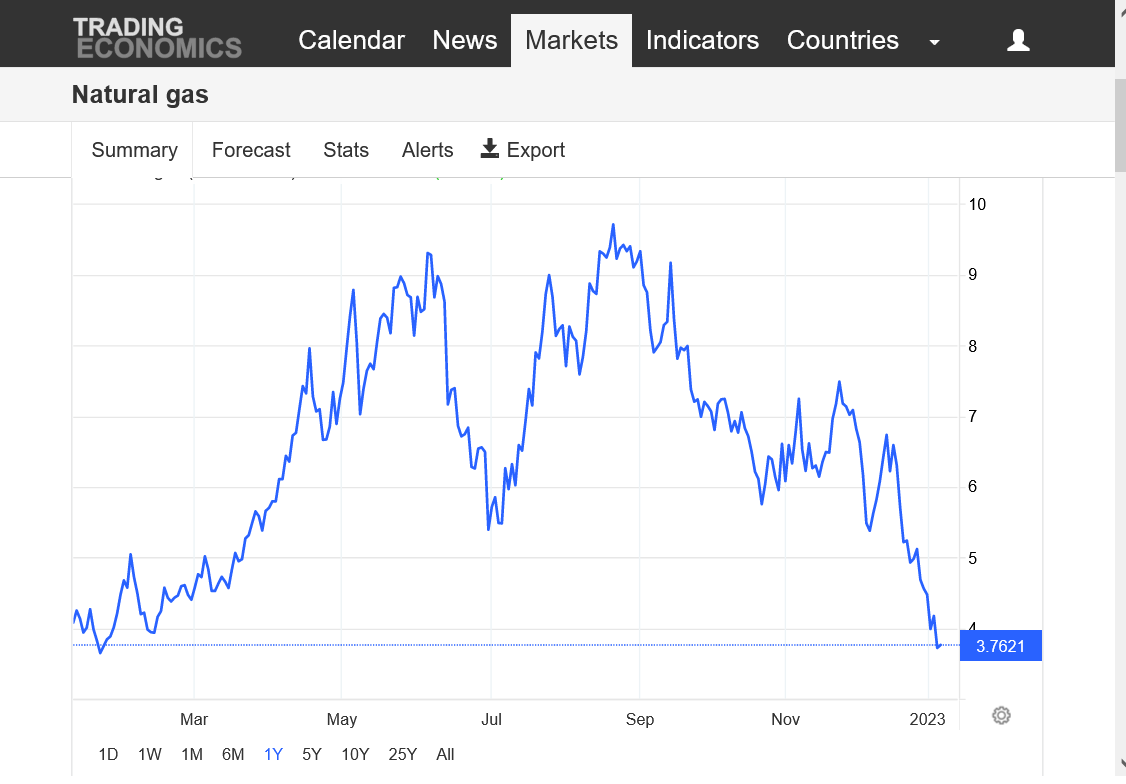
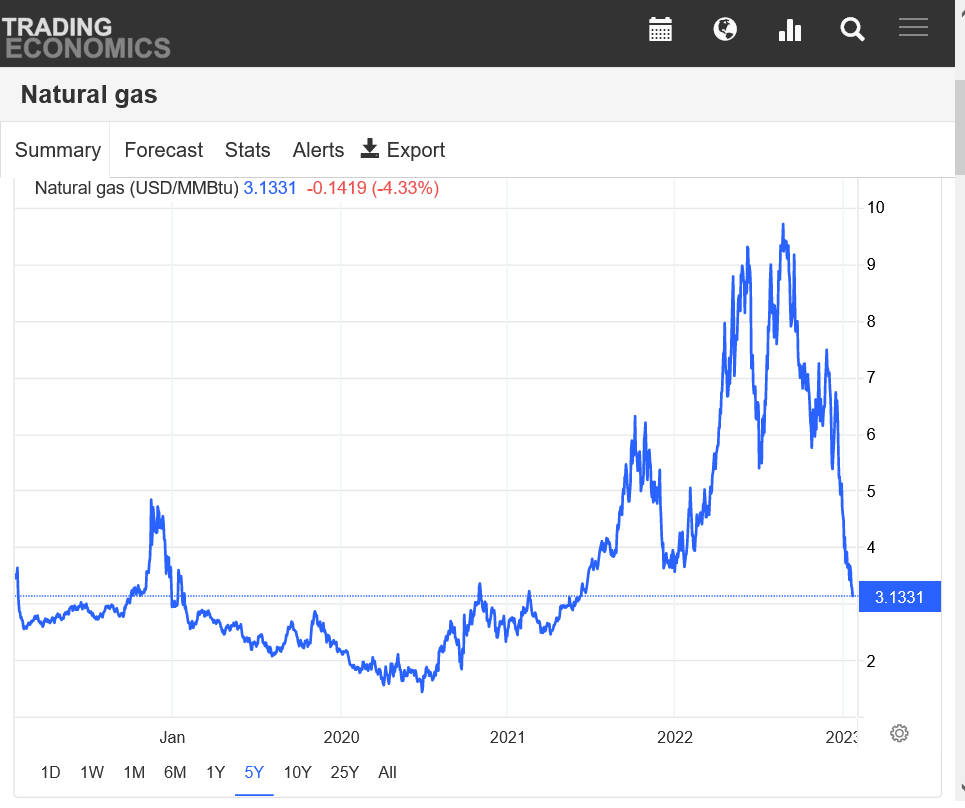
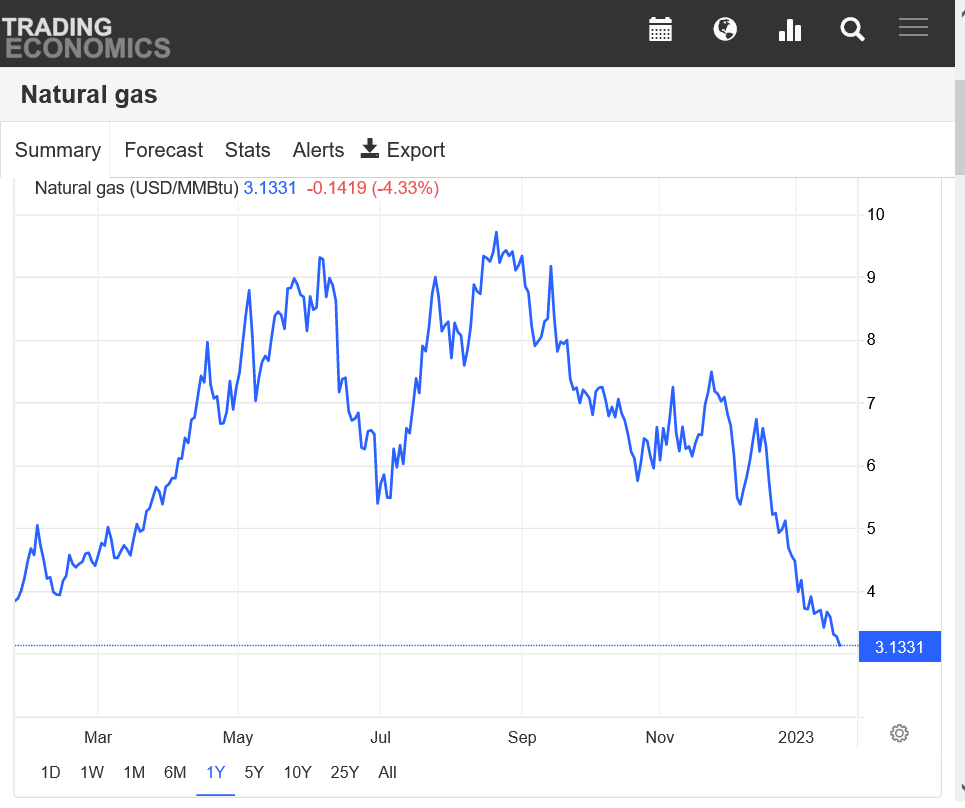
1 year=Spike high in June, then another slightly higher high in September to form a clear double top signature. after that we saw a the record high injections and fastest closing of a storage deficit in history. Roughly +300 BCF vs the 5 year average in just 3 months.
Serious cold in November caused a pause in the price plunge with a bear flag formation, which is a continuation signal, confirmed when the support at the base is broken. This has been so extremely bearish, that the 2 week, near record cold Siberian blast in December hardly shows up as nothing more than a tiny 1 week blip higher.
+++++++-
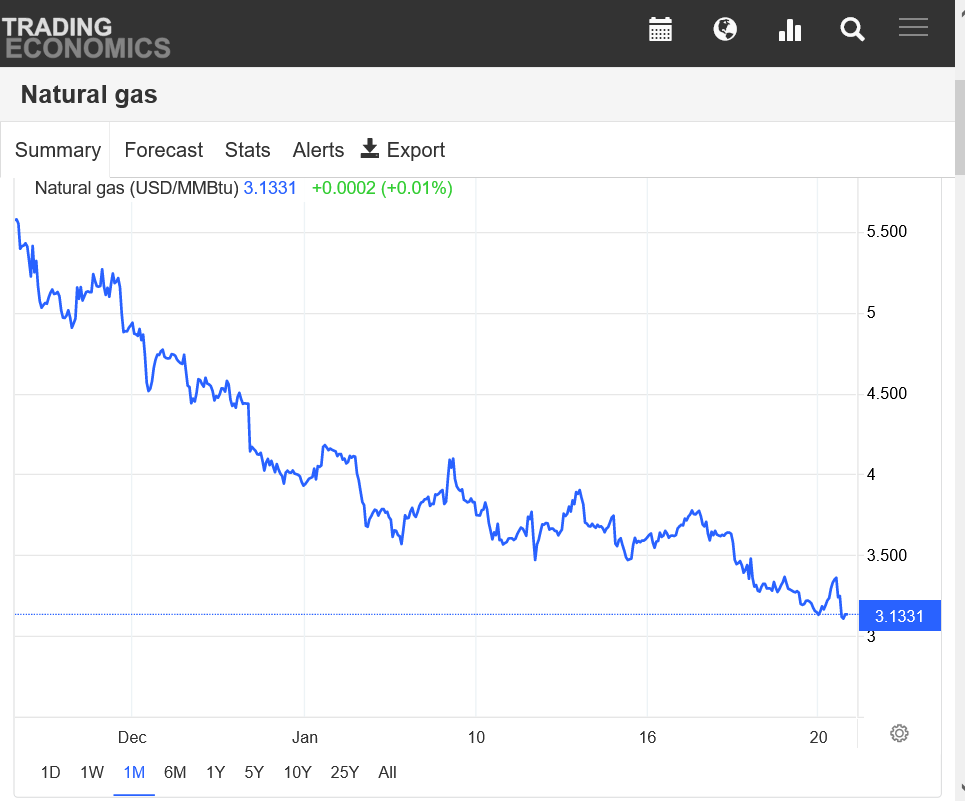
1 month=Despite extreme cold at the start of this period, natural gas was only in a pause mode with the market looking ahead to much milder weather and a resumption of very small drawdowns coming up later in January. Perfect example of a market looking way ahead. We crashed thru support and broke out to the downside even before the extreme cold had retreated.
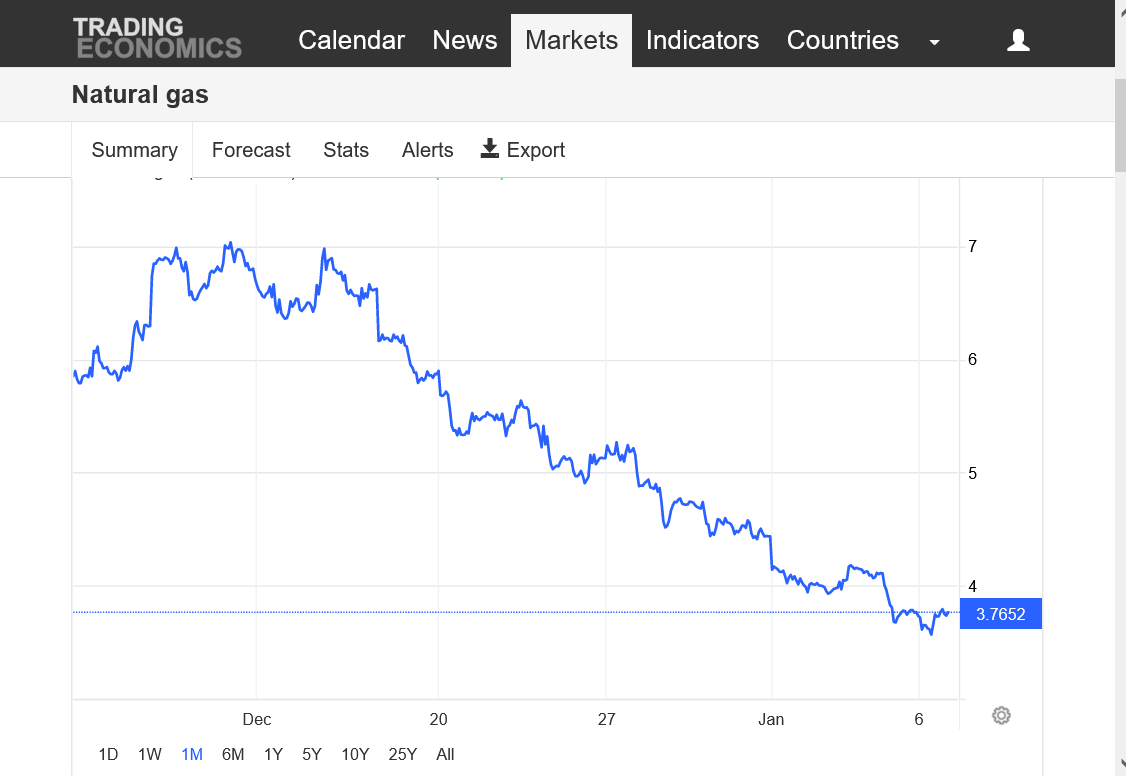
+++———-
The crash continued this short trading week with a bit of a dead cat bounce on Wednesday ahead of the expected huge EIA drawdown on Thursday, which was the day of the biggest drop.
Friday featured a spike low to a low for the move but then a recovery and a close near unchanged and near the highs. tjc was expecting a low. That looks possible. this is an ideal buying set up but mainly if the wx forecast turns colder.
VERY good technical summary MetMike.
Appears NG has established a low.
(I may have a winner)
Thanks tjc,
We have a major weather pattern change coming to colder and natural gas is reacting strongly to the upside today.
Congrats on picking the bottom last week! More shortly
The question is how much colder will it be? If it was definitively much colder, ng would have closed near the highs. Instead we closed closer to the lows.
This is a snapshot of all the GEFS solutions at 2 weeks:
http://www.meteo.psu.edu/fxg1/ENSHGT_12z/f384.gif
Canadian model ensembles for same time frame:
https://weather.gc.ca/ensemble/charts_e.html?Hour=384&Day=0&RunTime=12&Type=gz
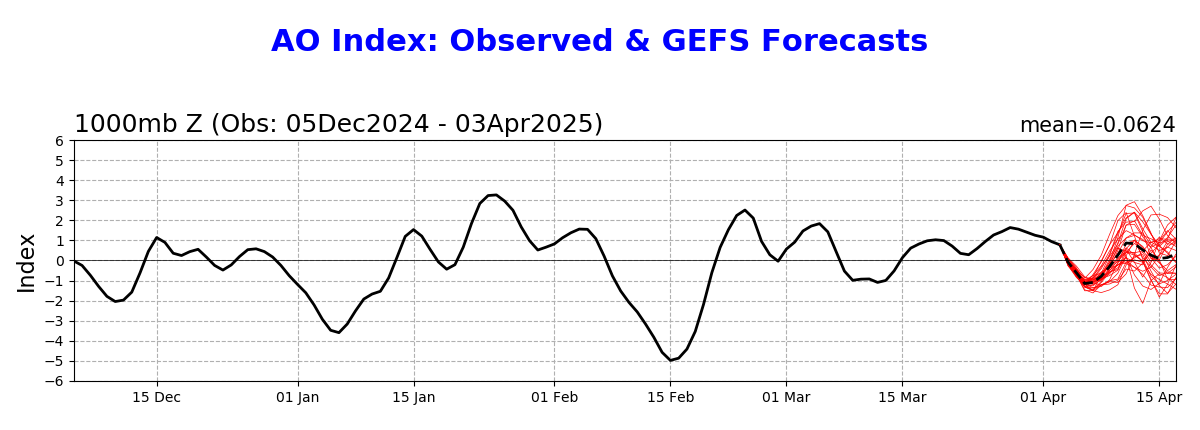
A continued -AO,
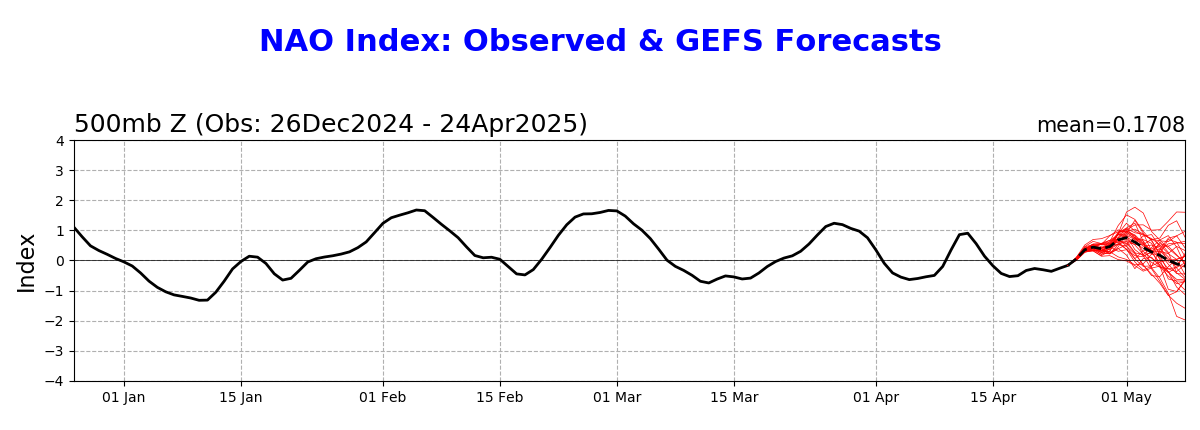
A falling NAO(to near 0)
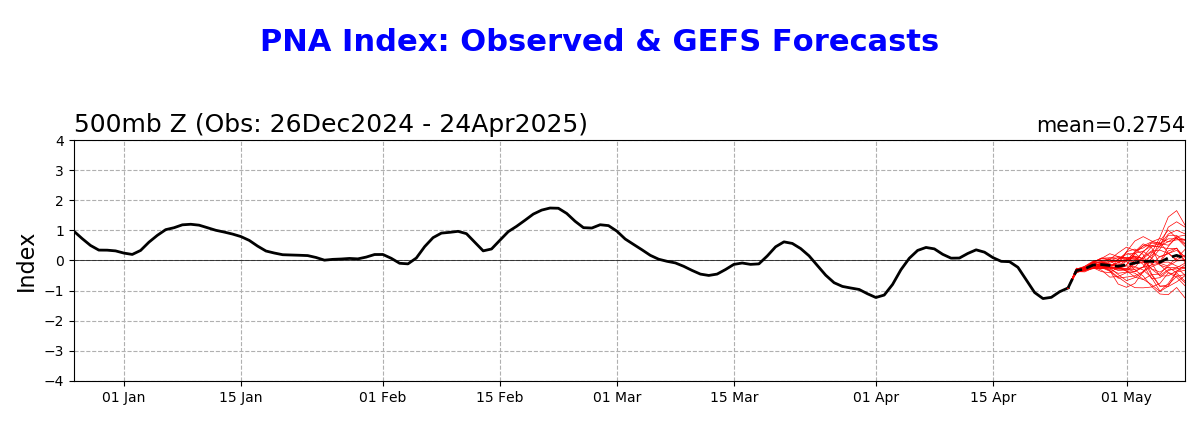
and a rising PNA(to near 0) as seen below, favors colder but at first, this is more of a less mild brand of cold. Will that get even colder with time?
Arctic Oscillation Index, North Atlantic Oscillation Index, Pacific North American Index.
https://www.cpc.ncep.noaa.gov/products/precip/CWlink/daily_ao_index/ao.shtml
https://www.cpc.ncep.noaa.gov/products/precip/CWlink/pna/nao.shtml
https://www.cpc.ncep.noaa.gov/products/precip/CWlink/pna/pna.shtml
++++++++++++++++++++++++++++++++++++++++++++
GFS ensemble mean anomalies at 2 weeks.
https://www.psl.noaa.gov/map/images/ens/z500anom_nh_alltimes.html
2 week 850 temp for ensemble mean anomaly
https://www.psl.noaa.gov/map/images/ens/t850anom_nh_alltimes.html
Negatives at the moment are seasonals, especially the front months. Prices bottom first in the back months early in the year when there isn't a precariously low storage situation or extreme cold.
At least 3 very small injections ahead(we dialed much of that in last week).
Supplies have been gushing in greater than expected, with numerous bearish EIA reports since August 2022. We caught up from a -300 BCF deficit in just over a couple of months last Fall.
Is the economy slowing?
How much are gas co. making. NG came down and my bill from Nicor gas for the home came down zero percent
Hi bcb,
The natural gas that you used for this last bill was purchased a very long time ago.
Some could have been hedged/bought to cover needs when prices were the highest last Summer and the highest in well over a decade (many states have laws that require a utility to be X% covered) and your provider actually lost money during the period of your usage.
My bills went up 120% in sept and I got off the budget plan and now pay monthly usage. Still $369 this month. I saved $120
Thanks for sharing that bcb!
There are dozens of different plans and methods for a utility to hedge and sell their products that I'm not familiar with and am just generally speaking.
The really smart utilities, during the 2020 energy price crash lower would have hedged as much as they could for as far as they could.
Of course the contracts and deals that are greatly deferred years down the road likely didn't drop that much, even when the front month of NG dropped below $2......lowest in over 20 years!
They have people that do that for a living. Any utilities not taking advantage of that once in a lifetime opportunity should have fired the person making those decisions.
https://bv.com/perspectives/utilities-turn-fuel-hedging-reduce-price-risk
In December 2000, when ng prices spiked to $10 here, our utility and many others were not covered/hedged. Since they were playing it hand to mouth and supplies everywhere were short (that's why we had the record high price spike) they bought a massive amount right at the high.
This type of panic buying at the highs actually caused the spike higher to be even worse.
After that, there were changes made to the laws to protect consumers that required Indiana utilities and elsewhere to hedge X amount to be covered in order to prevent the same thing from repeating.
Here's more:
https://pubs.naruc.org/pub/FA85AD81-D8A3-720E-F2E2-4A2680EB32E9
USE OF HEDGING BY LOCAL GAS DISTRIBUTION COMPANIES
EXECUTIVE SUMMARY
An unexpected price spike of staggering proportions pushed the
average price of natural gas for the winter of 2000-2001 to a new plateau,
more than double the average price of the previous winter. Largely
because of low storage levels and extreme weather conditions, spot gas
prices rose to the $9-10 per MMBtu range in December and January.
Needless to say, the volatile nature of natural gas prices has had a
discomforting effect on consumers and utilities alike.
After reading the 80 page document above, there will be a quiz later (-:
Actually its just for everybody to appreciate the dynamics of the evolving ng market in time and changes to laws to prevent utilities from being vulnerable to extreme price spikes when they've not covered their supply needs to satiate customer demand.
Weather models are pretty similar to previous runs with the likelihood of a pattern change to colder later this month.
Wide disparity on the cold. Some models very cold, many have a pattern that more of a less mild weather.
It seems likely that we need models to get colder and colder to support ng here as its down almost $2,000/contract from close Monday and $4,000 from the highs Monday.
At 1am, we dropped over $1,000 in less than a minute from guidance that wasn't much different but NOT getting colder.
6z GEFS was a bit more zonal, a couple more solutions that have the mild Pacific flow deflecting the Arctic northern stream but still some very cold ones.
With the rapidly dying La Nina, the models may be having a tough time dialing in the much stronger flow coming from the rapidly warming tropical Pacific Ocean water(from this entirely natural cause).
NG is collapsing Back to last weeks lowsand the lows from just over a year ago and HUGE support.
TJC, I was going to suggest putting a sell stop in to protect nice profits on Monday but you've been doing this for decades and have your own strategies well tuned.
There's no doubt though, that the early week big bounce higher (higher open Sunday night-that held) was short covering because of the colder weather models over the weekend/Monday.
U.S. natural gas prices are off to a rocky start in 2023, and analysts are braced for a choppy ride ahead amid expectations for strong production levels, infrastructure constraints and forecasts for relatively mild weather during the heart of winter. Limits on American exporters’ collective ability to meet global needs add another layer of uncertainty…
++++++++++++++++++++
Mild weather for natural gas thru 10 days but a major pattern change later in week 2 to either near normal temps or possibly below to even much below temps if that amplifies in week 3. NG is a fundamentally bearish market in the absence of major cold.
NG had a blip higher from colder models and bounce off of MAJOR support.
European +6 HDDs. 6z GEFS +4 HDDS.
But the extremely bearish fundamentals are weighing on the market. If models keep getting colder, NG will likely have a bottom, if not..........then we could break this MAJOR support.
OK, that didn't take long.
We just broke major support and are down sharply again.
Without much change in the weather models, ng crashed thru last weeks lows and made new lows for the move...........took out a zillion sell stops, then came roaring back $2,000/contract and is around unchanged.
Potential sign of a major bottom and pattern change to colder coming up.
Natural gas futures traded in negative territory most of Wednesday – and have declined all but three sessions so far this year – amid a persistently potent warm-weather pattern that squashed demand across much of the Lower 48. At A Glance: Warm weather pattern endures Late-month shift in the cards Meager storage print expected The…
+++++++++++++++++++
All guidance points strongly to a pattern change after day 10.
https://www.marketforum.com/forum/topic/91972/#92018
It WILL be colder and likely, at the very least some below average days.
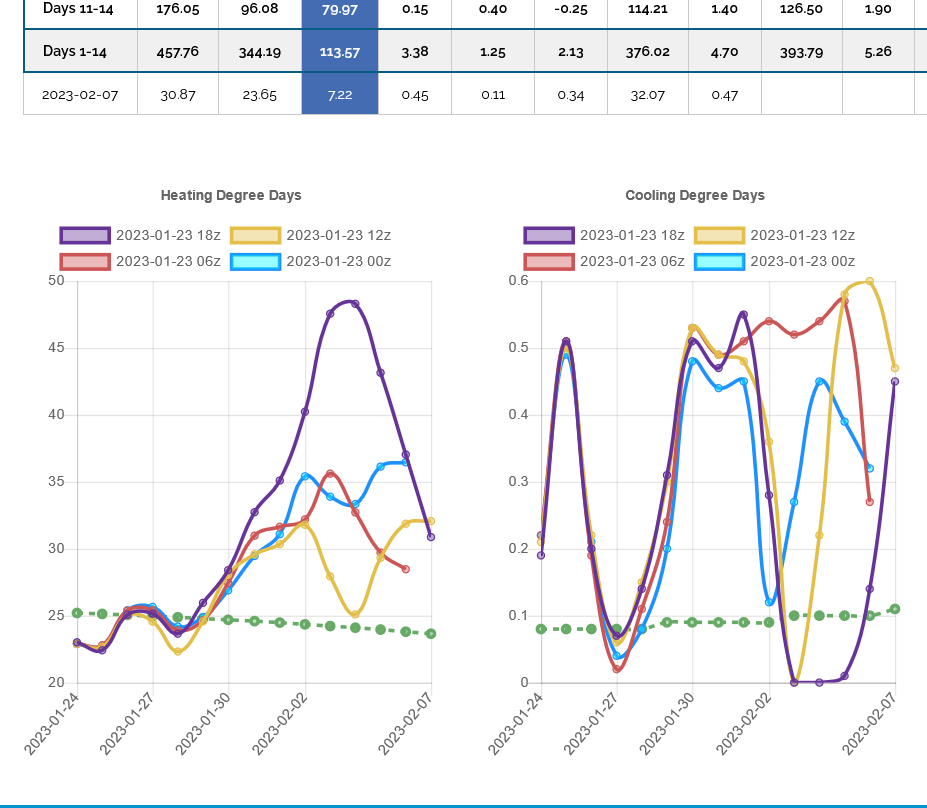
Temps for the EIA on Thursday: Incredible warmth in the high population centers with extremely low residential demand for heating and probably the most bearish EIA report in history coming.
This probably explains a big part of why NG has not been reacting well this week to the pattern change to colder later this month.
![]()
https://ir.eia.gov/ngs/ngs.html
for week ending January 6, 2023 | Released: January 12, 2023 at 10:30 a.m. | Next Release: January 19, 2023
+11 BCF That's right, an injection.
I think I remember 1 other injection in January the last 30 years. What do you say, Larry? Doesn't get any more bearish than that. NG +$2,000/contract had already anticipated that and is reacting to the pattern change to colder now........with the weather guidance continuing to confirm the colder weather pattern later this month.
| Working gas in underground storage, Lower 48 states Summary text CSV JSN | |||||||||||||||||||||||||
|---|---|---|---|---|---|---|---|---|---|---|---|---|---|---|---|---|---|---|---|---|---|---|---|---|---|
| Historical Comparisons | |||||||||||||||||||||||||
| Stocks billion cubic feet (Bcf) | Year ago (01/06/22) | 5-year average (2018-22) | |||||||||||||||||||||||
| Region | 01/06/23 | 12/30/22 | net change | implied flow | Bcf | % change | Bcf | % change | |||||||||||||||||
| East | 700 | 691 | 9 | 9 | 735 | -4.8 | 702 | -0.3 | |||||||||||||||||
| Midwest | 823 | 839 | -16 | -16 | 843 | -2.4 | 826 | -0.4 | |||||||||||||||||
| Mountain | 153 | 157 | -4 | -4 | 161 | -5.0 | 162 | -5.6 | |||||||||||||||||
| Pacific | 160 | 165 | -5 | -5 | 206 | -22.3 | 235 | -31.9 | |||||||||||||||||
| South Central | 1,067 | 1,040 | 27 | 27 | 1,096 | -2.6 | 1,017 | 4.9 | |||||||||||||||||
| Salt | 295 | 270 | 25 | 25 | 332 | -11.1 | 301 | -2.0 | |||||||||||||||||
| Nonsalt | 772 | 770 | 2 | 2 | 764 | 1.0 | 715 | 8.0 | |||||||||||||||||
| Total | 2,902 | 2,891 | 11 | 11 | 3,042 | -4.6 | 2,942 | -1.4 | |||||||||||||||||
Totals may not equal sum of components because of independent rounding. | |||||||||||||||||||||||||
Working gas in storage was 2,902 Bcf as of Friday, January 6, 2023, according to EIA estimates. This represents a net increase of 11 Bcf from the previous week. Stocks were 140 Bcf less than last year at this time and 40 Bcf below the five-year average of 2,942 Bcf. At 2,902 Bcf, total working gas is within the five-year historical range.
For information on sampling error in this report, see Estimated Measures of Sampling Variability table below.
MetMike
Much appreciate your updates throughout this thread.
I failed to enter a protective stop, but now appear to be "OK".
As I indicated in my original post, the daily cycle may have come early. Well, had I exercised patience, it came a few days later ON SCHEDULE!
Bought BOIL today (earlier) and it is now profitable.
Protective stops tomorrow.
YW tjc!
Good for you in sticking with the trade and being early. Big items favoring the bulls here:
1. Because of the turn of the calendar page, cold new days in the extended will be replacing mild current days that become history.
2. The off the charts bearish EIA is behind us.
NG can be extremely whacky though. This spike higher could also be an expected response to the sell the rumor, buy the fact release of the +11 BCF and then we go back down because of the massive supplies gushing in since the end of last Summer.
We're back above the HUGE support though with sustained cold coming which might be enough to overcome the very bearish fundamental situation.
++++++++++++
NG had the chance to keep going higher but again, rejected that opportunity. The European model came out -5 HDDs bearish, all in the late week 2 period... and this market will only be able to sustain moves up when models keep getting colder and colder.
0z gefs was +5hdds bullish, then the 6z run was -14hdds bearish.
I was considering being long over the weekend but a change that big and bearish over the weekend that continued would mean a big gap lower on sunday night.
Hey Mike,
I'll need to check my records about whether or not there has been an injection in any other winter week.
Hey Mike,
I'll need to check my records about whether or not there has been an injection in any other winter week. Also, keep in mind that this was another holiday week. Any past injections would almost certainly have to have been during a holiday week with way below normal HDDs.
Would you please tell me how much colder is the 0Z EE vs the 0Z GEFS for the same days (I know the GEFS goes out an extra day). TIA
I see that the warmer GFS suite days 9+ held warm at 12Z. Let's see what the 12Z Euro suite and CMC ens do. I'm guessing warmer than their 0Z runs.
Thanks Larry,
Actually the 12z GEFS was +9 HDDs vs the 6z but -7 HDDs vs the 0z runs.
However, the huge deal is that this solution, during week 2 is that it builds a big ridge in the southeast and wants to obliterate the ridge along the West Coast late in week 2(force it farther west into the Pacific).
This is back to warm in the east and contrasts with the models this week that liked a ridge west, trough east pattern.
This could suggest the atmosphere continues to take on an El Nino signature but is also much different than the Canadian and other models.
In the higher latitudes, we the northern stream with a distinctive cross polar flow dumping extreme Siberian cold into all of Canada(similar to the December cold) that will be within striking distance to most locations in the US......depending entirely on the the flow coming out of the Pacific and whether we have a ridge west/trough east pattern that lets it in with northerly winds.........or a trough west/ridge east pattern that opposes the colds southward movement.
This is what I like to help with discernment for that period.
This was from the models 12 hours ago. There is much uncertainty and the indices are close enough to 0 so as to be no help.
++++++++++++++
Arctic Oscillation Index, North Atlantic Oscillation Index, Pacific North American Index.
https://www.cpc.ncep.noaa.gov/products/precip/CWlink/daily_ao_index/ao.shtml
https://www.cpc.ncep.noaa.gov/products/precip/CWlink/pna/nao.shtml
https://www.cpc.ncep.noaa.gov/products/precip/CWlink/pna/pna.shtml
++++++++++++++++++++++++++++++++++++++++++++
GFS ensemble mean anomalies at 2 weeks.
https://www.psl.noaa.gov/map/images/ens/z500anom_nh_alltimes.html
2 week 850 temp for ensemble mean anomaly
https://www.psl.noaa.gov/map/images/ens/t850anom_nh_alltimes.html
The just out EE was +1 HDDs.
On the Winter injection. I thought that I remembered a mid Winter injection over 20 years ago.
Maybe I'm thinking of the first week of January 1997 that had a miniscule -4 BCF drawdown, which also featured a SouthCentral injection?
The injection this time obviously came from the SouthCentral regions +27 BCF on yesterdays report.
++++++++++++
With this week's slide lower and todays sharply lower price, we closed below the lows of 2022 and below some huge support on the price charts. Fundamentals are just incredibly bearish with record amounts of ng gushing in since the end of last Summer.
The cure for high prices is............high prices. Last Summer's massive price spikes higher provided financial incentive for producers to bring supplies to the market.
https://tradingeconomics.com/commodity/natural-gas
5 years below
1 week below
It looks like to me that the colder EE for the E US for late Jan has caved to the warmer GEFS. It has done poorly overall this winter with a cold bias for the E US.
you're right Larry but the 12z EE was still +7 HDDs vs the previous 0z run.
im a bit confused...so are the weekend runs bullish or bearish for the nat gas opening sun evening
CC,
Good question. The 0z EE had HDD's back to -6 HDDs and bearish but I don't think the market is going to be paying that much attention to HDDs tonight.
It's more about the pattern and there's tremendous uncertainty because of the enormous amount of cold being dumped into Canada because of a cross polar flow, that's within striking distance of the US.
The polar vortex will also shift south into Canada. So the northern stream is VERY bullish!
However, the southern/Pacific stream wants to resist this and try to deflect some of that cold coming with a south to north component emanating from an upper ridge in the Southeast US.
My figurative money is on the low level cold undercutting the milder flow aloft from the Pacific stream and going with the COLDER solutions and a higher open.
The last 12z GEFS was -10 HDDs bearish vs its 6z run and -7 HDDs vs the 0z run.
The same run of the EE was +11 HDDs bullish.
This is totally expected with the current pattern that features extreme cold dumping in from Canada and a warm upper level ridge in the Southeast US trying to impede the cold.
The temperature gradient from northwest to southeast will be incredibly steep and small changes in the position of major features (especially at the surface) will mean big double digit, multi day changes in forecast temperatures for the areas affected with the steep gradient.......which is pretty wide.
When it shifts north........we see big -HDDs changes. When it shifts south big +HDDs changes.
Look at all the 850 millibar temp isotherms crammed close together, lined up from north to south(at 3 deg. C intervals-which is around 5 deg. F) on the 12z GEFS for 10 days out.
The 0 deg. C freezing line is just south of the Ohio River. This corresponds to around 5,000 feet or 1 mile up. 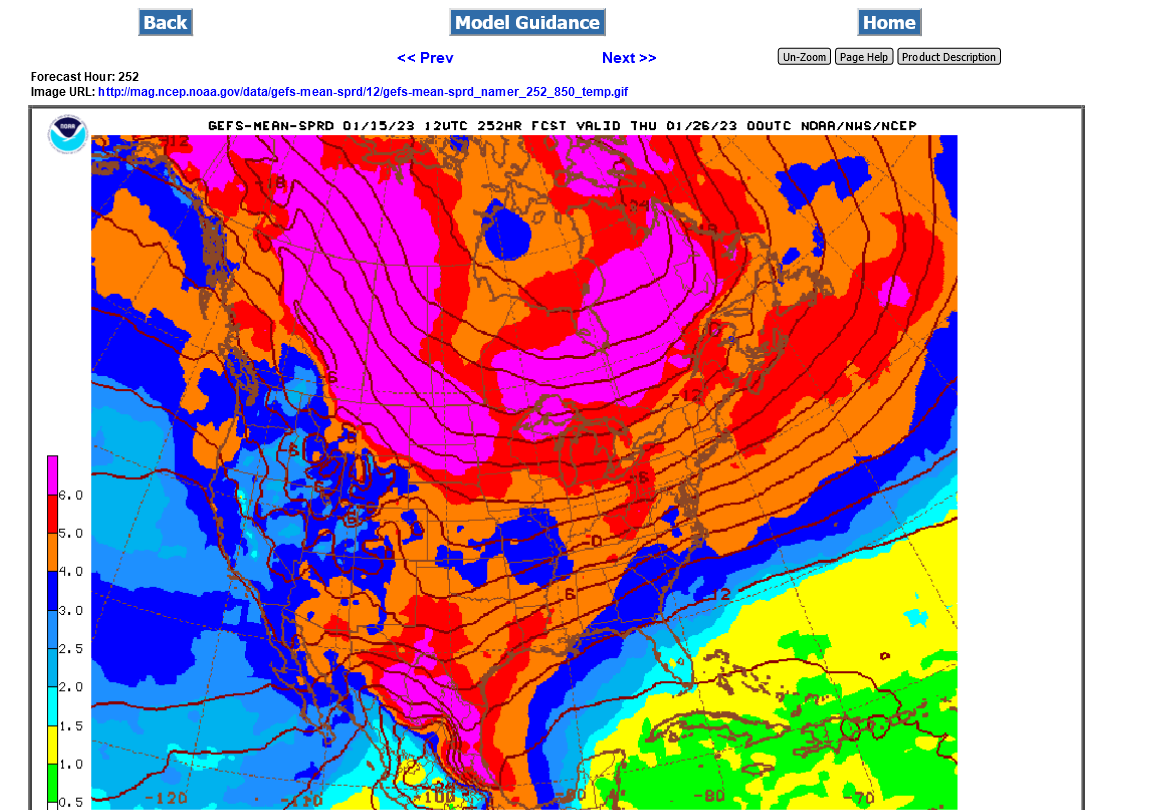
| THE 850 MB CHART |
METEOROLOGIST JEFF HABY
Chart is good for assessing low level warm air and cold air advection
0z GEFS was +9 HDDs. EE was +7 HDDs!
This Thursday's EIA report should be another small injection but not nearly as incredibly bearish as the last one:
Models continue less cold in week 2;
The overnight EE was -8 HDDs vs the previous 12z run.
NAO and PNA level off around 0 in week 2, while the AO actually tracks into slight +AO positive territory at the end of the period.....for the first time since November.
A +AO is unfavorable for cold to move from high latitudes down to the middle latitudes.
https://www.marketforum.com/forum/topic/91972/#92018
+++++++++++++
https://ir.eia.gov/ngs/ngs.html
![]()
for week ending January 13, 2023 | Released: January 19, 2023 at 10:30 a.m. | Next Release: January 26, 2023
-82 BCF
| Working gas in underground storage, Lower 48 states Summary text CSV JSN | |||||||||||||||||||||||||
|---|---|---|---|---|---|---|---|---|---|---|---|---|---|---|---|---|---|---|---|---|---|---|---|---|---|
| Historical Comparisons | |||||||||||||||||||||||||
| Stocks billion cubic feet (Bcf) | Year ago (01/13/22) | 5-year average (2018-22) | |||||||||||||||||||||||
| Region | 01/13/23 | 01/06/23 | net change | implied flow | Bcf | % change | Bcf | % change | |||||||||||||||||
| East | 662 | 700 | -38 | -38 | 678 | -2.4 | 658 | 0.6 | |||||||||||||||||
| Midwest | 785 | 823 | -38 | -38 | 779 | 0.8 | 775 | 1.3 | |||||||||||||||||
| Mountain | 147 | 153 | -6 | -6 | 152 | -3.3 | 154 | -4.5 | |||||||||||||||||
| Pacific | 157 | 160 | -3 | -3 | 201 | -21.9 | 228 | -31.1 | |||||||||||||||||
| South Central | 1,069 | 1,067 | 2 | 2 | 1,029 | 3.9 | 971 | 10.1 | |||||||||||||||||
| Salt | 307 | 295 | 12 | 12 | 311 | -1.3 | 288 | 6.6 | |||||||||||||||||
| Nonsalt | 762 | 772 | -10 | -10 | 718 | 6.1 | 684 | 11.4 | |||||||||||||||||
| Total | 2,820 | 2,902 | -82 | -82 | 2,839 | -0.7 | 2,786 | 1.2 | |||||||||||||||||
Working gas in storage was 2,820 Bcf as of Friday, January 13, 2023, according to EIA estimates. This represents a net decrease of 82 Bcf from the previous week. Stocks were 19 Bcf less than last year at this time and 34 Bcf above the five-year average of 2,786 Bcf. At 2,820 Bcf, total working gas is within the five-year historical range.
For information on sampling error in this report, see Estimated Measures of Sampling Variability table below.
+++++++
metmike: -82 BCF was slightly bullish compared to expectations but wimpy vs the 5 year average. Blue line above is closing the gap/deficit with the 5 year average again and will be above it before the end of Winter.
https://www.investing.com/economic-calendar/natural-gas-storage-386
The U.S. Energy Information Administration (EIA) on Thursday reported a withdrawal of 82 Bcf natural gas from underground storage for the week ended Jan. 13. The result proved steeper than expectations – though anemic compared to historic averages — and left already battered Nymex natural gas futures modestly lower. “That’s quite the loose number once…
+++++++++++++++++++++++
Temps, although a bit colder than average to end the month/start February are not cold enough to offset the massive amount of RECORD supplies gushing in since the end of last Summer.
The last EE was -8 HDDs bearish but followed up by the last GEFS that was +12 HDDs bullish. This will happen as explained above with that tremendous temperature gradient and small shifts north or south of temperature bands in the forecasts, which typically take place from model run to model run. The pattern overall this week has taken on a less extreme cold potential look in week 2.
Sooo...the trader in me says: no possible worse news to come---BUY
tjc,
I hear you as a fellow trader, who's favorite trading set ups are picking over done/extreme tops and bottoms....just like yours.
However there could be worse news to come if the 2nd half of Winter ends up very mild and we build up a huge surplus in storage because of supplies continuing to gush in at a record place with no major residential heating demand to gobble it up.
The atmosphere has been acting like an El Nino for the last few weeks. I don't care what NOAA says about ENSO and that we still have an OFFICIAL La Nina in place by their standards.
We use La Nina and El Nino to predict the WEATHER but in this case, I'm telling you the weather is already telling us about the El Nino. I'll start a new thread on that shortly.
The reason that this is important is that the energized Pacific jet stream from the El Nino reacting atmosphere will increase the flow from the Pacific across the US and make it much harder for the northern stream's attempts to push cold air down from Canada. El Nino months in the Winter often feature mild, oceanic air crossing the country from west to east.
And in fact, towards the end of 2 weeks, instead of the cold shifting east, a ridge builds in the Southeast as the PNA drops again. This is NOT favorable for cold air to penetrate deeply into the high population centers in the East early in February or longer term. February is looking potentially very mild.
https://www.marketforum.com/forum/topic/91972/#92164
https://www.marketforum.com/forum/topic/91060/#91893
++++++++++++
In addition, there are powerful signs of a global recession, which kills industrial demand for natural gas.
I lost a bunch of money on an intense blast of cold in January 2009 that SHOULD HAVE spiked ng higher but we just kept crashing lower from the recession and shift to new supplies from fracking.
https://www.worldbank.org/en/news/press-release/2023/01/10/global-economic-prospects
Also, seasonals at this time of year are still pretty negative, especially for the front month.
During the Winter months, the only times you want to be long NG for the best opportunity are when 1 or more of these factors exist:
1. Ahead of extreme cold
2. When ng in storage is critically low
3. When the storage is eroding vs the 5 year average
http://charts.equityclock.com/seasonal_charts/futures/FUTURE_NG1.PNG

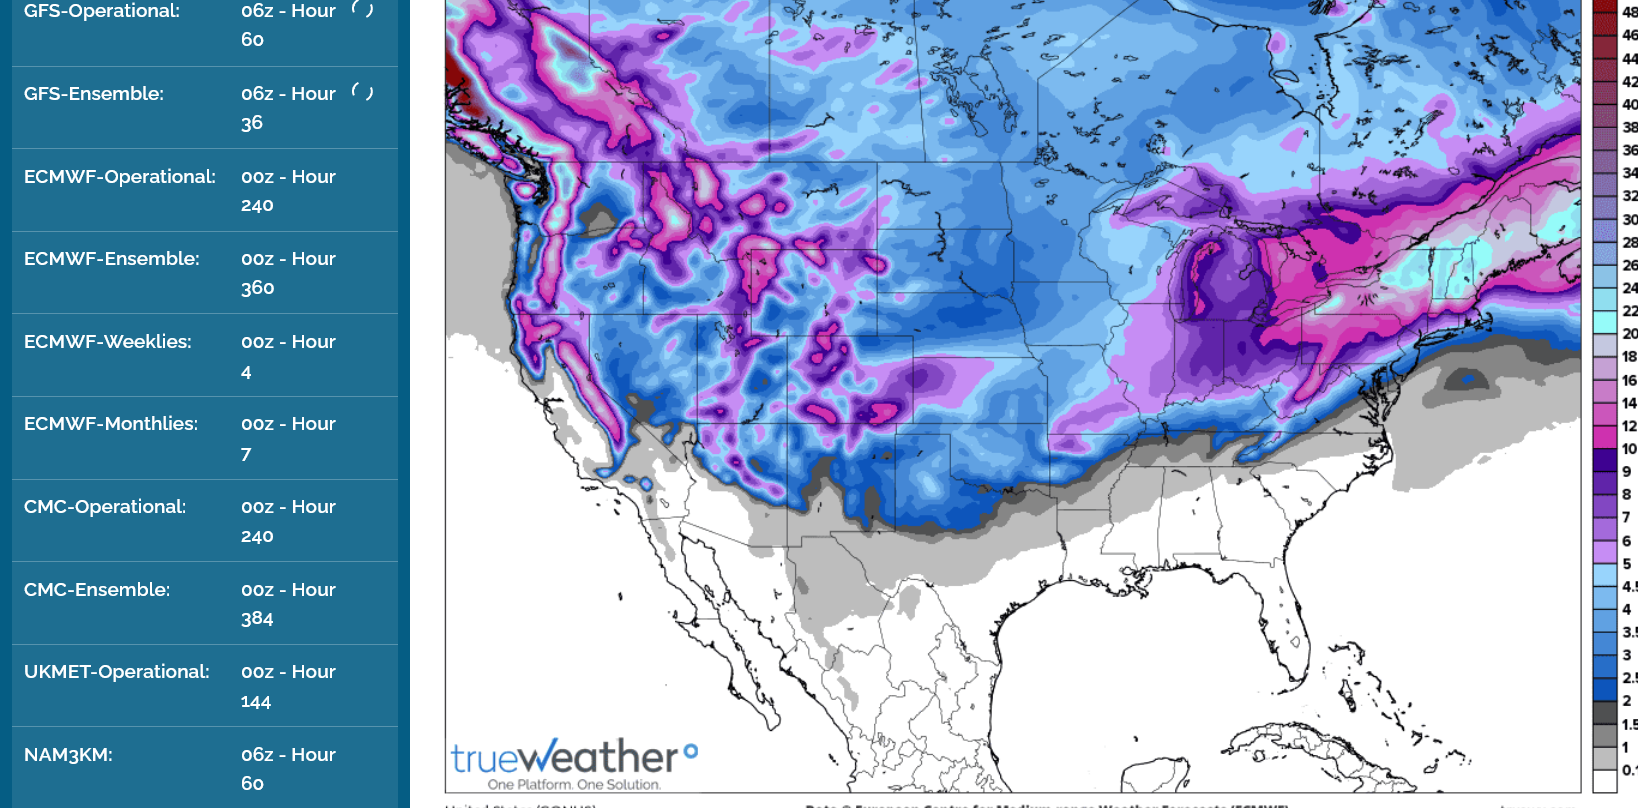
A tight temperature gradient at this time of year, with moisture coming northward and the southern edge of Siberian cold air dumping southward often ends of causing a great deal of snow.
6+ inches north of the Ohio River. 2 feet in places in the Northeast.
Nat gas broke to new lows at close.. How much lower can this go? Met Mike ..tjc?
Hi coffee,
I was going to post an article about not trying to "catch a falling knife" but realized that not one of them understand the current fundamentals driving the price of ng lower and tjc and metmike's favorite trade is to catch a falling knife.
1. Do not assume that this drop lower is so overdone that it can't continue much lower to a price that you never imagined.
2. The market is mostly focused on how much gas is coming in (record amount) compared to how much is being used for residential heating compared to the average this time of year.
3. Even during the periods of extreme cold that we had this Winter, all that did was briefly pause the collapse. Model runs that were much colder caused a brief, knee jerk spike higher......that would be wiped out quickly. Sellers have been pouncing on any brief rallies.
This is just a description of the backdrop which has constantly defined natural gas trading since the late Summer highs and collapse to just 1/3rd the price with today's trade.
This is entirely based on fundamentals that are causing natural gas to gush in at a record pace.
That will only change when producers finally stop the supply gush. The cure for low prices..........is low prices. At some point, they will pull back because the financial incentives/profits will dry up.
There may have been alot of their future production sold this past Summer (if they were smart) when the price spiked near $10 and even though the front month (Feb) and cash is down near $3, if they sold/hedged their production by forward contracting last Summer, for Feb, they're getting paid more than double what the futures are trading on Jan 20......so they keep producing more than what they would if they were just getting $3 for it.
Gradually, those contracts sold at higher prices will be fullfilled and less of a factor and producers will lose incentive to produce at this incredible rate.
Is that here?
A month from now? When a seasonal bottom is typical, followed by a very reliable seasonal uptrend in Spring.
Will they really pull back later in the year, if it looks like storage will be getting full and prices stink?
There are traders and insiders that understand this and can track the changes in production. That's not me. Most of us can only follow EIA reports and compare them with HDDs and market expectations.
I'm a meteorologist of 41 years and trader for 31 years and use weather to trade. The weather pattern coming up for the next 2+ weeks is not cold enough by itself to stop ng from falling. Something else might do it......and more seasonal bottoms in ng occur in Feb/March than any other time frame by an extremely wide margin.
There's an extremely high chance that NG won't go lower from late March thru April........no matter what else is going on.
I mentioned to Larry several times that a trader should never be short ng in March/April.
http://charts.equityclock.com/seasonal_charts/futures
Big traders know this and its such a reliable seasonal that it feeds on itself. Aggressive selling here in January will dry up in another month or so and the trade mentality will have a psychological shift.
No matter how bearish the weather and how small the injections, at that point we will run out of sellers.
Extreme cold in February can cause that shift in mentality that happens every late Winter to come early and put in our seasonal bottom THEN.......a bit earlier than usual.
However, mild weather can extend it to later than that.
There are several reasons for reliable seasonal patterns.
1. Some are related to fundamentals of supply(crops) and demand and how the weather or other things affect this element.
2. Some are self fulling prophesies. If the trader that Wykoff referred to as the "composite man" which is the entire community of traders and their collective thoughts believe something is going to happen to the price...they CAUSE it to happen.
An example of that is the market going up and down because of a forecast of weather 10+ days out. The market THINKS something will happen many days from now that will affect supply/demand of that commodity and everyone dials that in with either buyers or sellers being more aggressive based on what they think is going to happen on something that weather models tell them will happen down the road. When it actually happens, the market knew about it and dialed it into the price many days earlier.
Prices almost always bottom in ng towards the end of Winter. All the big traders know this and they stop their aggressive selling because of this expectation.
If this were November, the same seasonal mentality would not exist because the typical seasonal bottom would be months away.
However, the seasonal mentality is approaching the time frame of the sea change from negative to positive.
Because supplies are gushing in at a tremendous rate and we will be gaining on storage compared to previous years for the next couple of weeks at least and storage is NOT precariously low............we can't see an early bottom from that aspect.
In thinking more about it, a pattern change to extreme cold that lasted at least 10 days in the high population areas in February would be plenty enough to cause the sea change and early seasonal bottom.
Or sustained moderate cold in February that continued into March.
However, one thing to keep in mind is the big dark cloud storage comparison hanging over the NG bulls from the next 2 months vs 2022 that featured some enormous drawdowns for ALL the weeks in the 2nd half of Winter/early Spring. Looks like producers were doing the complete opposite of what they're doing now(pulling back on production). Because of that, the market knows that our storage situation will be GAINING compared to last year with very high confidence.
Look at these drawdowns from a year ago.
6 of them were -173 BCF or bigger, coming in consecutive weeks. That was -998 BCF in those 6 weeks that averaged -166 BCF/week.
We even had a drawdown in April, -33 BCF.
| Release Date | Time | Actual | Forecast | Previous |
|---|
| Apr 28, 2022 | 09:30 | 40B | 38B | 53B | |
| Apr 21, 2022 | 09:30 | 53B | 37B | 15B | |
| Apr 14, 2022 | 09:30 | 15B | 15B | -33B | |
| Apr 07, 2022 | 09:30 | -33B | -26B | 26B | |
| Mar 31, 2022 | 09:30 | 26B | 21B | -51B | |
| Mar 24, 2022 | 09:30 | -51B | -56B | -79B | |
| Mar 17, 2022 | 09:30 | -79B | -73B | -124B | |
| Mar 10, 2022 | 10:30 | -124B | -117B | -139B | |
| Mar 03, 2022 | 10:30 | -139B | -138B | -129B | |
| Feb 24, 2022 | 10:30 | -129B | -134B | -190B | |
| Feb 17, 2022 | 10:30 | -190B | -193B | -222B | |
| Feb 10, 2022 | 10:30 | -222B | -222B | -268B | |
| Feb 03, 2022 | 10:30 | -268B | -216B | -219B | |
| Jan 27, 2022 | 10:30 | -219B | -216B | -206B | |
| Jan 20, 2022 | 10:30 | -206B | -194B | -179B | |
| Jan 13, 2022 | 10:30 | -179B | -173B | -31B | |
| Jan 06, 2022 | 10:30 | -31B | -54B | -136B |
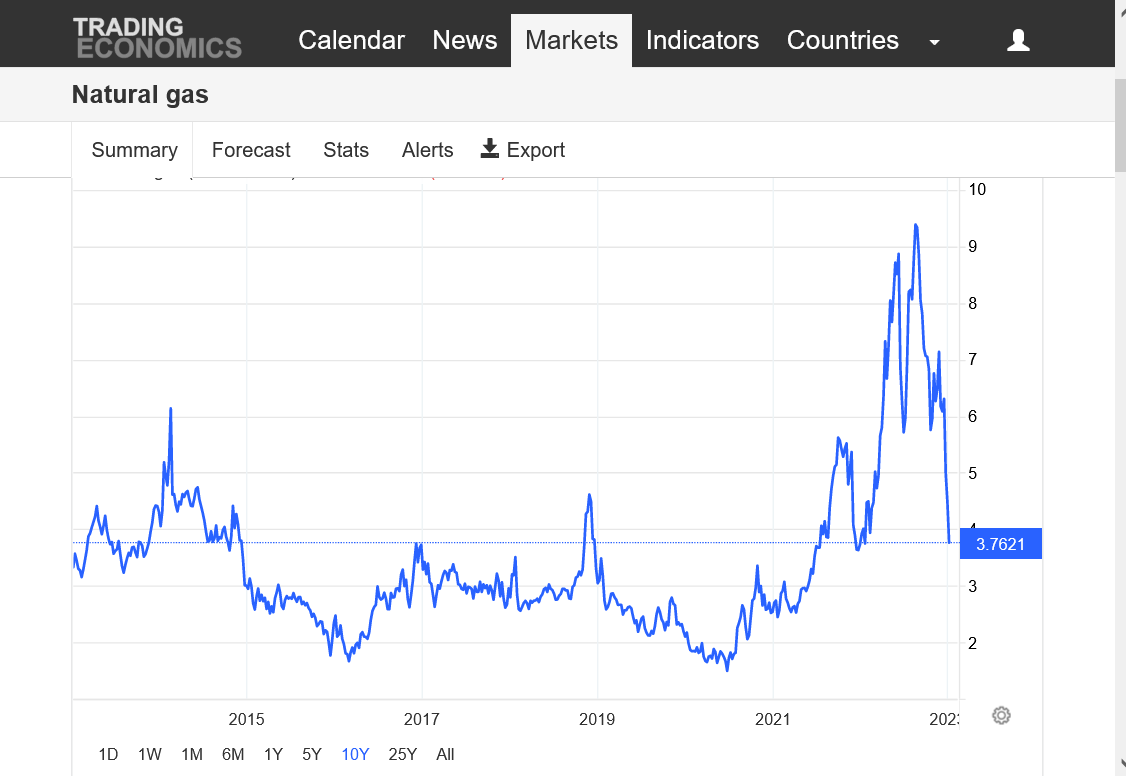
We've crashed thru some strong support levels that only provided very short lived bounces. Trying to guess at what support level will hold for ng on a chart like this in the current extreme collape of the ng market is not a very effective way to predict the bottom/price.
https://tradingeconomics.com/commodity/natural-gas
30+ years below.
5 years below
1 year below
1 month below:
Great post Mike! I nominate it for post of the week, month.
Thanks much cutworm!
Since you enjoyed it so much, I read it over and changed the verbiage in bold/underlined that was not clearly elaborated the first time.
Thanks met Mike.. Latest models seem to be leaning colder again from what I see.. Tjc what say you
Last GEFS was +7 HDDs, previous 1 was -3HDDs so net +4HDDs.
Last EE was -7HDDs.
+AO, +NAO and -PNA are not good for cold penetration in the East in early February.
MetMike
I echo, and second, the nomination for BEST post of the week. Complete summary!
1. From an overwhelmed long trader perspective, the selling into new lows, below 3.00, may have been aggressive shorts 'pushing' the low in trading after the 'close', but before end of trading, which is a thinner trading timeframe (silver does this on many occasions). IF, IF so, some may be caught short.
The first few minutes of Sunday night may/should give us a clue. I suspect a lower open than the close, but above the Friday daily low. Can aggressive shorts create another new low? If so, 1 percent lower to 2.95?
2. Also, hedges have to be offset, so 'some' buying is to be expected.
3. Cycle time frame for low is now extended
4. European buying 'should' surface in preparation for winter '23 which would reverse producer hedging.
Fun, unless long!
Thanks for the kind words and veteran thoughts on ng.
The last GEFS was -13 HDDs vs the previous run.
The Euro was another -3 HDDs.
TJC still long? I agree with what you say about post settlement Friday action. But with -13 Hdd uh oh
The last GEFS is +4.5 HDDs.
tjc raised an outstanding point about Europe.
In recent years, natural gas became more of a global market than it was before and in the Fall of 2021, with Europes supplies precariously low, the US natural market for a couple of months traded off of what the European ng market was doing.
It was that self fulfilling prophesy thing and Wyckoffs composite man. The US was taking it's cue off of Europe's ng market and that was dominating our trading because that's what all the traders decided they would trade on during that time frame.
They amplified the importance X10 over what it should have been to our market but you can see that happening all the time when the European model guidance is just coming out and suddenly, ng spikes $1,000/contract in seconds............just because of one much more bullish or bearish distant time frame of 1(most important) model.
Even though the market appreciates that the next run might go the other way. When that comes out.......nothing else matters.
So what is the storage situation like right now in Europe?
What are prices like in Europe?
What will 2023 exports be from the US and is the damaged export facility that was down for many months fully operating again?
Outside of the Middle East, the US must easily have the lowest ng prices in the world.
Another possible factor is recession. The 2008/09 recession featured natural gas doing almost exactly what its doing today. The world was much different but the market had an incredible peak in the Summer/June 2008 and collapsed lower and lower thru the following Winter and even record cold in January 2009 didn't help the bulls.
So here's the question met Mike. The models keep flip-flopping.. But we're running out of time for any sustained cold weather.. do you think you're still any hope
coffeeclotch,
we're running out of time for any sustained cold weather.. do you think you're still any hope
++++++++++++++++
I don't really see the models as flip flopping. The changes in HDDs are totally expected in a pattern like this as explained here:
https://www.marketforum.com/forum/topic/91972/#92222
Models will always have variations from run to run and model to model. With the extremely tight temperature gradient THIS TIME, those typical changes will just be amplified more than usual.
The models have been pretty consistent for numerous days with the solution for the upcoming pattern.
I get the distinct impression from your posts this weekend, that you're long and hoping something will change over the weekend so that the position goes in your favor.
With regards to any hope for cold, I already answered in detail. This is part of it:
https://www.marketforum.com/forum/topic/91972/#92358
In thinking more about it, a pattern change to extreme cold that lasted at least 10 days in the high population areas in February would be plenty enough to cause the sea change and early seasonal bottom.
Or sustained moderate cold in February that continued into March.
+++++++++
But maybe your question is with regards to whether there's hope between now and the open Sunday night so that you won't lose money.
Sure there's hope. With the tight temp gradient, a notable shift southeastward by all the models on the next couple of runs would likely give us a higher open tomorrow evening.
Been nibbling the long side but not holding it for long
in that case, , I have potentially good news for the bulls.
the oz gefs was +9 HDDs and the EE was a whopping +15 HDDs.
Well met Mike That's why I said I'd like to see a few runs that stay consistent because we're running out of time to get a cold snap.. I think a cold snap could turn this market for a decent run to the upside
Technicals precede fundamentals!
Waayyy oversold, low rsi, %R buys, "phoney" late trade Friday, cycle timeframe extended. Buy, atlas, I was early
TJC I'm curious a couple of years ago when crude oil collapsed below zero How did you far did you end up getting caught?
And I ask this without the slightest bit of mockery because I myself as someone that catches a falling knife.. Just wondering
Thanks tjc!
When something is pushed to an extreme because of forces all pushing in the same direction or 1 massive force that trumps the others, it will keep going in that direction until the forces change (the trend is your friend).
You can stay over sold(over bought) with rock bottom/high technical indicators telling you its just a matter of time before we rebound/fall...........for many months before something happens to change that.
Your indicators provide some skill in trying to do that but if the forces causing the market to make its powerful move in one direction continue or even amplify.........then the technical approach will usually fail if its a market that trades those fundamentals first.
The latest HDD's this weekend have been MUCH higher vs previous runs, which suggests a higher open tonight but we'll see what the EE has.
The latest 6z GEFS was +19.5 HDDs vs the 18z yesterday. That's alot and the new 12z GEFS looks like its going to come out pretty dang cold too.
In addition to the last several HDD updates that were pretty bullish, this one is really bullish.
The last GEFS was +4 HDDs on top of the +20 HDDs from the previous 2 runs.
The last EE was a whopping + 19 HDDS(but its runs are 12 hours apart, compared to 6 hours for the GEFS) that's on top of the +17 HDDs from the previous one.
It's because of the extremely steep temperature gradient shifting southeast from the previous position.
Cold dense air near the surface that has momentum headed south from Canada often travels farther than the models think at first. This cold originates from Siberia, with cross polar flow filling up much of Canada with Siberian air(coldest on the planet in January) so its REAL cold.
It will moderate a great deal and be short lived but the increase in HDDs is huge.
+36 HDDs in 24 hours on the EE is the highest I can remember.......but, again that can only happen with the extremely tight/steep temp gradient we have coming.
We've definately had bigger pattern changes but this is not as much a pattern change as it is a shift southeast in the location of the extremely packed isotherms.
This was explained a week ago here: https://www.marketforum.com/forum/topic/91972/#92222
Thanks
Coffee
The crude price at/below zero was in the last few days of an expiring month. I was NOT part of that contract.
I did extract a nice profit on the next month short, but atlas, covered "too soon".
We should open with a pretty extreme gap higher.
Higher open.
NOT EXACTLY scaring the shorts too badly. Appears it will take a move higher than 3.33 or 3.44 to force shorts to cover.
friday the march was following the feb lower tick for tick ..here the feb opened over 3.6 higher but the march which initially came close to 2.0 higher immediately sold down while feb initially hung the highs...then they both headed lower..i suspect if this is a real move the march will allign upward
also keep in mind they have trained to sell the sunday evening gaps...at some point it will blow up on the shorts
also keep in mind they have trained to sell the sunday evening gaps...at some point it will blow up on the shorts
1. As mentioned, this is NOT a pattern change to sustained cold. It's a just a shift southeast for the cold that results in a massive increase in HDD's(because of how extreme and tight the temp gradient is) for 7-10 days..........followed by quick moderation at the end of 2 weeks.
2. If that changes and it looks to last into week 3, this thing has legs but too much supply is gushing in right now.
3. Like with every other rally recently, we struggle to hold gains and find willing sellers at highs.
4. We can put in a seasonal bottom early if the 2nd half of Feb is also very chilly(we know that it will start that way).
5. The temp bands could shift back north or farther south overnight.
Speaking of which, the middle part of this 18z GEFS is -8 HDDs and thats why we've lost some of the gains from the open.
GEFS +12 HDDs, so we made new highs.
As you pointed out it's a short-term phenomena which is why the February is exploding in the March isn't
Yep!
To show how extremely packed the isotherms will be and how changeable individual model runs can be vs the ensemble mean(dozens of the same model run with tiny variations in equations averaged together-more consistent), the last 18z operational GFS just out was +82 HDDs vs the previous run.
That's the most I remember in my life. This is what it looks like:
Amazing downside continues
Stopped out Monday when opening 'gap' failed.
You think this is another crude situation where they just bury the front months I mean this thing is so oversold even on a weekly basis
The 7-9 day cold snap in the forecast gave us a brief dead cat bounce and now its back to supplies gushing in for the focus.
Last 18z GEFS was -18 HDDs!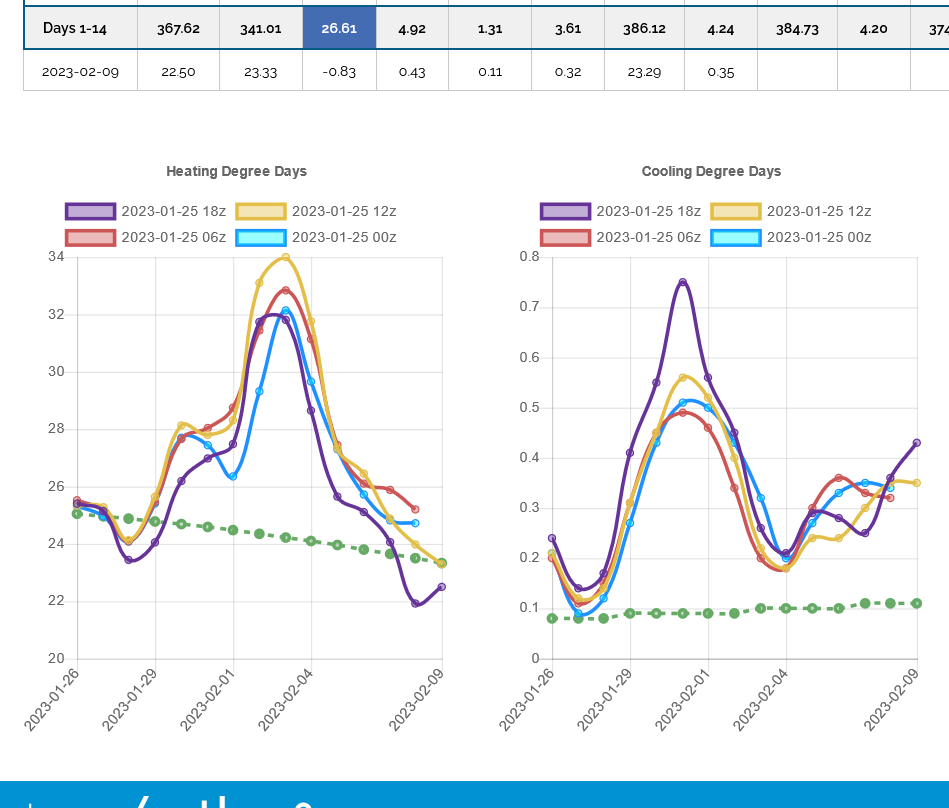