KEY EVENTS TO WATCH FOR:
Monday, December 19, 2022
10:00 AM ET. December NAHB Housing Market Index
Housing Mkt Idx (previous 33)
The STOCK INDEXES? http://quotes.ino.com/ex?changes/?c=indexes
The Dow closed sharply lower for the third-day in a row on Friday as it extended the decline off Tuesday's high. The low-range close sets the stage for a steady to lower opening when Monday's night session begins trading. Stochastics and the RSI are neutral to bearish signaling that sideways to lower prices are possible near-term. If the Dow extends this week's decline, the 50-day moving average crossing at 32,579.58 is the next downside target. Closes above the 20-day moving average crossing at 33,880.18 would signal that a short-term low has been posted. First resistance is Tuesday's high crossing at 34,712.28. Second resistance is the 75% retracement level of the January-October decline crossing at 34,901.54. First support today's low crossing at 32,654.59. Second support is the 50-day moving average crossing at 32,579.58.
The March NASDAQ 100 closed sharply lower for a third-day in a row on Friday as it extends the decline off Tuesday's high. The low-range close sets the stage for a steady to lower opening when Monday's night session begins trading. Stochastics and the RSI are neutral to bearish signaling sideways to lower prices are possible. If March extends this week's decline, the November 9th low crossing at 10,932.75 is the next downside target. Closes above the 20-day moving average crossing at 11,809.30 would signal that a short-term low has been posted. First resistance is the 50% retracement level of the August-October decline crossing at 12,229.32. Second resistance is the 62% retracement level of the August-October decline crossing at 12,618.67. First support is the November 9th low crossing at 10,932.75. Second support is November's low crossing at 10,746.75.
The March S&P 500 closed sharply lower for the third-day in a row on Friday as it extended this week's decline. The low-range close sets the stage for a steady to lower opening when Monday's night session begins trading. Stochastics and the RSI are neutral to bearish signaling that sideways to lower prices are possible near-term. If March extends this week's decline, the November 9th low crossing at 3782.75 is the next downside target. Closes above the 20-day moving average crossing at 4017.99 would confirm that a short-term low has been posted. First resistance is the 75% retracement level of the August-November decline crossing at 4150.59. Second resistance is the 87% retracement level of the August-November decline crossing at 4249.85. First support is the November 9th low crossing at 3782.75. Second support is November's low crossing at 3735.00.
INTEREST RATES? http://quotes.ino.com/ex?changes/?c=interest ""
March T-bonds closed down 30-pts. at 131-03.
March T-bonds closed lower on Friday. The mid-range close sets the stage for a steady to lower opening when Monday's night session begins trading. Stochastics and the RSI are overbought, diverging but remain neutral to bullish signaling that sideways to higher prices are possible near-term. If March extends the rally off November's low, the 62% retracement level of the August-November decline crossing at 133-30 is the next upside target. Closes below the 20-day moving average crossing at 128-31 would signal that a short-term top has been posted. First resistance is Thursday's high crossing at 132-15. Second resistance is the 62% retracement level of the August-October decline crossing at 133-30. First support is the 20-day moving average crossing at128-31. Second support is the 50-day moving average crossing at 124-26.
March T-notes closed down 50-pts. at 114.245.
March T-notes closed slightly lower on Friday. The high-range close sets the stage for a steady to slightly lower opening when Monday's night session begins trading. Stochastics and the RSI are becoming overbought, diverging but are neutral to bullish signaling that sideways to higher prices are possible near-term. If March extends the rally off October's low, the 62% retracement level of the August-November decline crossing at 116.232 is the next upside target. Closes below the 20-day moving average crossing at 113,296 would signal that a short-term top has been posted. First resistance is the 50% retracement of the August-October decline crossing at 115.090. Second resistance is the 62% retracement of the August-October decline crossing at 116.232. First support is the 20-day moving average crossing at 113.296. Second support is the 50-day moving average crossing at 112.107.
ENERGY MARKETS? http://quotes.ino.com/ex?changes/?c=energy ""
January crude oil closed lower on Friday as it consolidated some of the rally off last-Friday's low. The low-range close sets the stage for a steady to lower opening when Monday's night session begins. Stochastics and the RSI are turning neutral to bearish signaling that sideways to lower prices are possible near-term. If January renews the decline off November's high, the 62% retracement level of the 2020-2022 rally crossing at $63.80 is the next downside target. Closes above the 20-day moving average crossing at $76.71 would signal that a short-term low has been posted. First resistance is the 20-day moving average crossing at $76.71. Second resistance is the 50-day moving average crossing at $82.28. First support is last-Friday's low crossing at $70.08. Second support is the 62% retracement level of the 2020-2022 rally crossing at $63.80.
January heating oil closed lower due to profit taking on Friday as it consolidates some of the rally off last-Wednesday's low. The low-range close sets the stage for a steady to higher opening when Monday's night trading session begins. Stochastics and the RSI are turning neutral to bearish signaling that sideways to lower prices are possible near-term. Closes below the 10-day moving average crossing at $3.0115 would signal that a short-term top has been posted. If January extends this week's rally, the 50-day moving average crossing at $3.3674 is the next upside target. First resistance is the 50-day moving average crossing at $3.3674. Second resistance is the November 15th high crossing at $3.5789. First support is the 10-day moving average crossing at $3.0115. Second support is last-Wednesday's low crossing at $2.7750.
January unleaded gas closed lower on Friday as it consolidated some of the rally off Monday's low. The low-range close sets the stage for a steady to lower opening when Monday's night session begins trading. Stochastics and the RSI are turning neutral to bearish signaling that sideways to lower prices are possible near-term. If January renews the decline off November's high, the 50% retracement level of the 2020-2022 rally crossing at 1.9894 is the next downside target. Closes above the 20-day moving average crossing at $2.2355 would signal that a short-term low has been posted. First resistance is the 20-day moving average crossing at $2.2355. Second resistance is the 50-day moving average crossing at $2.3825. First support is Monday's low crossing at $2.0204. Second support is the 50% retracement level of the 2020-2022 rally crossing at 1.9894.
January Henry natural gas closed lower on Friday as it extends this week's trading range. The mid-range close sets the stage for a steady to lower opening when Monday's night session begins trading. Stochastics and the RSI are neutral to bullish signaling that sideways to higher prices are possible near-term. If January extends the rally off the December 6th low, the August-November downtrend line crossing near 7.685 is the next upside target. Closes below the 10-day moving average crossing at 6.250 would signal that a short-term top has been posted. First resistance is Tuesday's high crossing at 7.105. Second resistance is the August-November downtrend line crossing near 7.685. First support is the 10-day moving average crossing at 6.250. Second support is last-Tuesday's low crossing at 5.337.
CURRENCIES? http://quotes.ino.com/ex?changes/?c=currencies ""
The March Dollar closed higher on Friday following yesterday's key reversal up signaling that a short-term low might have been posted today. The high-range close sets the stage for a steady to higher opening when Monday's nights session begins trading. Stochastics and the RSI are turning neutral to bullish signaling that sideways to higher prices are possible near-term. Closes above the 20-day moving average crossing at 105.082 would signal that a short-term low has been posted. If March extends the decline off September's high, the 75% retracement level of the January-September rally crossing at $101.331 is the next downside target. First resistance is the 20-day moving average crossing at 105.082. Second resistance is the November 30thhigh crossing at 106.775. First support is Thursday's low crossing at $102.875. Second support is 75% retracement level of the January-September rally crossing at $101.331.
The March Euro closed lower on Friday following yesterday's key reversal down as it consolidated some of the rally off September's low. The low-range close sets the stage for a steady to lower opening when Monday's night session begins trading. Stochastics and the RSI are overbought, diverging and are turning neutral to bearish signaling that sideways to lower prices are possible near-term. Closes below the 20-day moving average crossing at 1.05517 would signal that a short-term top has been posted. If March extends the rally off September's low, the March 31st high crossing at $1.09680 is the next upside target. First resistance is the 25% retracement level of the 2018-2022 decline crossing at $1.07982. Second resistance is the March 31st high crossing at $1.09680. First support is the 20-day moving average crossing at $1.05517. Second support is the November 30th low crossing at $1.03715.
The March British Pound closed lower on Friday as it consolidated some of the rally off September's low. The mid-range close sets the stage for a steady to lower opening when Monday's night session begins trading. Stochastics and the RSI have turned neutral to bearish signaling sideways to lower prices are possible near-term. Closes below the 20-day moving average crossing at 1.2170 would confirm that a short-term top has been posted. If March renews the rally off September's low, the 62% retracement level of the May-September decline crossing at 1.2770 is the next upside target. First resistance is Wednesday's high crossing at 1.2479. Second resistance is the 62% retracement level of the May-September decline crossing at 1.2770. First support is the 20-day moving average crossing at 1.2170. Second support is the November 30th low crossing at 1.1937.
The March Swiss Franc closed lower on Friday as it consolidates some of the rally off November's low. The low-range close sets the stage for a steady to lower opening when Monday's night session begins trading. Stochastics and the RSI are overbought, diverging and are turning neutral to bearish signaling that sideways to lower prices are possible near-term. Closes below the 20-day moving average crossing at 1.07538 would signal that a short-term top has been posted. If March extends the rally off November's low, the 62% retracement level of the 2018-2022 decline crossing at 1.10351 is the next upside target.First resistance is Wednesday's high crossing at 1.09665. Second resistance is the 62% retracement level of the 2018-2022 decline crossing at 1.10351. First support is the 20-day moving average crossing at 1.07538. Second support is the November 30th low crossing at 1.06060.
The March Canadian Dollar closed lower on Friday as it extended the trading range of the past two-weeks. The low-range close sets the stage for a steady to lower opening when Monday's night session begins trading. Stochastics and the RSI are neutral to bearish signaling that sideways to lower prices are possible near-term. If March renews the decline off November's high, the November 3rd low crossing at 72.58 is the next downside target. Closes above the 20-day moving average crossing at 74.03 would confirm that a short-term low has been posted. First resistance is the December 5th high crossing at 74.82. Second resistance is the November 25thhigh crossing at 75.16. First support is today's low crossing at 73.04. Second support is the November 3rd low crossing at 72.58.
The March Japanese Yen posted an inside day with a higher close on Friday as it consolidates some of Thursday's decline. The high-range close sets the stage for a steady to higher opening when Monday’s night session begins trading. Stochastics and the RSI are neutral to bearish signaling that sideways to lower prices are possible near-term. If March extends Thursday's decline, the November 30th low crossing at 0.072510 is the next downside target. If March renews the rally off October's low, the 87% retracement level of the August-October decline crossing at 0.076735 is the next upside target. First resistance is the 75% retracement level of the August-October decline crossing at 0.075398. Second resistance is the 87% retracement level of the August-October decline crossing at 0.076735. First support is the November 30th low crossing at 0.072510. Second support is the November 21st low crossing at 0.071410.
PRECIOUS METALS? http://quotes.ino.com/ex?changes/?c=metals ""
February gold posted an inside day with a higher close on Friday and the high-range close sets the stage for a steady to higher opening when Monday's night session begins trading. Stochastics and the RSI have turning neutral to bearish signaling that sideways to lower prices are possible near-term. Closes below the 20-day moving average crossing at $1785.70 would signal that a short-term top has been posted while opening the door for additional weakness near-term. If February extends the rally off November's low, the 50% retracement level of the March-October decline crossing at $1861.40 is the next upside target. First resistance is Tuesday's high crossing at $1836.90. Second resistance is the 50% retracement level of the March-October decline crossing at $1861.40. First support is the 20-day moving average crossing at $1785.70. Second support is the November 23rd low crossing at $1733.50.
March silver closed slightly higher on Friday as it consolidated some of Thursday's decline. The high-range close sets the stage for a steady to higher opening when Monday's night session begins trading. Stochastics and the RSI are turning neutral to bearish signaling that sideways to lower prices are possible near-term. Closes below the 20-day moving average crossing at 22.496 would confirm that a short-term top has been posted while opening the door for additional weakness near-term. If March extends the rally off October's low, the 75% retracement level of the March-August decline crossing at 24.779 is the next upside target. First resistance is Tuesday's high crossing at 24.390. Second resistance is the 75% retracement level of the March-September decline crossing at 24.779. First support is the 20-day moving average crossing at 21.496. Second resistance is the 50-day moving average crossing at 21.048.
March copper closed slightly higher on Friday. The mid-range close sets the stage for a steady to higher opening when Monday's night session begins trading. However, stochastics and the RSI have turned neutral to bearish signaling that sideways to lower prices are possible near-term. Closes below the 20-day moving average crossing at 3.7517 would signal that a short-term top has been posted. If March renews the rally off September's low, the 50% retracement level of the March-July decline crossing at 4.0343 is the next upside target. First resistance is November's high crossing at 3.9470. Second resistance is the 50% retracement level of the March-July decline crossing at 4.0343. First support is the 20-day moving average crossing at 3.7517. Second support is the 50-day moving average crossing at 3.6150.
GRAINS? http://quotes.ino.com/ex?changes/?c=grains "
March Corn closed down a $0.00 1/2-cent at $6.53.
March corn closed fractionally lower on Friday. The mid-range close sets the stage for a steady to higher opening when Monday's night session begins trading. Stochastics and the RSI are neutral to bullish signaling that sideways to higher prices are possible near-term. Closes above the 20-day moving average crossing at $6.55 3/4 would signal that a short-term low has been posted. If March renews the decline off October's high, the 62% retracement level of the July-October rally crossing at $6.23 is the next downside target. First resistance is the 20-day moving average crossing at $6.55 3/4. Second resistance is the 50-day moving average crossing at $6.73 1/2. First support is last-Wednesday's low crossing at $6.35. Second support is the 62% retracement level of the July-October rally crossing at $6.23.
March wheat closed down $0.03 3/4-cents at $7.53 1/2.
March wheat closed lower on Friday as it extends the trading range of the past two-weeks. The mid-range close sets the stage for a steady to lower opening when Monday's night session begins trading. Stochastics and the RSI are neutral to bullish signaling that sideways to higher prices are possible near-term. Closes above the 20-day moving average crossing at $7.71 1/2 would signal that a short-term low has been posted. If March renews the decline off October's high, the September 9, 2021 low crossing at $6.94 is the next downside target. First resistance is the 20-day moving average crossing at $7.71 1/2. Second resistance is the 50-day moving average crossing at $8.29. First support is the 75% retracement level of the 2018-2022 rally crossing at $7.24 1/4. Second support is the September 9, 2021 low crossing at $6.94.
March Kansas City Wheat closed down $0.16 1/2-cents at $8.44.
March Kansas City wheat closed lower on Friday. The low-range close sets the stage for a steady to lower opening when Monday's night session begins trading. Stochastics and the RSI are turning neutral to bearish signaling that sideways to lower prices are possible near-term. If March renews the decline off October's high, August's low crossing at $8.18 3/4 is the next downside target. Closes above the 20-day moving average crossing at $8.75 3/4 would confirm that a short-term low has been posted. First resistance is the 20-day moving average crossing at $8.75 3/4. Second resistance is the 50-day moving average crossing at $9.20 1/2. First support is last-Tuesday's low crossing at $8.21 3/4. Second support is August's low crossing at $8.18 3/4.
March Minneapolis wheat closed down $0.09 1/4-cents at $9.09 1/2.
March Minneapolis wheat closed lower on Friday. The low-range close sets the stage for a steady to lower opening when Monday's night session begins trading. Stochastics and the RSI are turning neutral to bearish signaling that sideways to lower prices are possible near-term. If March renews the decline off November's high, August's low crossing at $8.75 3/4 is the next downside target. Closes above the 20-day moving average crossing at $9.26 3/4 would signal that a short-term low has been posted. First resistance is the 20-day moving average crossing at $9.26 3/4. Second resistance is the 50-day moving average crossing at $9.52 1/4. First support is last-Tuesday's low crossing at $8.90. Second support is the August's low crossing at $8.75 3/4.
SOYBEAN COMPLEX? http://quotes.ino.com/ex?changes/?c=grains "
January soybeans closed up $0.06 1/2-cents at $14.80.
January soybeans closed higher on Friday as it extends this week's trading range. The high-range close sets the stage for a steady to higher opening when Monday's night trade begins. Stochastics and the RSI are neutral signaling that sideways trading is possible near-term. Closes below the 20-day moving average crossing at $14.56 1/2 would signal that a short-term top has been posted. If January extends the rally off October's low, September's high crossing at $15.12 1/4 is the next upside target. First resistance is the September 21st high crossing at $14.93 1/2. Second resistance is September's high crossing at $15.12 1/4. First support is the 20-day moving average crossing at $14.56 1/2. Second support is the 50-day moving average crossing at $14.31 3/4.
January soybean meal closed up $7.70 at $463.00.
January soybean meal closed higher on Friday as it extended the rally off Monday's low. The high-range close sets the stage for a steady to higher opening when Monday's night session begins trading. Stochastics and the RSI are turning neutral to bullish signaling that sideways to higher prices are possible near-term. If January renews the rally off October's low, monthly support on the continuation chart crossing at $478.60 is the next upside target. Closes below Monday's low crossing at $448.60 would signal that a short-term top has been posted. First resistance is last-Friday's high crossing at $474.40. Second resistance is monthly resistance crossing at $478.60. First support is Monday's low crossing at $448.60. Second support is the 20-day moving average crossing at $433.70.
January soybean oil closed down 46-pts. At 63.36.
January soybean oil closed lower on Friday. The mid-range close sets the stage for a steady to lower opening when Monday's night session begins trading. Stochastics and the RSI are neutral to bullish signaling that sideways to higher prices are possible near-term. If January extends this week's rally, the 20-day moving average crossing at 66.53 is the next upside target. If January renews the decline off November's high, the 87% retracement level of the July-November rally crossing at 57.11 is the next downside target. First resistance is Wednesday's high crossing at 64.76. Second resistance is the 20-day moving average crossing at 66.53. First support is the 75% retracement level of the July-November rally crossing at 59.72. Second support is the 87% retracement level of the July-November rally crossing at 57.11.
LIVESTOCKhttp://quotes.ino.com/exchanges/?c=livestock
February hogs closed up $4.13 at $85.78.
February hogs closed sharply higher on Friday as it consolidated some of the decline off December's high. The high-range close sets the stage for a steady to higher opening when Monday's session begins trading. Stochastics and the RSI are oversold but are turning neutral to bullish signaling that sideways to higher prices are possible near-term. Closes above the 50-day moving average crossing at $87.11 would signal that a short-term low has been posted. If February extends the decline off November's high, the 75% retracement level of the October rally crossing at $80.25 is the next downside target. First resistance is the 20-day moving average crossing at $86.65 Second resistance is the 50-day moving average crossing at $87.11. First support is Thursday's low crossing at $81.53. Second support is the 75% retracement level of the October rally crossing at $80.25.
February cattle closed up $0.93 at $155.78.
February cattle closed higher on Friday and filled Thursday's gap pausing the decline off Tuesday's high. The high-range close sets the stage for a steady to higher opening on Monday. Stochastics and the RSI are neutral to bearish signaling that sideways to lower prices are possible near-term. Closes below the 50-day moving average crossing at $154.65 would signal that a short-term top has been posted. If February renews this month's rally. November's high crossing at $156.95 is the next upside target. First resistance is Tuesday's high crossing at $156.78. Second resistance is November's high crossing at $156.95. First support is the 50-day moving average crossing at $154.65. Second support is the December 7th low crossing at $152.75.
January Feeder cattle closed up $1.05 at $184.10.
January Feeder cattle closed higher on Friday as it extended this week's trading range. The high-range close sets the stage for a steady to higher opening when Monday's session begins trading. Stochastics and the RSI are overbought but remain neutral to bullish signaling that sideways to higher prices are possible near-term. If January extends the rally off the November 28th low, the 75% retracement level of the August-October decline crossing at $187.00 is the next upside target. Closes below the 20-day moving average crossing at $181.70 would signal that a short-term top has been posted. First resistance is the 62% retracement level of the August-October decline crossing at $184.56. Second resistance is the 75% retracement level of the August-October decline crossing at $187.00. First support is the 20-day moving average crossing at $181.70. Second support is the 50-day moving average crossing at $180.01.
FOOD & FIBERhttp://quotes.ino.com/ex changes/?c=food
March coffee posted a key reversal down as it closed lower on Friday as it consolidated some of this week's rally. The low-range close sets the stage for a steady to lower opening on Monday. Stochastics and the RSI are overbought but are turning neutral to bearish signaling sideways to lower prices are possible near-term. If March renews the decline off August's high, November's low crossing at $15.41 is the next downside target. Closes above the 50-day moving average crossing at $17.31 would open the door for additional gains near-term. First resistance is the 50-day moving average crossing at $17.31. Second resistance is November's high crossing at $17.82. First support is November's low crossing at $15.41. Second support is the 75% retracement level of the 2020-2022 rally crossing at $14.74.
March cocoa closed sharply lower on Friday. The low-range close sets the stage for a steady to lower opening on Monday. Stochastics and the RSI are neutral to bearish signaling sideways to lower prices are possible near-term. Closes below last-Monday's low crossing at 24.70 would signal that a short-term top has been posted. If March resumes the rally off the November 23rd low, November's high crossing at 25.77 is the next upside target.
March sugar closed higher on Friday. The mid-range close sets the stage for a steady to higher opening on Monday. Stochastics and the RSI are turning neutral to bearish signaling that sideways to lower prices are possible near-term. If March extends the aforementioned rally, monthly resistance on the monthly continuation chart crossing at 22.64 is the next upside target. Closes below Tuesday's low crossing at 19.31 would signal that a short-term top has been posted.
March cotton closed higher on Friday. The high-range close sets the stage for a steady to higher opening on Monday. Stochastics and the RSI are neutral to bullish signaling that sideways to higher prices are possible near-term. If March renews the rally off October's low, November's high crossing at 89.92 is the next upside target. If March extends this month's decline, the November 28th low crossing at 77.50 is the next downside target.
Thanks tallpine!
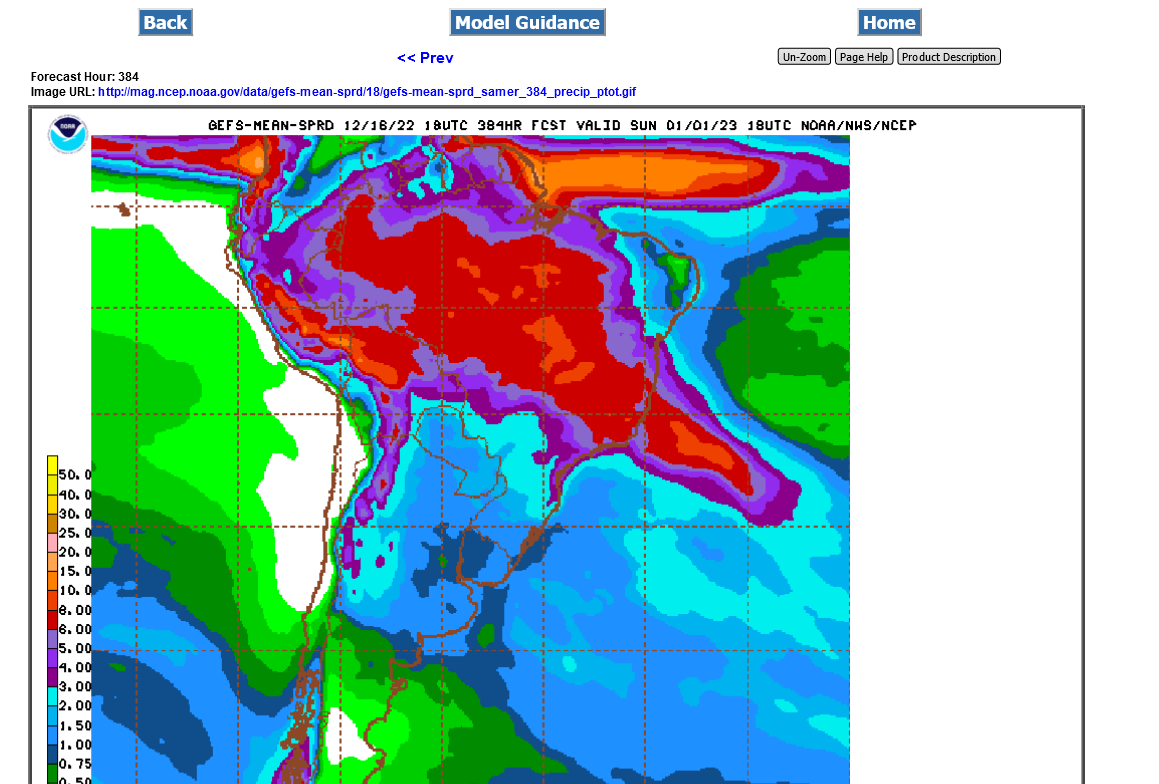
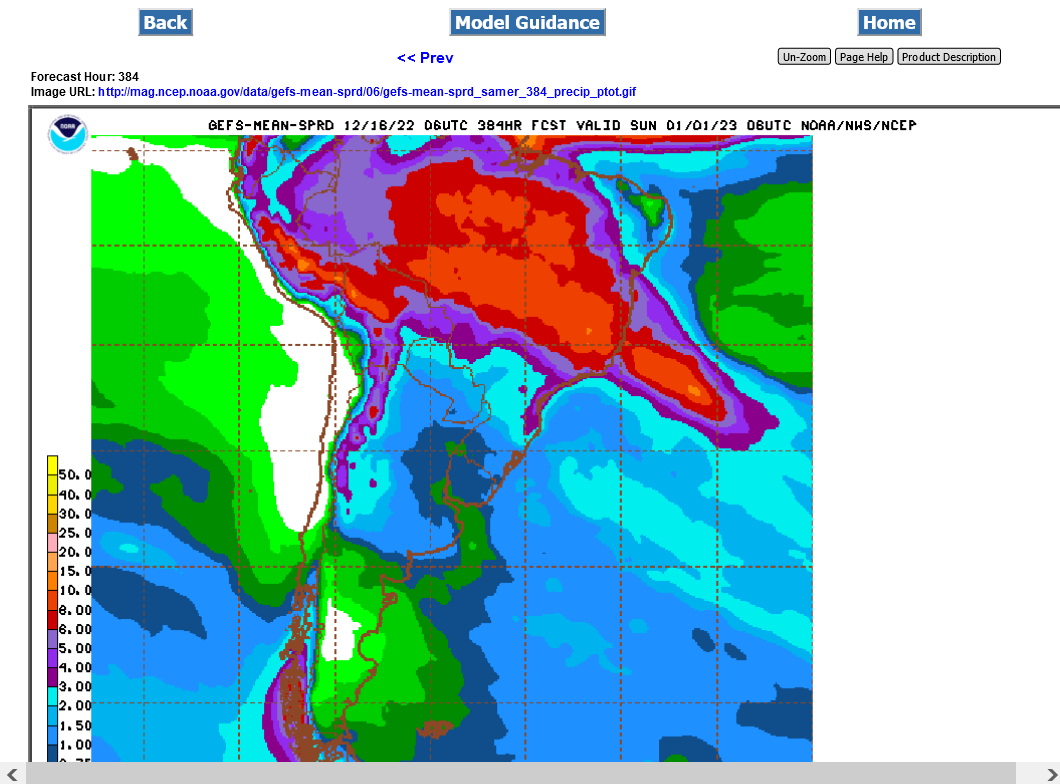
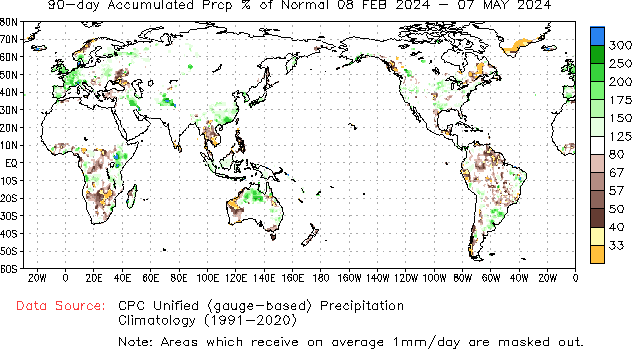
Still below normal rains for most of the Argentina beans and good rains for much of Brazil.........but NOT S.Brazil.
Just out 18z GEFS mean.
This was the 6z run from 12 hours earlier:
https://mag.ncep.noaa.gov/Image.php
https://www.cpc.ncep.noaa.gov/products/Precip_Monitoring/Figures/global/n.90day.figb.gif
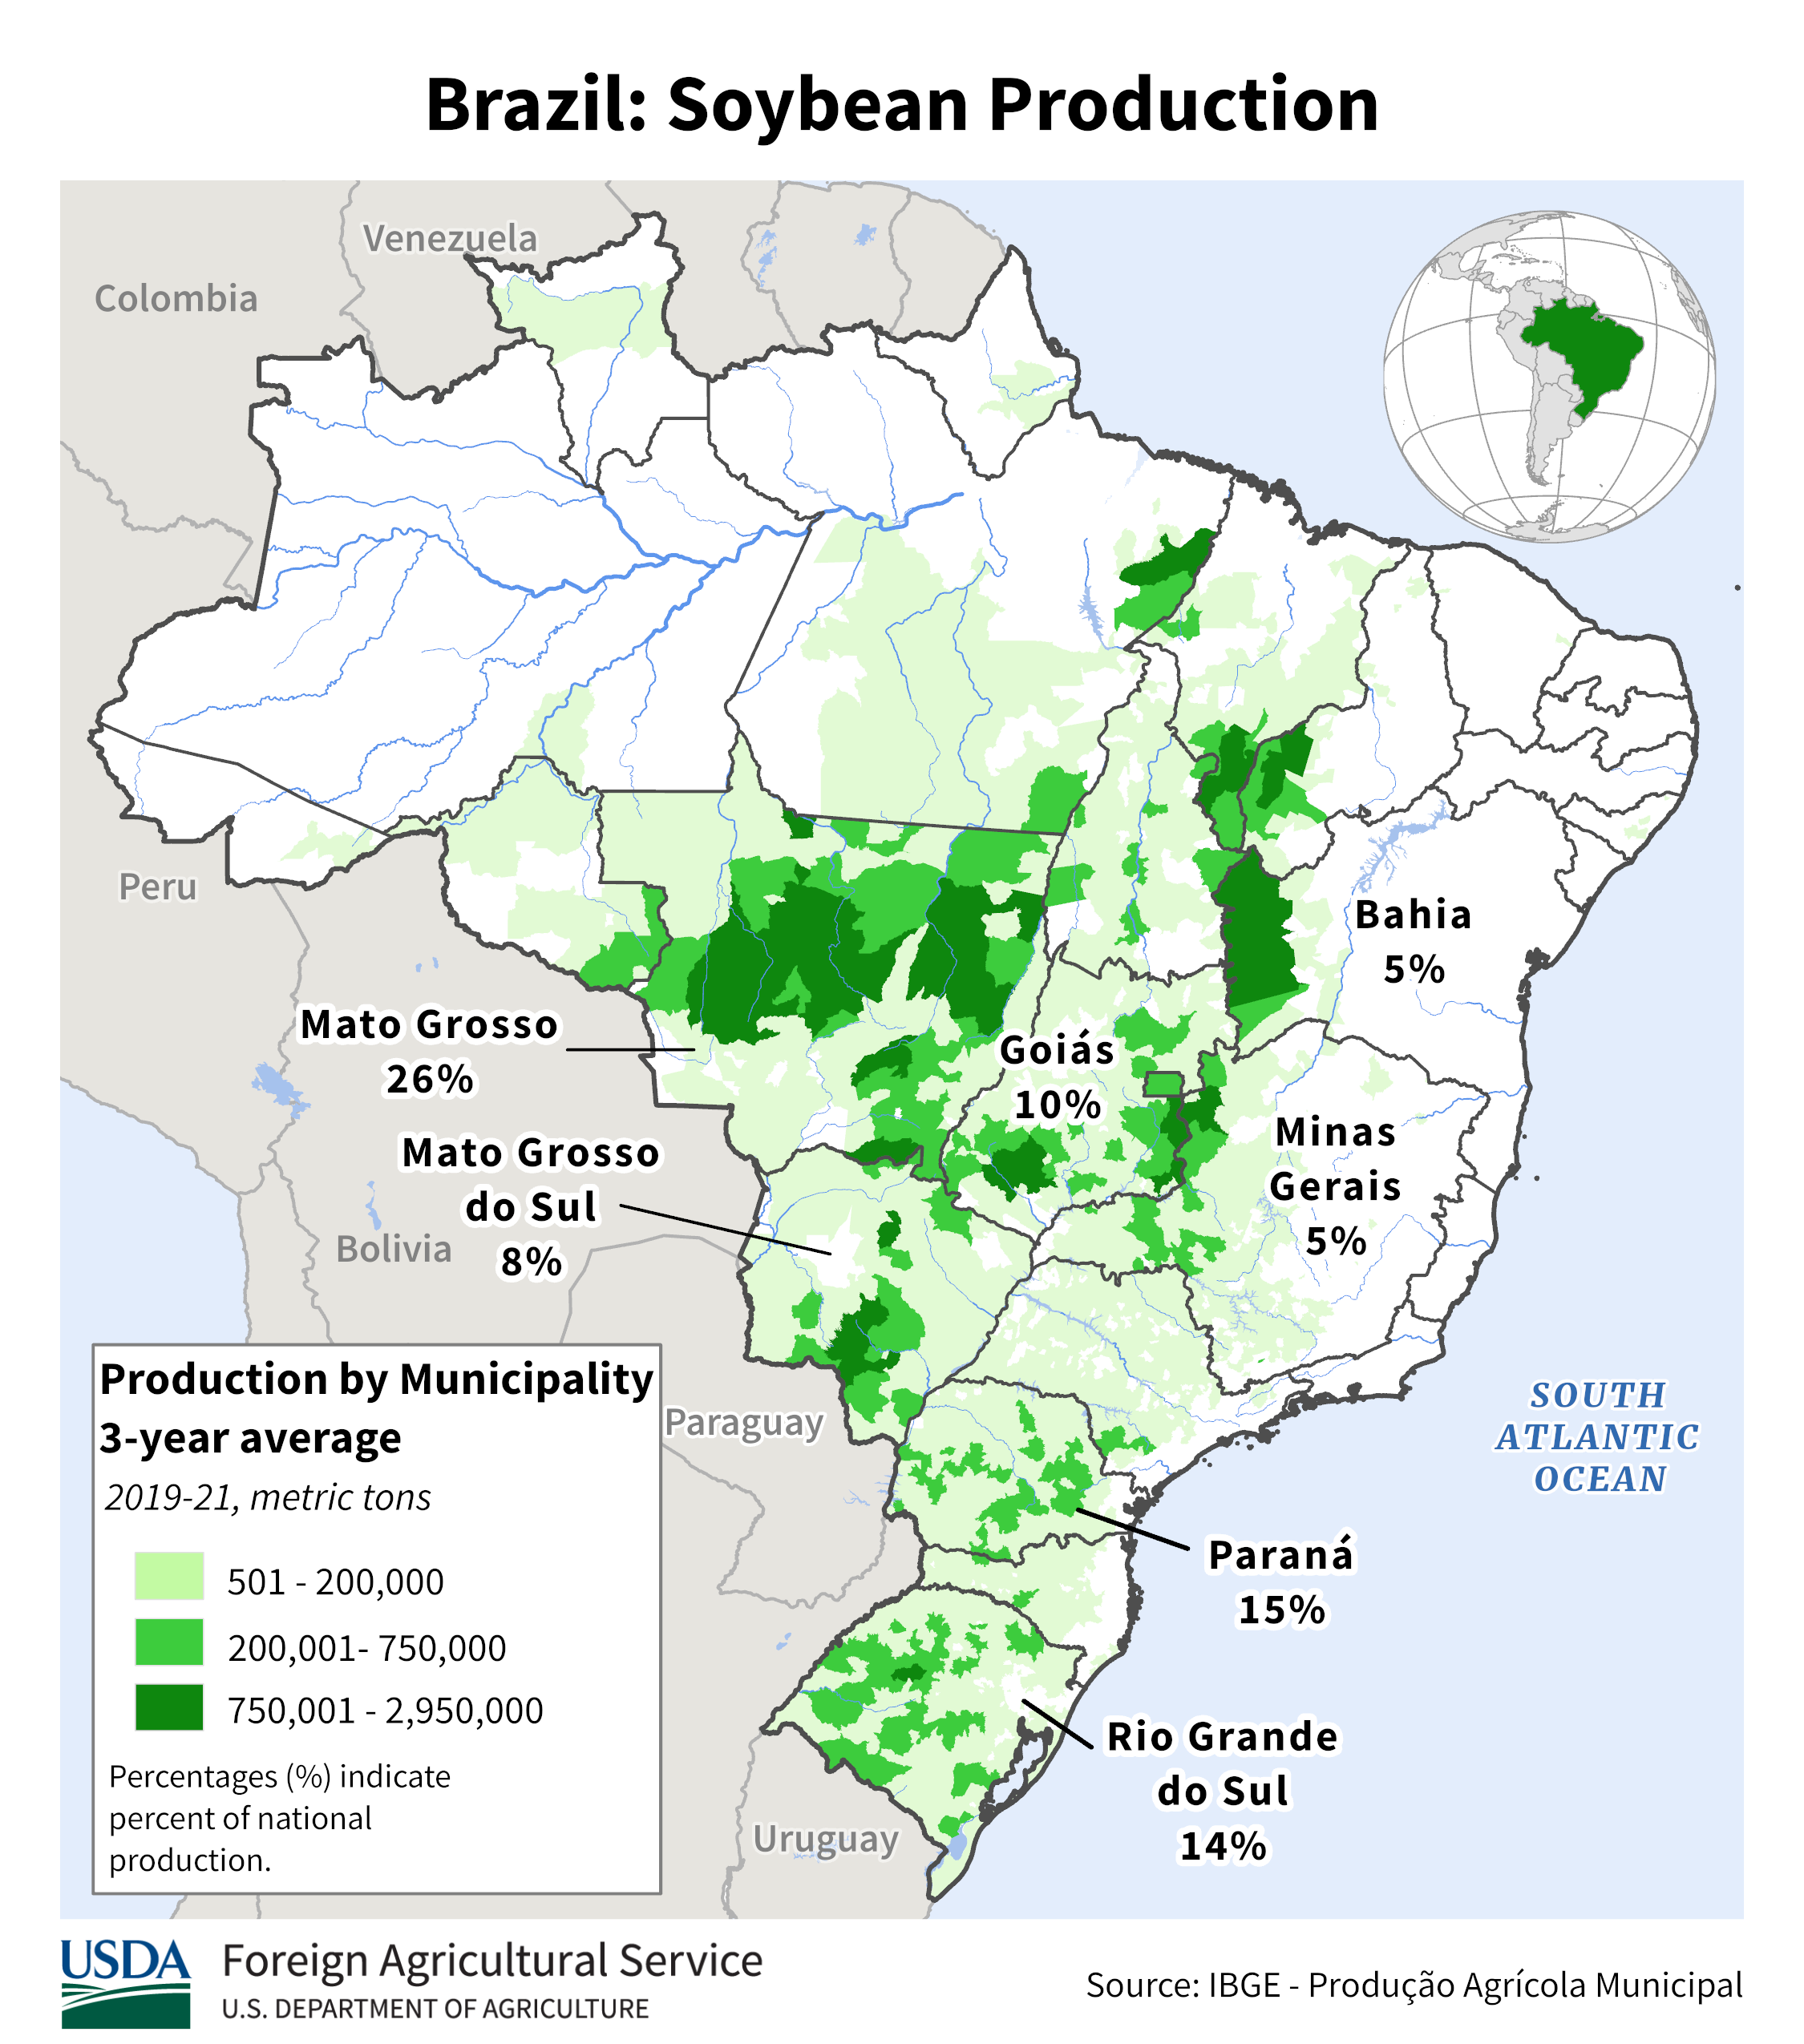
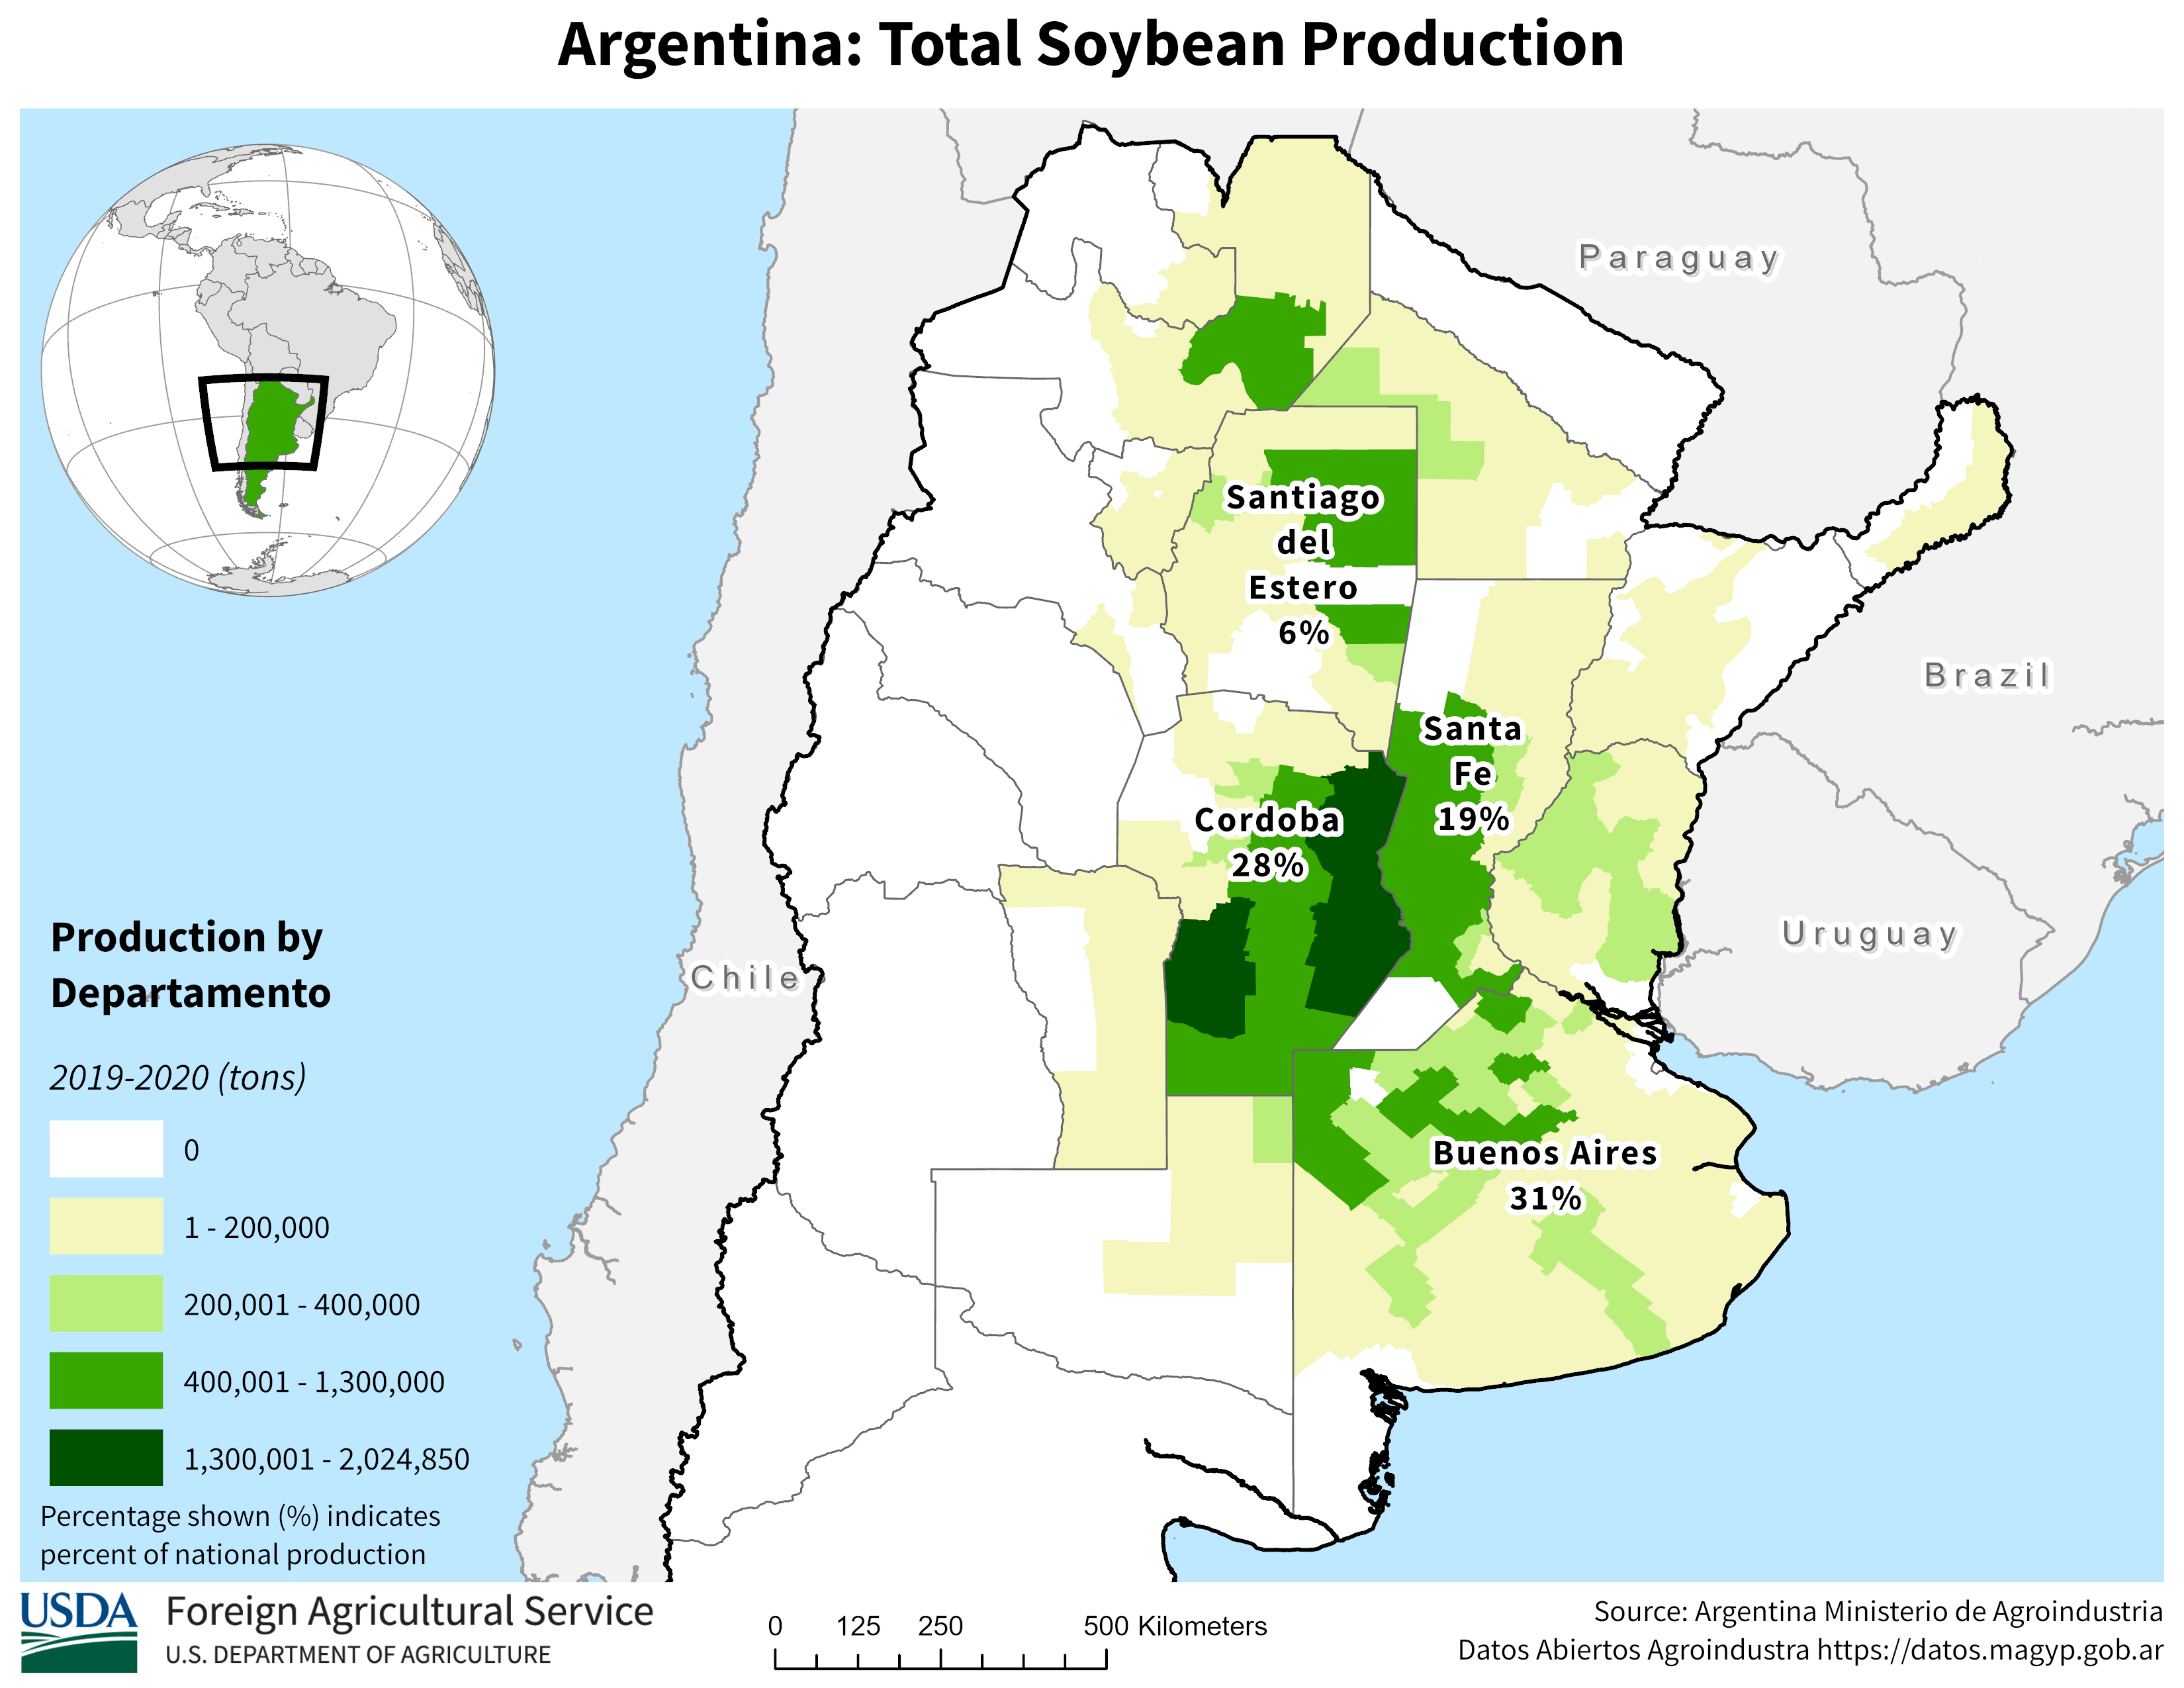
South America soybean production below
https://ipad.fas.usda.gov/rssiws/al/ssa_cropprod.aspx

https://ipad.fas.usda.gov/rssiws/al/crop_production_maps/Brazil/Municipality/Brazil_Soybean.png