Thanks, bear.
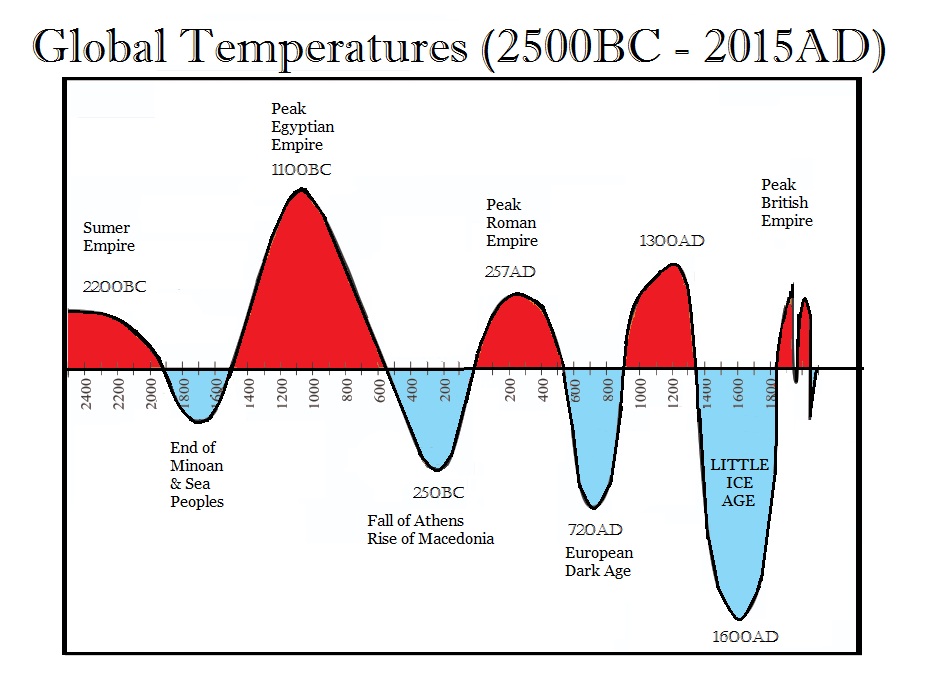
and that graph doesn't go back to the warmest period of all during human existence.
from 9,000 to 5,000 years ago, during the Holocene climate optimum, it was 2 deg. C warmer than this in the higher latitudes with less Arctic sea ice…..and polar bears doing just fine!
https://en.wikipedia.org/wiki/Holocene_climatic_optimum
Of 140 sites across the western Arctic, there is clear evidence for conditions that were warmer than now at 120 sites. At 16 sites for which quantitative estimates have been obtained, local temperatures were on average 1.6±0.8 °C higher during the optimum than now. Northwestern North America reached peak warmth first, from 11,000 to 9,000 years ago, but the Laurentide Ice Sheet still chilled eastern Canada. Northeastern North America experienced peak warming 4,000 years later. Along the Arctic Coastal Plain in Alaska, there are indications of summer temperatures 2–3 °C warmer than now.[9] Research indicates that the Arctic had less sea ice than now.[10]
Scroll down for overwhelming authentic paleo-climatology evidence before climate science was hijacked:
https://www.armstrongeconomics.com/world-news/climate/why-climate-change-is-a-fraud/
This is their graph. The last warm period is the Medieval Warm Period(Optimum).
++++++++++++++++++++++
Was the Medieval WARM Period real?
See for yourself below.
For the Medieval Warm Period compared to today below:
Red balloons showed it was warmer.
Blue was colder than today(in that study)
Green was wetter/more precip
Yellow was drier
https://wattsupwiththat.com/2017/01/03/documenting-the-global-extent-of-the-medieval-warm-period/

If you go to the link below, you can hit those individual balloons and get each individual study:
+++++++++++++
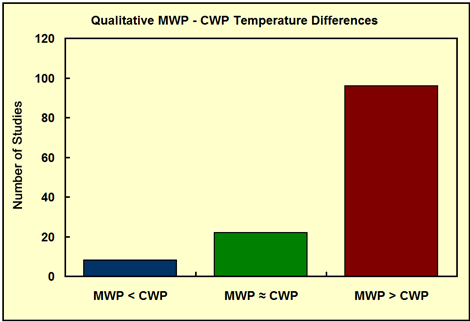
Over 100 studies from the Medieval Warm Period, most of which show the planet was this warm or warmer 1,000 years ago. It was also this warm 2,000 years ago during the Roman Warm Period and also just over 3,000 years ago, during the Minoan Warm period. Medieval Warm Period Project: http://www.co2science.org/data/mwp/mwpp.php
 Where did the data from the bar graphs above come from so that we know that this is the authentic science vs the one that the MSM and dems describe with the fake climate crisis(where they can't show the data to prove)? List of Scientists Whose Work We Cite: http://www.co2science.org/data/mwp/scientists.php List of Research Institutions Associated With the Work We Cite http://www.co2science.org/data/mwp/institutions.php | Sept. 5, 2021, 2 a.m. | ||