For weather that effects the natural gas market(Cooling Degree Days in the Summer help gauge residential natural gas use because natural gas is used to generate electricity for air conditioning:
From Natural Gas Intelligence:
Lean EIA Storage Data Expected as August Natural Gas Called Higher
From metmike: Weather, especially weeks 3-4 does not look as hot this morning, so we are on the lows right now 2.751 for Sept ng.
for week ending July 13, 2018 | Released: July 19, 2018 at 10:30 a.m. | Next Release: July 26, 2018
| Working gas in underground storage, Lower 48 states Summary textCSVJSN | |||||||||||||||||||||||||
|---|---|---|---|---|---|---|---|---|---|---|---|---|---|---|---|---|---|---|---|---|---|---|---|---|---|
| Historical Comparisons | |||||||||||||||||||||||||
| Stocks billion cubic feet (Bcf) | Year ago (07/13/17) | 5-year average (2013-17) | |||||||||||||||||||||||
| Region | 07/13/18 | 07/06/18 | net change | implied flow | Bcf | % change | Bcf | % change | |||||||||||||||||
| East | 507 | 480 | 27 | 27 | 606 | -16.3 | 613 | -17.3 | |||||||||||||||||
| Midwest | 501 | 477 | 24 | 24 | 731 | -31.5 | 666 | -24.8 | |||||||||||||||||
| Mountain | 144 | 143 | 1 | 1 | 194 | -25.8 | 171 | -15.8 | |||||||||||||||||
| Pacific | 259 | 260 | -1 | -1 | 292 | -11.3 | 309 | -16.2 | |||||||||||||||||
| South Central | 838 | 843 | -5 | -5 | 1,136 | -26.2 | 1,025 | -18.2 | |||||||||||||||||
| Salt | 230 | 238 | -8 | -8 | 320 | -28.1 | 291 | -21.0 | |||||||||||||||||
| Nonsalt | 608 | 605 | 3 | 3 | 816 | -25.5 | 734 | -17.2 | |||||||||||||||||
| Total | 2,249 | 2,203 | 46 | 46 | 2,959 | -24.0 | 2,784 | -19.2 | |||||||||||||||||
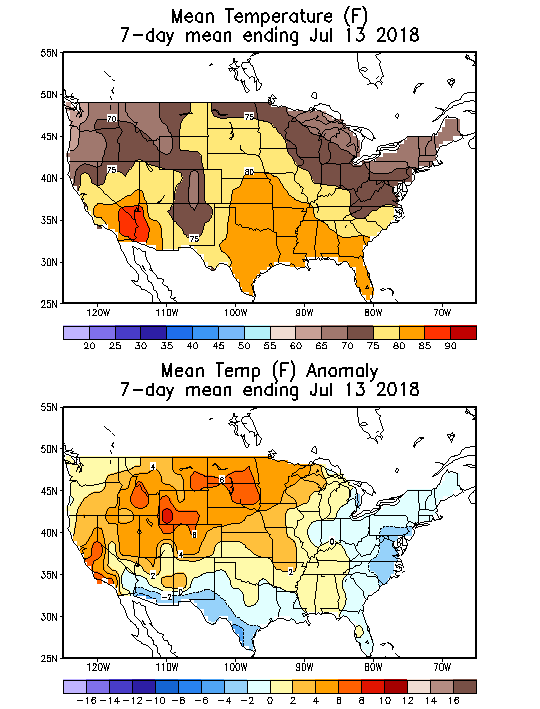
One good way to help estimate the next EIA number is to look at the previous one and see what the temperatures were like during the 7 day period used for that report.....................then, see what the temperatures were like for the next 7 day period which will be used this next report, tomorrow:
These temperatures below cover the period for this last EIA report.
This was the 7 day period that was covered for the last EIA report:
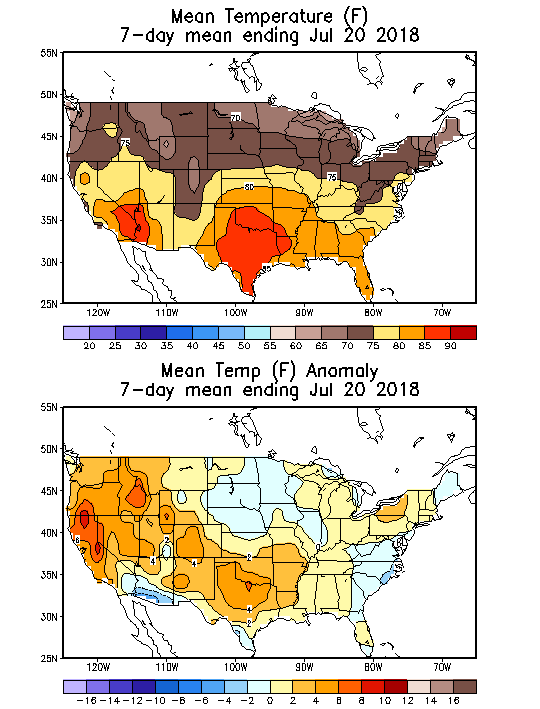
These were the temperatures for the 7 day period which passed for this coming Thursday's EIA ng storage report:
Seasonals based on historical prices..........this graph is pretty old.

Big drawdown in SouthCentral from the intense heat in TX last week.
| Working gas in underground storage, Lower 48 states Summary text CSV JSN | |||||||||||||||||||||||||
|---|---|---|---|---|---|---|---|---|---|---|---|---|---|---|---|---|---|---|---|---|---|---|---|---|---|
| Historical Comparisons | |||||||||||||||||||||||||
| Stocks billion cubic feet (Bcf) | Year ago (07/20/17) | 5-year average (2013-17) | |||||||||||||||||||||||
| Region | 07/20/18 | 07/13/18 | net change | implied flow | Bcf | % change | Bcf | % change | |||||||||||||||||
| East | 527 | 507 | 20 | 20 | 624 | -15.5 | 630 | -16.3 | |||||||||||||||||
| Midwest | 524 | 501 | 23 | 23 | 742 | -29.4 | 686 | -23.6 | |||||||||||||||||
| Mountain | 145 | 144 | 1 | 1 | 197 | -26.4 | 174 | -16.7 | |||||||||||||||||
| Pacific | 257 | 259 | -2 | -2 | 294 | -12.6 | 311 | -17.4 | |||||||||||||||||
| South Central | 820 | 838 | -18 | -18 | 1,122 | -26.9 | 1,028 | -20.2 | |||||||||||||||||
| Salt | 214 | 230 | -16 | -16 | 310 | -31.0 | 286 | -25.2 | |||||||||||||||||
| Nonsalt | 606 | 608 | -2 | -2 | 813 | -25.5 | 741 | -18.2 | |||||||||||||||||
| Total | 2,273 | 2,249 | 24 | 24 | 2,978 | -23.7 | 2,830 | -19.7 | |||||||||||||||||
After the release of the bullish surprise storage number, natural gas September contract, went from its lows 2.749 to within 1 tick of its overnight highs 2.778.
Natural Gas August contract expires tomorrow.
This was the note from Natural Gas Intelligence:
Another Bullish Miss in EIA Storage Report Leads to Modest Rally
Some of the models this afternoon from the 12z runs look cooler to me(European and Canadian) which is why I think that natural gas has settled back closer to its lows and right around the key technical level............last weeks highs.
Another item is that this bullish surprise, partly came as a result of a big drawdown from the record heat in TX.
That's something like 3 or 4 bullish EIA reports in a row now.............we should be breaking out to the upside, right?
However, the Midwest/East and TX has been cooler this week and the Midwest has a week of BELOW temps coming up, so the next 2 EIA numbers will, with 100% confidence be much higher builds.
In other words, the market knows that the mega bullish EIA numbers have passed. Still its amazing that this did not send natural gas to $3 recently. There are some sources that believe that massive supply is about to hit the market and injections will be huge.
Maybe that explains it. However, if weather maps get hot again for the Midwest/East, , I will be long.
Closing comments from Natural Gas Intelligence:
Eyes on Production as Natural Gas Market Shrugs Off Bullish EIA Data
5:40 PM
With bearish production pressuring prices, the natural gas futures market brushed aside another leaner-than-expected build from the Energy Information Administration (EIA) Thursday that showed deficits growing as August approaches. In the spot market, Southern California and Desert Southwest points continued to trade at elevated levels as conditions in the region remain hot; the NGI National Spot Gas Averagefinished even at $2.91/MMBtu.
Another way to think of it, may be that its the 2nd half of Summer and the climatologically hottest average temperatures have past.
So heat in August, if it happens will be waning and temporary and its only a matter of time before the suns lowering angle causes cooler temps and increasing injections.
This is only presenting the bearish spin version to be objective.
If August turns hot, I still want to be long.