This is an extremely unusual year though and it will totally depend on the weather. We have alot of risk premium in the crop already, with low stocks and a well known forecast of hot/dry for the upcoming growing season.......so I wouldn't be long in June if the weather is favorable.
On the other hand, forecasts for heat and not much rain in any 2 week forecasts/models in June , will cause limit up moves.
https://farms.extension.wisc.edu/articles/seasonal-grain-price-patterns/
https://farm.unl.edu/crop-price-patterns
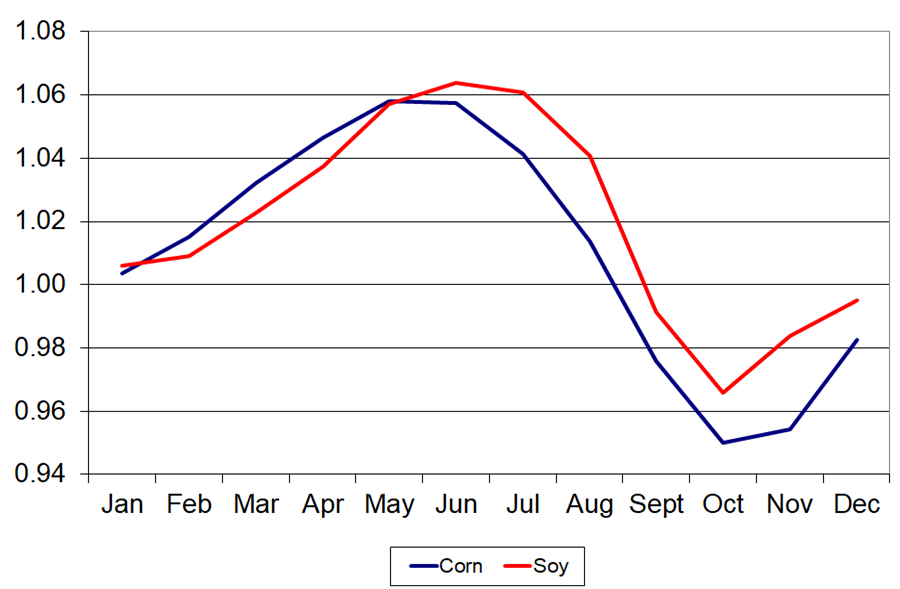
While the price of corn, soybeans and winter wheat varies from year to year, historical price patterns can be mapped for each commodity. A historical price pattern indicates seasonal trends due to historical price behavior. This article will discuss price patterns for corn, soybeans and winter wheat and how they can assist farmers in establishing price increase expectations and sell by dates when marketing grain.
Figure 3, New crop closing price index for winter wheat, 1995/96-2014/15

Ukraine/Russia exports
Started by metmike - May 13, 2022, 1:38 p.m.
https://www.marketforum.com/forum/topic/84392/
https://www.marketforum.com/forum/topic/84392/#84397
Re: Re: Re: Re: Ukraine/Russia exports
By metmike - May 13, 2022, 2:26 p.m.
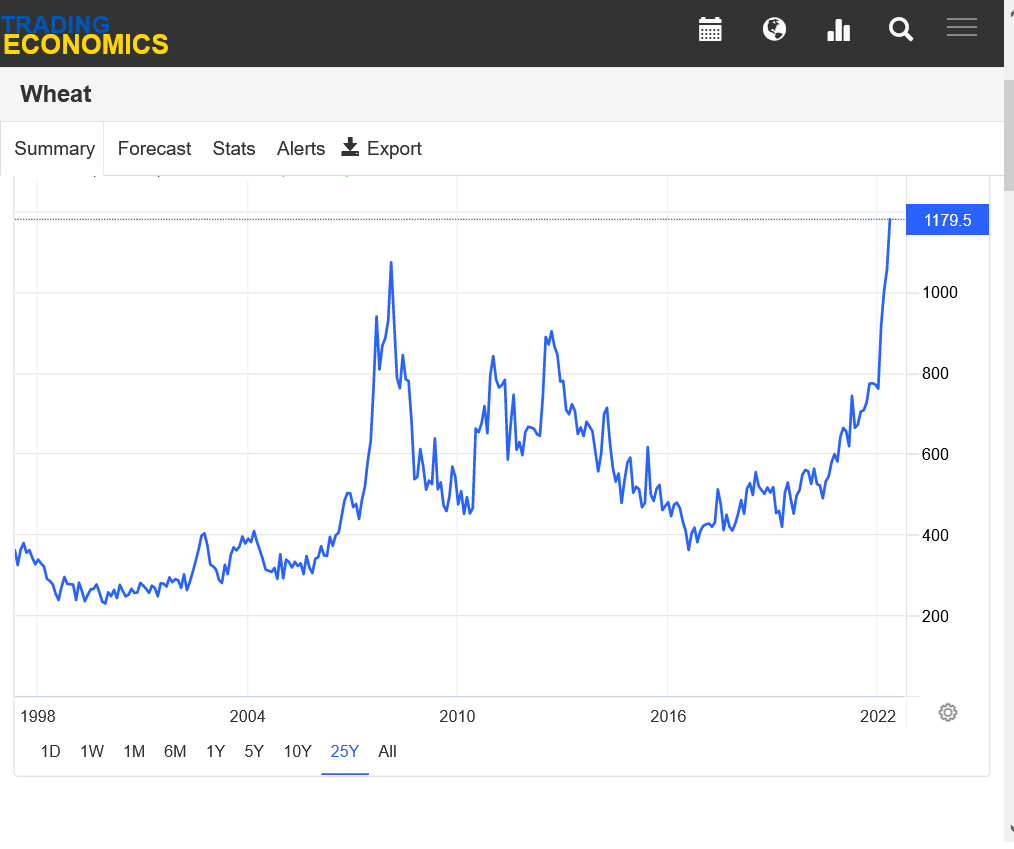
Price charts of wheat in the futures market:
https://tradingeconomics.com/commodity/wheat
25 year chart. We took out the 2008 highs recently.
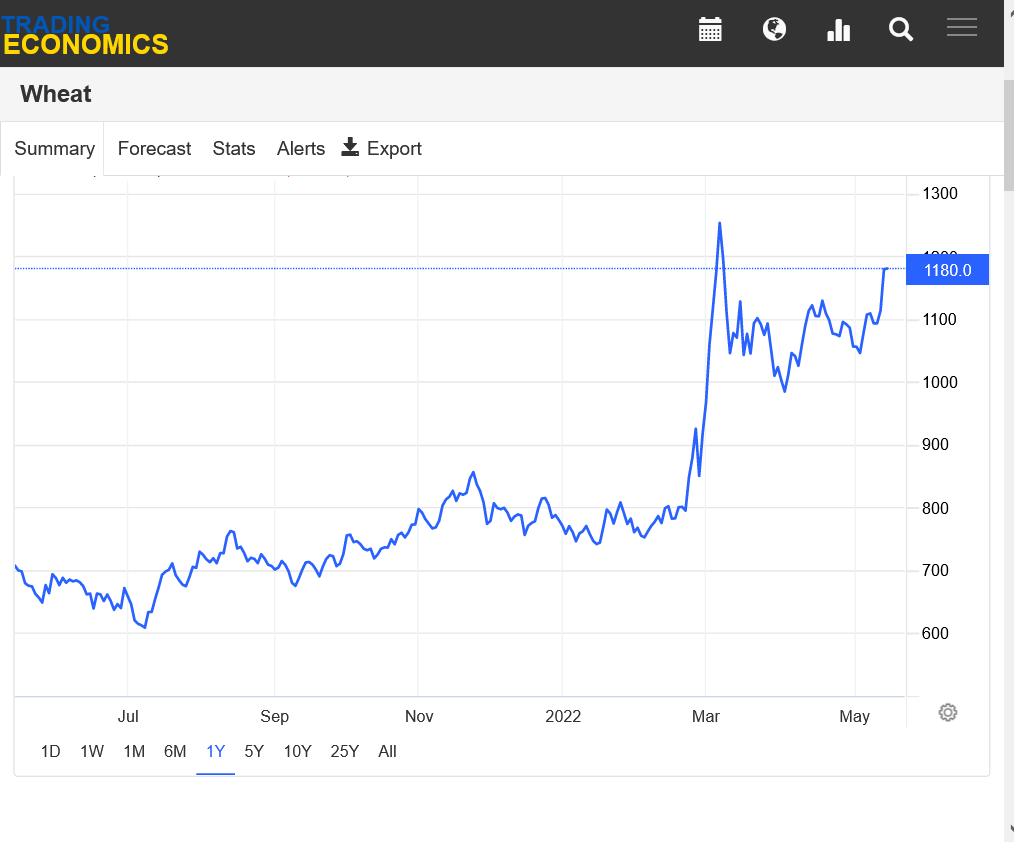
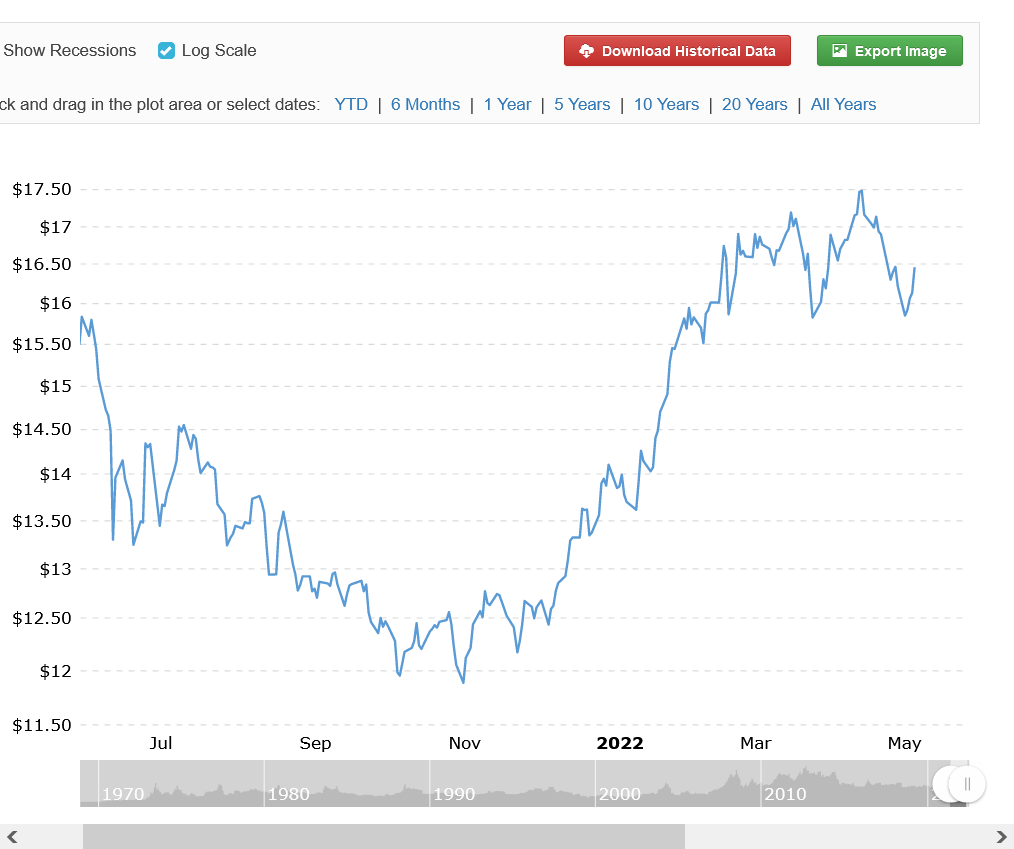
 1 year chart below. We were very high priced, historically already(because of low global stocks), then you can see the extreme upward spike that occurred right after the invasion by Putin...adding around $3 in a flash, to all time record high prices, then holding most of those gains.
We are threatening to take out the contract highs set right after the invasion.
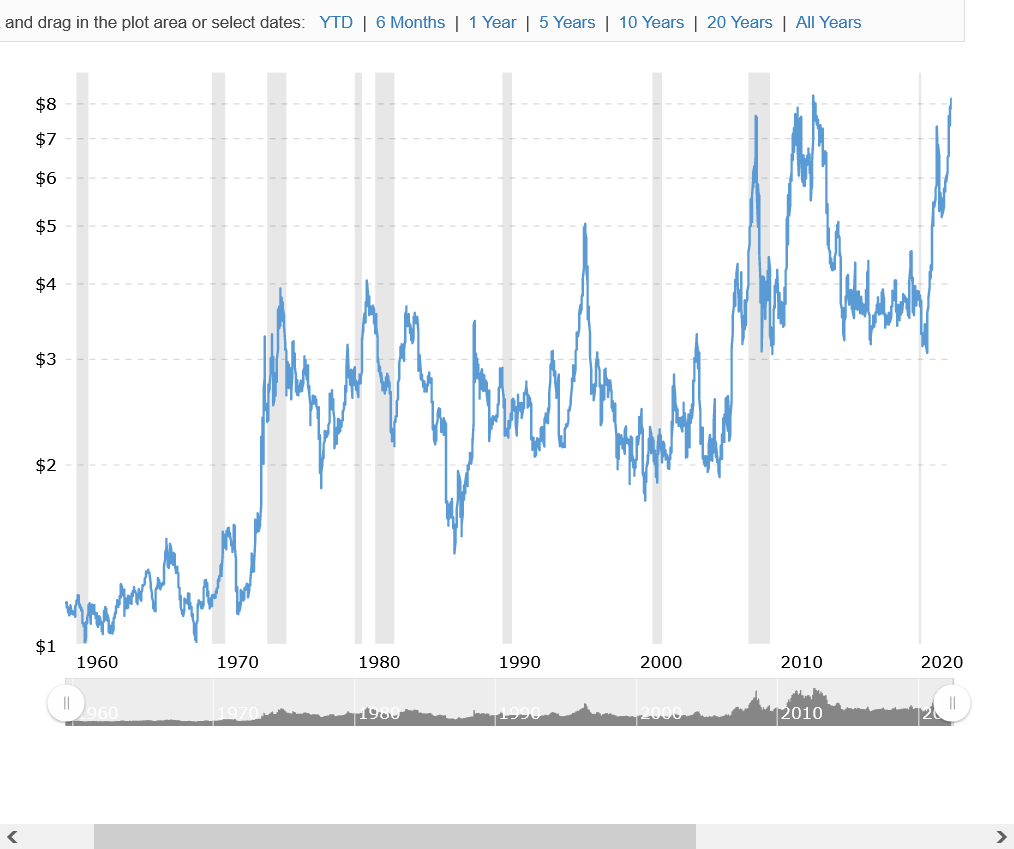
https://www.macrotrends.net/2532/corn-prices-historical-chart-data
Price of corn below, 60+ years. We are currently just below $8, just below the all time highs of $8.24 set in July 2012, from the last widespread, severe Cornbelt drought.
We were almost this high in July 2011 and June/July 2008 from flooding events and low stocks. Corn prices were catapulted to a new trading range after billions of bushels of ethanol demand was added. $3+ since then. Electric vehicles do NOT use ethanol. If we went all electric vehicles, corn prices would likely trade below $3 again. But we WON'T ever do this using just solar and wind. Please get that ridiculous hoax out of your head.
5 year chart of front month corn below. Can you see the Putin price hike? No. Prices were already in this uptrend for 2 years. In the next chart, however it will be more clear.
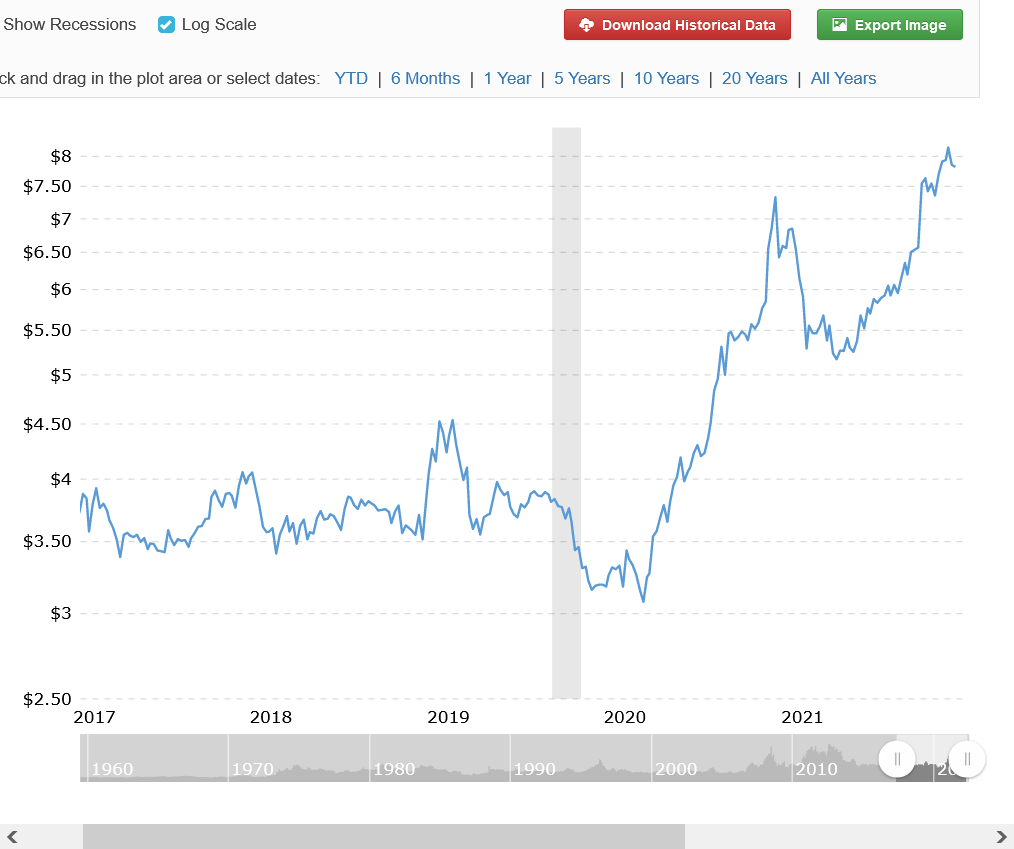
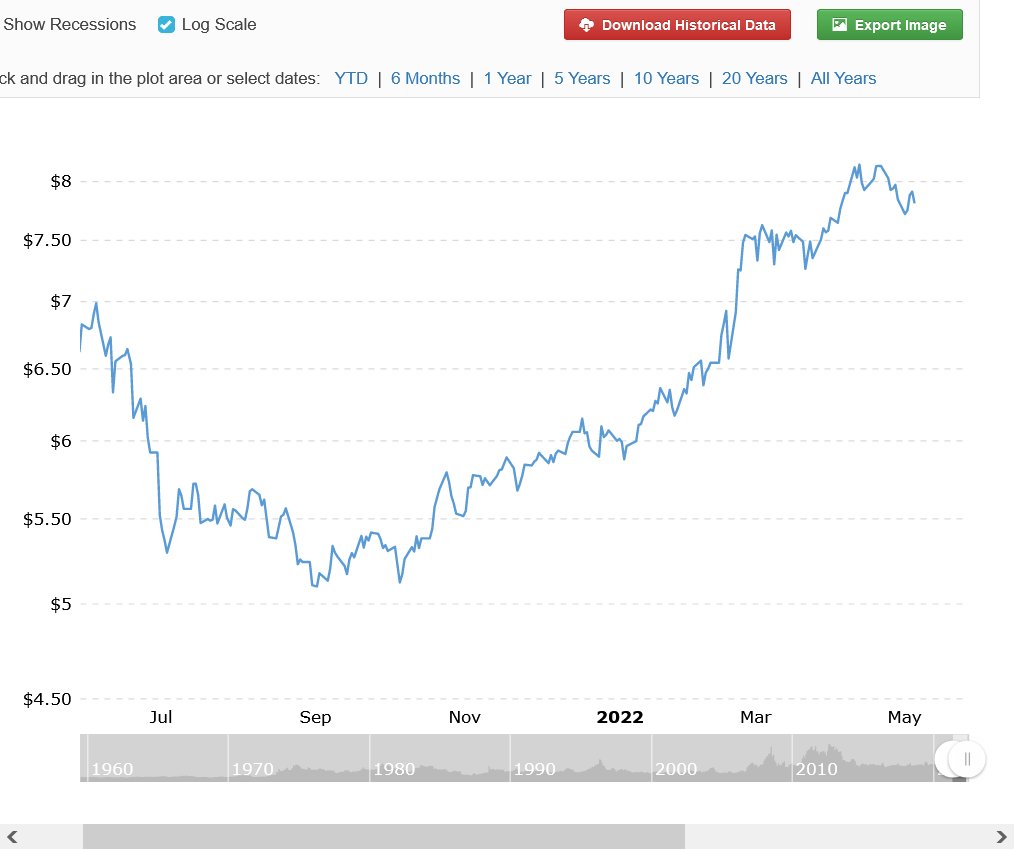
In this 1 year chart below, you can see that when Putin invaded the Ukraine on Feb 24, 2022, corn was trading just below $7. One can make a case for some of the current spike higher of almost $1 is because of that(in sympathy of wheat prices that spiked even more and also took wheat out of the animal feed sector which competes with corn)
https://www.macrotrends.net/2531/soybean-prices-historical-chart-data
Soybeans have a similar pattern to corn going back over 60 years. It's high was a month after corn, in AUGUST, from the 2012 drought(beans often top later in the Summer) at $17.38. We were not far from this in 2008 and are not far from it now.
Because bean acres compete with corn, when ethanol massively increased corn demand, it took away millions of acres used to grow beans......so bean prices also had a new floor under prices in the AFTER ethanol years........$8!
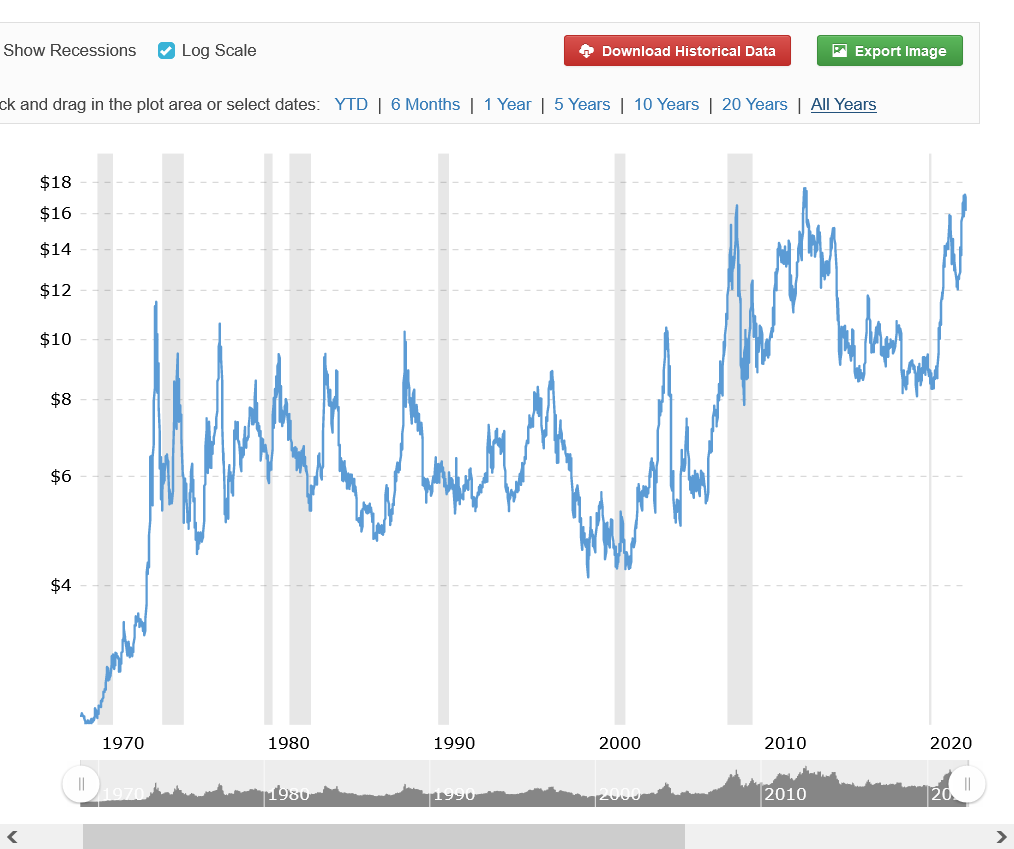
Here's the 5 year chart of soybeans below. See the Putin price hike? Let's look closer.
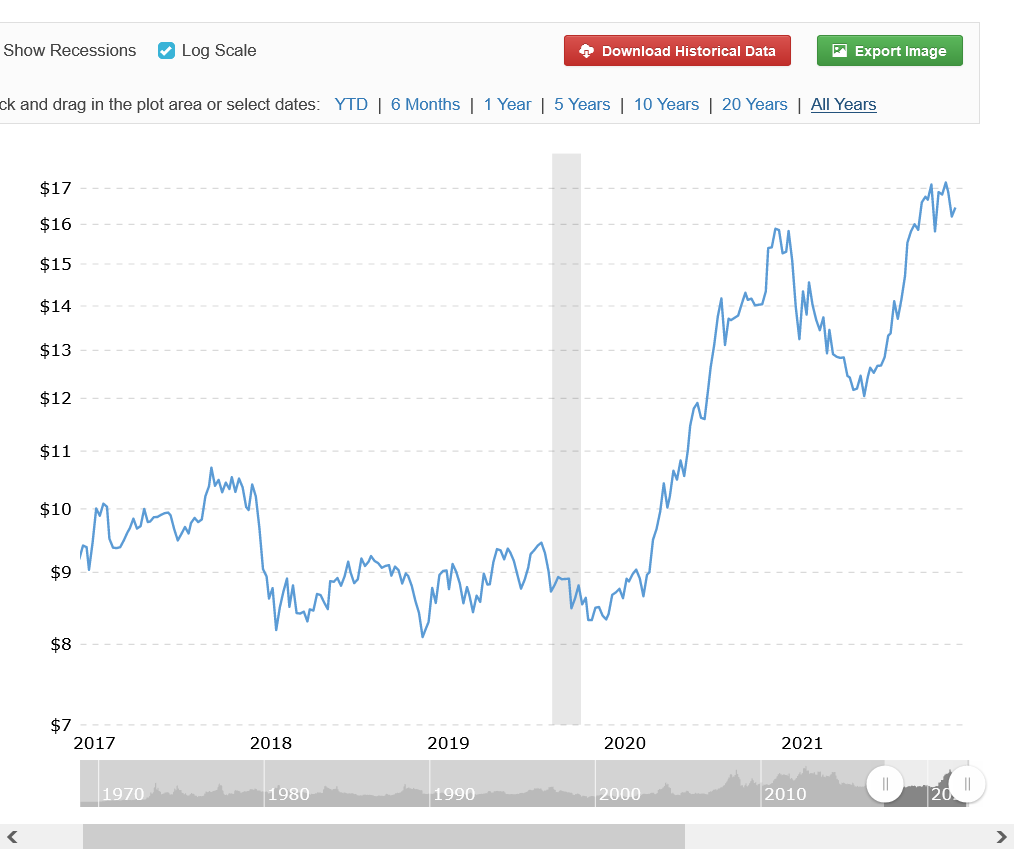
Here's the 1 year chart of beans below. Before Putin invaded, beans had already traded to almost $17 and WAS LEADING corn and bean prices higher.
After the invasion on Feb 24, 2022, WHEAT HAS BEEN THE CLEAR LEADER. Despite the huge rally yesterday, bean prices are actually a tad LOWER than they were the day Putin invaded Ukraine. So there is not much Putin price hike in soybeans.
Summarizing the reality.
The Putin price hike for wheat has been $3....because of lost wheat to the global market.
The Putin price hike for corn has been $1
There is not much Putin price hike for soybeans.
Thanks for posting all that information Mike, that’s great stuff!
You're very welcome Jim!
This is the crop that was planted last Fall and will be harvested, starting next month.
Current crop ratings are close to the worst ever because of the drought in the S.Plains.
https://www.nass.usda.gov/Charts_and_Maps/Crops_County/ww-pl.php

This is the crop that is still being planted and will be harvested this Fall:
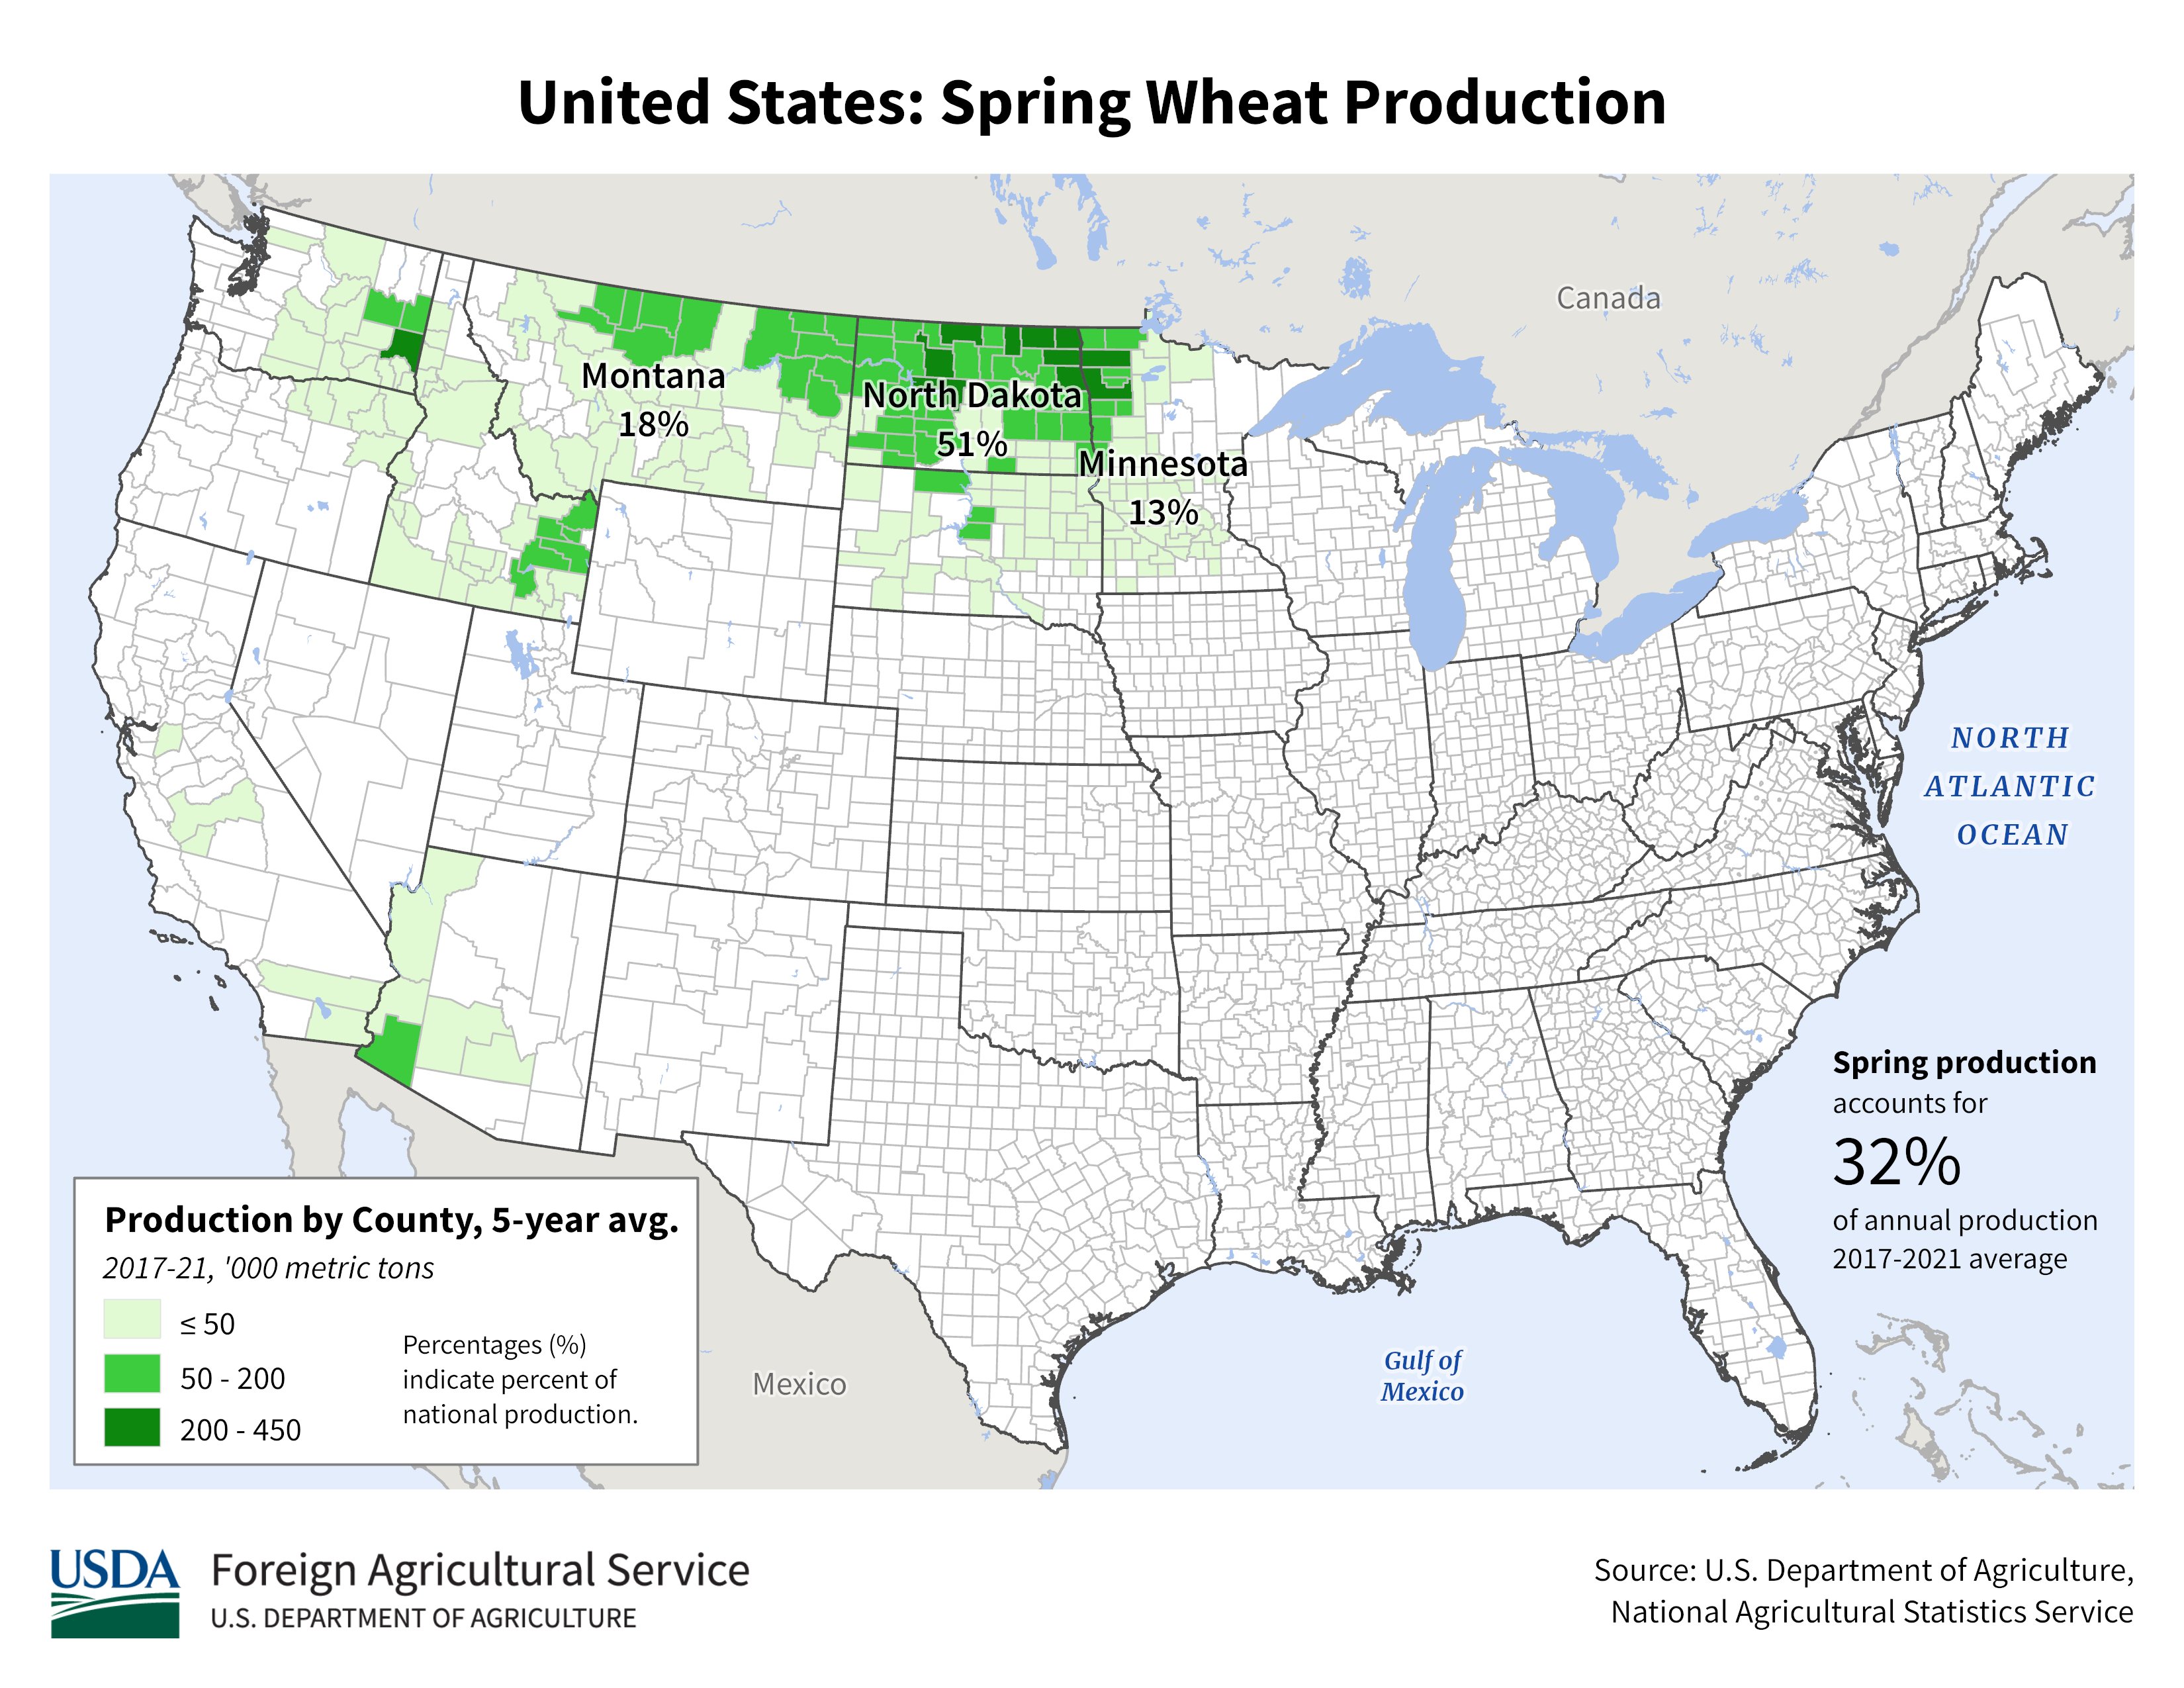
https://www.nass.usda.gov/Charts_and_Maps/Crops_County/sw-pr.php
Soilmoisture anomaly:
These maps sometimes take a day to catch up to incorporate the latest data(the bottom map is only updated once a week).
https://www.cpc.ncep.noaa.gov/products/Soilmst_Monitoring/US/Soilmst/Soilmst.shtml#
![]()
 +++++++++++++++++++++++++
Crop ratings:
https://www.marketforum.com/forum/topic/84478/#84516
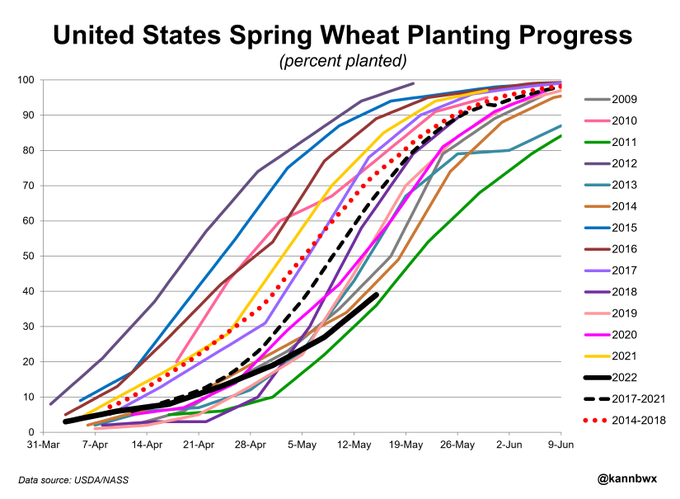
U.S. spring #wheat was 39% planted as of Sunday, the slowest for the date since 2011. The five-year average is 67% but 83% had been planted last year. North Dakota had planted 17% (60% is avg) and Minnesota just 5% (75% is avg). ND+MN grow 2/3 of the crop.
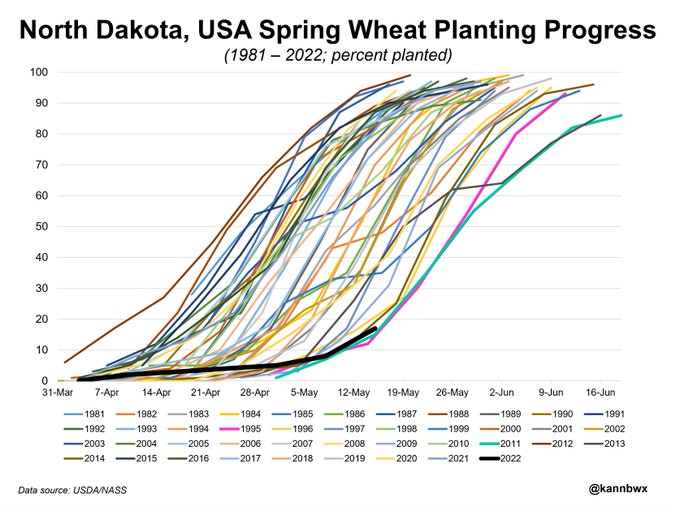
North Dakota is planting spring #wheat at about the slowest pace possible. 17% complete as of Sunday is better than only 1995 and 2011 for the date, barely. Conditions have been super wet this spring. ND was set to plant 46% of the U.S. spring wheat acreage this year.
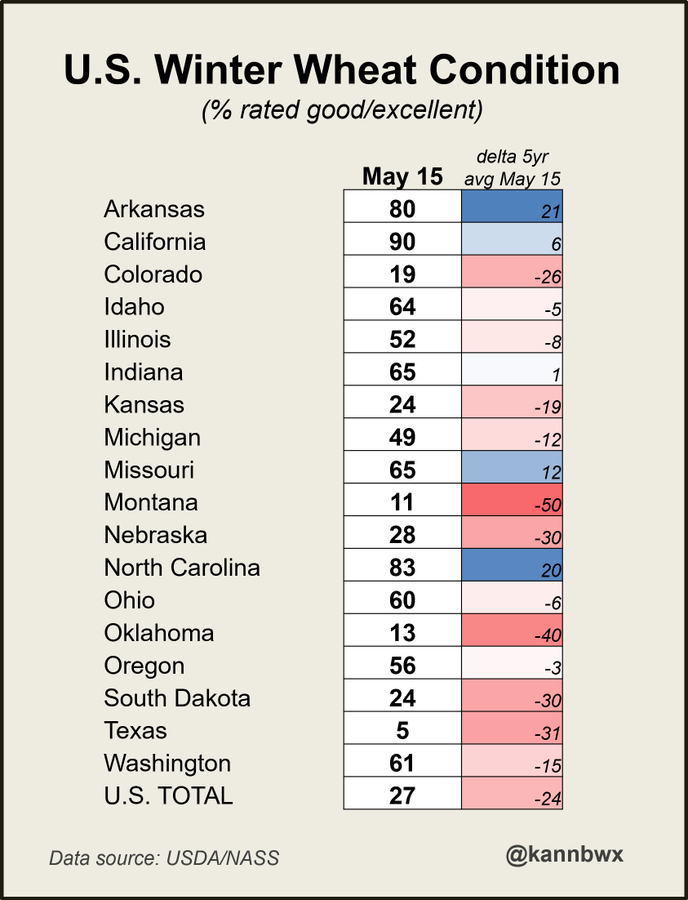
Mid-May U.S. winter #wheat conditions (% good/excellent) vs average. Note conditions in the top states: Kansas 24% Oklahoma 13% Texas 5% Colorado 19% Montana 11% These 5 states planted 63% of the U.S. winter wheat crop this year.
metmike: It's entirely the HRW crop obliterating the ratings because of the severe drought in those areas. For just the HRW crop, this might be the lowest rating ever!
The HRW crop right now is rated 41% P/VP!
https://sciencing.com/difference-between-florida-california-oranges-7517478.html
Hard Red Winter wheat is the most popular variety of wheat in the United States and accounts for about 40 percent of U.S. production. It has a high protein content and is a common ingredient in breads and all-purpose flour. Like all winter wheat, it is planted in the fall and harvested in early summer. In general, hard wheat has higher gluten and protein content and is preferred for leavening.
Durum is the hardest of all U.S. wheat varieties. It offers both a high protein and gluten content and is the chief ingredient in the semolina flour that makes up premium pastas. It also is well-suited as the base ingredient in Mediterranean breads. Durum is planted in the spring and can be either white or red. Though its benefits as a high-protein wheat are beneficial as a staple food, durum requires more milling than its softer cousins.
Two wheat varieties, white and red, are both hard and harvested in fall. Hard red wheat is the hardest of all wheat varieties but is not grown in the United States. Hard red spring wheat is prized for breads, hard baked goods, all-purpose flour and flour blends. The hard white variety yields a medium protein content and is similar to red wheat. It offers a sweet flavor and is used in breads, hard rolls, tortillas, oriental noodles, whole wheat and all-purpose flowers and brewing.
There are two major soft wheat varieties: soft red winter and soft white wheat. Soft red winter has a low protein content and is used as a blend in multipurpose flours, and for cookies, cakes, donuts and other fine pastries as well as flat breads, and crackers. Soft white is a low-protein wheat that offers high yields. It provides a lighter flour for cakes, crackers, cookies, pastries and it suits Middle Eastern flat breads.