KEY EVENTS TO WATCH FOR:
Monday, May 2, 2022
9:45 AM ET. April US Manufacturing PMI
PMI, Mfg (previous 58.8)
10:00 AM ET. March Construction Spending - Construction Put in Place
New Construction (previous +0.5%)
Residential Construction
10:00 AM ET. April ISM Report On Business Manufacturing PMI
Manufacturing PMI (previous 57.1)
Prices Idx (previous 87.1)
Employment Idx (previous 56.3)
Inventories (previous 55.5)
New Orders Idx (previous 53.8)
Production Idx (previous 54.5)
11:00 AM ET. April Global Manufacturing PMI
PMI, Mfg (previous 53.0)
The STOCK INDEXES? http://quotes.ino.com/ex?changes/?c=indexes
The Dow closed sharply lower on Friday as it extended the decline off April's high.The low-range close sets the stage for a steady to lower opening when Monday's night session begins trading. Stochastics and the RSI are oversold but remain neutral to bearish signaling that sideways to lower prices are possible near-term. If the Dow extends the aforementioned decline, the 87% retracement level of the February-April rally crossing at 32,696.19 is the next downside target. Closes above the 20-day moving average crossing at 34,332.89 would signal that a short-term low has been posted. First resistance is the 20-day moving average crossing at 34,332.88. Second resistance is April's high crossing at 35,492.22. First support is the 75% retracement level of the February-April rally crossing at 33,084.03. Second support is the 87% retracement level of the February-April rally crossing at 32,696.19.
The June NASDAQ 100 closed sharply lower on Friday as it erased most of Thursday's gains. The low-range close sets the stage for a steady to lower opening when Monday's night session begins trading. Stochastics and the RSI are oversold but remain poised to turn neutral to bullish with additional gains that would signal that a short-term low has been posted. Closes above the 50-day moving average crossing at 14,057.47 would signal that a short-term low has been posted. If June resumes the decline off March's high, the March-2021 low crossing at 12,727.50 is the next downside target. First resistance is the 10-day moving average crossing at 13,525.00. Second resistance is the 50-day moving average crossing at 14,057.45. First support is Tuesday's low crossing at 12,801.50. Second support is the March-2021 low crossing at 12,727.50.
The June S&P 500 closed sharply lower on Friday ending a two-day rebound off Tuesday's low. The low-range close sets the stage for a lower opening when Monday's night session begins trading. Stochastics and the RSI oversold but remain poised to turn neutral to bullish with additional strength that would signaling a low has been posted. Closes above the 20-day moving average crossing at 4389.19 would confirm that a low has been posted. If June renews the decline off March's high, February's low crossing at 4094.25 is the next downside target. First resistance is the 10-day moving average crossing at 4306.02. Second resistance is the 50-day moving average crossing at 4375.99. First support is the 87% retracement level of the February-March rally crossing at 4162.47. Second support is February's low crossing at 4094.25.
INTEREST RATES? http://quotes.ino.com/ex?changes/?c=interest ""
June T-bonds closed down 1-05 pts. at 140-02.
June T-bonds closed lower on Friday. The low-range close sets the stage for a steady to lower opening when Monday's night session begins trading. Stochastics and the RSI are neutral to bullish signaling that sideways to higher prices are possible near-term. Closes above the 20-day moving average crossing at 142-23 would signal that a short-term low has been posted. If June renews the decline off March's high, the October-2018 low on the monthly continuation chart crossing at 136-16 is the next downside target. First resistance is the 20-day moving average crossing at 142-23. Second resistance is the 50-day moving average crossing at 149-00. First support is last-Wednesday's low crossing at 138-14. Second support is the October-2018 low on the monthly continuation chart crossing at 136-16.
June T-notes closed down 165 pts. at 118.270.
June T-notes closed lower on Friday as it extended some of the decline off Wednesday's high. The low-range close sets the stage for a steady to lower opening when Monday's night session begins trading. Stochastics and the RSI are turning neutral to bearish signaling sideways to lower prices are possible near-term. Closes above Wednesday's high crossing at 120.185 would signal that a short-term low has been posted. If June renews the decline off March's high, the October-2018 low on the monthly continuation chart crossing at 117.135 is the next downside target. First resistance is Wednesday's high crossing at 120.185. Second resistance is the March 31st high crossing at 123.040. First support is last-Friday's low crossing at 118.080. Second support is the October-2018 low on the monthly continuation chart crossing at 117.135.
ENERGY MARKETS? http://quotes.ino.com/ex?changes/?c=energy ""
June crude oil closed lower on Friday but not before spiking above the upper boundary of the symmetrical triangle crossing near $105.53.The low-range close sets the stage for a steady to lower opening when Monday's night session begins. Stochastics and the RSI remain neutral to bullish signaling that sideways to higher prices are possible near-term. If June extends this week's rally, the April 18th high crossing at $109.20 is the next upside target. Closes below the 50-day moving average crossing at $100.38 would temper the near-term neutral to friendly outlook. First resistance is the April 18th high crossing at $109.20. Second resistance is the March 24th high crossing at $116.61. First support is Monday's low crossing at $95.28. Second support is April's low crossing at $92.60.
June heating oil closed slightly higher on Friday as it extends the rally off March's low. The low-range close sets the stage for a steady to slightly higher opening when Monday's night trading session begins. Stochastics and the RSI are overbought but remain neutral to bullish signaling that sideways to higher prices are possible near-term. If June extends the rally off March's low, weekly resistance on the weekly continuation chart crossing at $4.7099 is the next upside target. Closes below the 20-day moving average crossing at $3.5282 would signal that a short-term top has been posted. First resistance is today's high crossing at $4.1771. Second resistance is weekly resistance on the weekly continuation chart crossing at $4.7099. First support is the 20-day moving average crossing at $3.5282. Second support is the 50-day moving average crossing at $3.2921.
June unleaded gas closed lower on Friday after testing the 75% retracement level of March's decline crossing at 3.4806. The low-range close sets the stage for a steady to lower opening when Monday's night session begins trading. Stochastics and the RSI are overbought but remain neutral to bullish signaling that sideways to higher prices are possible near-term. If June extends the rally off April's low, the 87% retracement level of March's decline crossing at 3.5887 is the next upside target. Closes below the 50-day moving average crossing at $3.1481 would confirm that a short-term top has been posted. First resistance is the 75% retracement level of March's decline crossing at 3.4806. Second resistance is the 87% retracement level of March's decline crossing at 3.5887. First support is the 20-day moving average crossing at $3.2311. Second support is the 50-day moving average crossing at 3.1481.
June Henry natural gas closed higher on Friday. The high-range close sets the stage for a steady to higher opening when Monday's night session begins trading. Stochastics and the RSI are turning neutral signaling that sideways trading is possible near-term. Closes above Wednesday's high crossing at 7.524 would renew the rally off Monday's low and would open the door for a possible retest of April's high. Closes below Monday's low crossing at 6.471 would open the door for a larger-degree decline near-term. First resistance is April's high crossing at 8.197. Second resistance is the 50% retracement level of the 2005-2020 decline on the monthly continuation chart crossing at 8.606. First support is Monday's low crossing at 6.471. Second support is the 50% retracement level of the December-April rally crossing at 5.828.
CURRENCIES? http://quotes.ino.com/ex?changes/?c=currencies ""
The June Dollar closed lower on Friday ending a six-day rally off last-Thursday low. The low-range close sets the stage for a steady to lower opening when Monday's nights session begins trading. Stochastics and the RSI are overbought but remain neutral to bullish signaling sideways to higher prices are possible near-term. If June extends the rally off January's low, the 75% retracement level of the 2001-2008 decline on the monthly continuation chart crossing at $108.72 is the next upside target. Closes below the 20-day moving average crossing at $100.71 would signal that a short-term top has been posted. First resistance is the 2020-high on the monthly continuation chart crossing at $103.96. Second resistance is the 75% retracement level of the 2001-2008 decline on the monthly continuation chart crossing at $108.72. First support is the 10-day moving average crossing at $101.77. Second support is the 20-day moving average crossing at $100.71.
The June Euro closed higher on Friday due to short covering as it ended a six-day decline. The high-range close sets the stage for a steady to higher opening when Monday's night session begins trading. Stochastics and the RSI are oversold but remain neutral to bearish signaling that sideways to lower prices are possible near-term. If June extends the decline off the March 31st high, the December-2016 low on the weekly continuation chart crossing at $103.68 is the next downside target. Closes above the 20-day moving average crossing at $108.26 would signal that a short-term low has been posted. First resistance is the 10-day moving average crossing at $107.25. Second resistance is the 20-day moving average crossing at $108.26. First support is Thursday's low crossing at $104.91. Second support is the December-2016 low on the weekly continuation chart crossing at $103.68.
The June British Pound closed higher due to short covering on Friday and ended a six-day decline off last-Thursday's high. The high-range close sets the stage for a steady to higher opening when Monday's night session begins trading. Stochastics and the RSI are oversold but remain neutral to bearish signaling that sideways to lower prices are possible near-term. If June extends the decline off January's high, the 75% retracement level of the 2020-2021-rally on the weekly chart crossing at 1.2232 is the next downside target. Closes above the 20-day moving average crossing at 1.2925 would signal that a short-term low has been posted. First resistance is the 10-day moving average crossing at 1.2782. Second resistance is the 20-day moving average crossing at 1.2925. First support is Thursday's low crossing at 1.2411. Second support is the 75% retracement level of the 2020-2021-rally on the weekly chart crossing at 1.2232.
The June Swiss Franc closed slightly higher on Friday ending a six-day in a row decline as it consolidated some of the decline off last-Wednesday's high. The low-range close sets the stage for a steady to slightly higher opening when Monday's night session begins trading. Stochastics and the RSI are oversold but remain neutral to bearish signaling that sideways to lower prices are possible near-term. If June extends the decline off the March 31st high, the 75% retracement level of the 2016-2021 on the monthly continuation chart crossing at 1.01109 is the next downside target. Closes above the 20-day moving average crossing at 1.06054 would signal that a short-term low has been posted. First resistance is the 10-day moving average crossing at 1.04536. Second resistance is the 20-day moving average crossing at 1.06054. First support is Thursday's low crossing at 1.02670. Second support is the the 75% retracement level of the 2016-2021 on the monthly continuation chart crossing at 1.01109.
The June Canadian Dollar closed lower on Friday as it extended the decline off April's high. The low-range close sets the stage for a steady to lower opening when Monday's night session begins trading. Stochastics and the RSI are oversold but remain neutral to bearish signaling that sideways to lower prices are possible near-term. If June extends the aforementioned decline, March's low crossing at 77.51 is the next downside target. Closes above the 20-day moving average crossing at 79.15 would confirm that a short-term low has been posted. First resistance is the 50-day moving average crossing at 78.99. Second resistance is the 20-day moving average crossing at 79.15. First support is Thursday's low crossing at 77.61. Second support is March's low crossing at 77.51.
The June Japanese Yen posted an inside day with a higher close on Friday as it consolidated some of the decline off January's high. The high-range close sets the stage for a steady to higher opening when Monday’s night session begins trading. Stochastics and the RSI are oversold but remain neutral to bearish signaling that sideways to lower prices are possible near-term. If March extends the decline off March's high, March's low the February-2002 low on the monthly continuation chart crossing at 0.074150 is the next downside target. Closes above the 20-day moving average crossing at 0.079253 would signal that a short-term low has been posted. First resistance is Wednesday's high crossing at 0.078885. Second resistance is the 20-day moving average crossing at 0.079253. First support is Thursday's low crossing at 0.076280. Second support is the February-2002 low on the monthly continuation chart crossing at 0.074150.
PRECIOUS METALS? http://quotes.ino.com/ex?changes/?c=metals ""
June gold closed higher on Friday as it consolidated some of the decline off April's high. The mid-range close sets the stage for a steady to higher opening when Monday's night session begins trading. Stochastics and the RSI are oversold but remain neutral to bearish signaling that sideways to lower prices are possible near-term. If June extends the decline off April's high, the 62% retracement level of the 2021-2022 rally crossing at $1841.50 is the next downside target. Closes above the 50-day moving average crossing at $1942.00 would signal that a short-term low has been posted. First resistance is the 50-day moving average crossing at $1942.00. Second resistance is April's high crossing at $1997.10. First support is the 50% retracement level of the 2021-2022 rally crossing at $1887.60. Second support is the 62% retracement level of the 2021-2022 rally crossing at $1841.50.
July silver closed lower on Friday as it extends the decline off April's high and closed below the 75% retracement level of the December-March rally crossing at 23.023. The low-range close sets the stage for a steady to lower opening when Monday's night session begins trading. Stochastics and the RSI are oversold but remain neutral to bearish signaling that sideways to lower prices are possible near-term. If July extends the decline off April's high, the 87% retracement level of the December-March rally crossing at 22.316 is the downside target. Closes above the 50-day moving average 25.015 would signal that a short-term low has been posted. First resistance is the 10-day moving average 24.297. Second resistance is the 50-day moving average crossing at 25.015. First support is today's low crossing at 22.790. Second support is the 87% retracement level of the December-March rally crossing at 22.316.
July copper closed lower on Friday as it extended the decline off April's high. The low-range close sets the stage for a steady to lower opening when Monday's night session begins trading. Stochastics and the RSI are oversold but remain neutral to bearish signaling that sideways to lower prices are possible near-term. If July extends the aforementioned decline, the 75% retracement level of the December-March rally crossing at 4.3362 is the next downside target. Closes above the 20-day moving average crossing at 4.6558 would signal that a short-term low has been posted. First resistance is the 10-day moving average crossing at 4.5795. Second resistance is the 20-day moving average crossing at 4.6558. First support is today's low crossing at 4.3850. Second support is the 75% retracement level of the December-March rally crossing at 4.3362.
GRAINS? http://quotes.ino.com/ex?changes/?c=grains "
July Corn closed up $0.01 1/4-cents at $8.13 1/2.
July corn closed unchanged on Friday as it consolidated some this week's rally. The low-range close sets the stage for a steady to lower opening when Monday's night session begins trading. Stochastics and the RSI are overbought, diverging but remain neutral to bullish signaling that sideways to higher prices are possible near-term. If July extends the rally off the March 29th low, the August-2012 high on the monthly continuation chart crossing at $8.43 3/4 is the next upside target. Closes below the 20-day moving average crossing at $7.79 3/4 would signal that a short-term top has been posted. First resistance is today's high crossing at $8.24 1/2. Second resistance is the August-2012 high on the monthly continuation chart crossing near $8.43 3/4. First support is the 20-day moving average crossing at $7.79 3/4. Second support is the 50-day moving average crossing at $7.35 3/4.
July wheat closed down $0.30-cents at $10.55 3/4.
July wheat closed sharply lower on Friday and below Monday's low crossing at $10.55 3/4 signaling a resumption of the decline off April's high. The low-range close sets the stage for a steady to lower opening when Monday's night session begins trading. Stochastics and the RSI are neutral to bearish signaling that sideways to lower prices are possible near-term. Closes below the 50-day moving average crossing at $10.47 1/2 would open the door for a larger-degree decline into early-May. If July renews the rally off March's low, the 62% retracement level of the March decline crossing at $11.59 1/4 is the next upside target. First resistance is the 62% retracement level of the March decline crossing at $11.59 1/4. Second resistance is the 75% retracement level of the March decline crossing at $12.00 1/4. First support is today's low crossing at $10.54 1/4. Second support is the 50-day moving average crossing at $10.47 1/2.
July Kansas City Wheat closed down $0.35 1/2-cents at $11.05 3/4.
July Kansas City wheat closed sharply lower on Friday as it renewed the decline off April's high. The low-range close sets the stage for a steady to lower opening when Monday's night session begins trading. Stochastics and the RSI are neutral to bearish signaling that sideways to lower prices are possible near-term. If July extends today's decline, the 50-day moving average crossing at $10.79 1/4 is the next downside target. Closes above the 10-day moving average crossing at $11.54 1/2 would signal that a short-term low has been posted. First resistance is April's high crossing at $12.02 1/4. Second resistance is the 87% retracement level of March's decline crossing at $12.28. First support is the 50-day moving average crossing at $10.79 1/4. Second support is the April 6th low crossing at $10.63 3/4.
July Minneapolis wheat closed down $0.25 1/2-cents at $11.66.
July Minneapolis wheat closed lower on Friday as it consolidated some of this year's rally. The low-range close sets the stage for a steady to lower opening when Monday's night session begins trading. Stochastics and the RSI are overbought and are turning neutral to bearish signaling that a short-term top might be in or is near. Closes below the 20-day moving average crossing at $11.43 1/4 would signal that a short-term top has been posted. If July extends the rally off the March 29th low, the 38% retracement level of the 2008-2009 decline on the monthly continuation chart crossing at $12.21 1/2 is the next upside target. First resistance is Thursday's high crossing at $12.06. Second resistance is the March 29th low, the 38% retracement level of the 2008-2009 decline on the monthly continuation chart crossing at $12.21 1/2. First support is the 20-day moving average crossing at $11.47 3/4. Second support is the 50-day moving average crossing at $10.90 1/2.
SOYBEAN COMPLEX? http://quotes.ino.com/ex?changes/?c=grains "
July soybeans closed unchanged at $16.84 3/4.
July soybeans closed unchanged on Friday. The low-range close sets the stage for a steady to lower opening when Monday's night session begins trading. Stochastics and the RSI are neutral to bearish signaling that sideways to low prices are possible near-term. Closes below the 50-day moving average crossing at $16.49 1/4 would confirm that a short-term top has been posted. If July renews the rally off April's low, February's high crossing at $17.41 is the next upside target. First resistance April's high crossing at $17.34. Second resistance is February's high crossing at $17.41. First support is the 20-day moving average crossing at $16.60 3/4. Second support is the 50-day moving average crossing at $16.49 1/4.
July soybean meal closed up $2.20 at $432.30.
July soybean meal posted an inside day with a higher close on Friday. The high-range close sets the stage for a steady to higher opening when Monday's night session begins trading. Stochastics and the RSI are oversold but remain neutral to bearish signaling that sideways to lower prices are possible near-term. If July extends the decline off March's high, the 38% retracement level of the 2021-2022 rally crossing at $422.70 is the next downside target. Closes above the 50-day moving average crossing at $457.00 would signal that a short-term low has been posted. First resistance is last-Thursday's high crossing at $467.80. Second resistance is March's high crossing at $484.60. First support is Wednesday's low crossing at $429.00. Second support is the 38% retracement level of the 2021-2022 rally crossing at $422.70.
July soybean oil closed down 242 pts. at 84.18.
July soybean oil closed sharply lower on Friday as it consolidated some of this year's rally. The low-range close sets the stage for a lower opening when Monday's night session begins trading. Stochastics and the RSI are overbought but remain neutral to bullish signaling that sideways to higher prices are possible near-term. If July extends the aforementioned rally into uncharted territory, upside targets will be hard to project. Closes below the 20-day moving average crossing at 76.97 would signal that a short-term top has been posted. First resistance is today's high crossing at 87.65. Second resistance is unknown. First support is the 10-day moving average crossing at 81.32. Second support is the 20-day moving average crossing at 76.97.
LIVESTOCKhttp://quotes.ino.com/exchanges/?c=livestock
June hogs closed down $4.53 at $106.45.
June hogs closed sharply lower on Friday as it renewed the decline off March's high. The low-range close sets the stage for a steady to lower opening when Monday's session begins trading. Stochastics and the RSI are oversold but remain neutral to bearish signaling that sideways to lower prices are possible near-term. If June extends the decline off last-Tuesday's high, the 62% retracement level of the September-April rally crossing at $102.37 is the next downside target. Closes above the 50-day moving average crossing at $117.36 would signal that a short-term low has been posted. First resistance is the 10-day moving average crossing at $115.14. Second resistance is the 50-day moving average crossing at $117.36. First support is today's low crossing at $106.23. Second support is the 62% retracement level of the September-March rally crossing at $102.37.
June cattle closed down $0.95 at $132.95
June cattle closed lower on Friday as it extended the decline off April's high. The low-range close sets the stage for a steady to lower opening on Monday. Stochastics and the RSI are oversold but remain neutral to bearish signaling that sideways to lower prices are possible near-term. If June extends the decline off last-Friday's high, March's low crossing at $130.97 is the next downside target. Closes above Monday's gap crossing at $138.35 would signal that a short-term low has been posted. First resistance is Monday's gap crossing at $138.35. Second resistance is the 75% retracement level of the February-March decline crossing at $140.29. First support is April's low crossing at $133.48. Second support is March's low crossing at $130.97.
August Feeder cattle closed down $1.75 at $168.65.
August Feeder cattle closed lower on Friday as it extended the decline off the April 22nd high. The low-range close sets the stage for a steady to lower opening when Monday's session begins trading. Stochastics and the RSI are oversold but remain neutral to bullish signaling that sideways to higher prices are possible near-term. If August extends the decline off March's high, last-November's low crossing at $166.77 is the next downside target. Closes above the 20-day moving average crossing at $173.18 would signal that a short-term low has been posted. First resistance is the 20-day moving average crossing at $173.18. Second resistance is the 50-day moving average crossing at $177.31. First support is last-November's low crossing at $166.77. Second support is the September-2021 low crossing at $166.08.
FOOD & FIBERhttp://quotes.ino.com/ex changes/?c=food
July coffee closed higher on Friday. The high-range close sets the stage for a steady to higher opening on Monday. Stochastics and the RSI are oversold and are turning neutral to bullish signaling that a low might be in or is near. Closes above the 50-day moving average crossing at 22.64 would signal that a short-term low has been posted. If July extends the decline off April's high, the March 28th low crossing at 21.27 is the next downside target.
July cocoa closed slightly higher on Friday as it extended the rally off Tuesday's low. The low-range close sets the stage for a steady to slightly higher opening on Monday. Stochastics and the RSI have turned neutral to bullish signaling that sideways to higher prices are possible near-term. Closes above the 50-day moving average crossing at 26.13 would signal that a short-term low has been posted. If July renews the decline off April's high, the December 20th low crossing at 24.59 is the next downside target.
July sugar closed lower on Friday as it consolidated some of Thursday's rally. The low-range close sets the stage for a steady to lower opening on Monday. Stochastics and the RSI are oversold and are turning neutral to bullish signaling that sideways to higher prices are possible near-term. Closes above the 20-day moving average crossing at 19.58 would signal that a short-term low has been posted. If July extends the decline off April's high, the March 16th low crossing at 18.44 is the next downside target.
July cotton closed lower due to profit taking ahead of the weekend on Friday as it consolidates some of this year's rally. The low-range close sets the stage for a steady to lower opening on Monday. Stochastics and the RSI remain neutral to bullish signaling that sideways to higher prices are possible near-term. If July extends the rally off March's low, the 62% retracement level of the 2011-2020-decline on the monthly continuation chart crossing at 154.43 is the next upside target. Closes below Monday's low crossing at 132.33 would signal that a short-term top has been posted.
Thanks much tallpine!
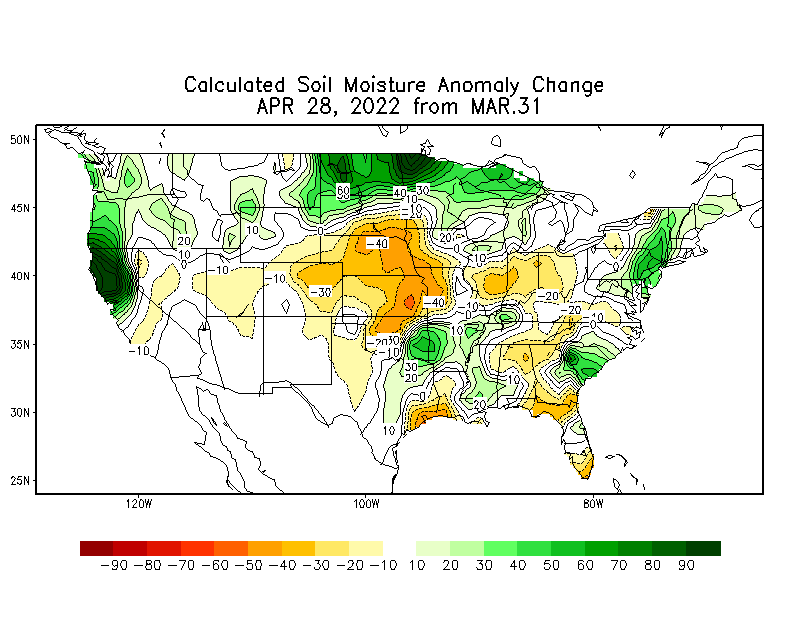
Wheat got crushed, especially HRW because of the biggest rain event(s) in the C/S Plains in many months coming up.
1st one should be late Sunday to Monday.
Then another potential big rain event later in the week. Wednesday NIght/Thursday.
This mega bearishness for wheat and rain in some of the driest areas held down corn, which needs warm/dry weather to catch up on the planting pace.
The latest precip forecasts for the next week are below.
Day 1 below:
http://www.wpc.ncep.noaa.gov/qpf/fill_94qwbg.gif?1526306199054

Day 2 below:
http://www.wpc.ncep.noaa.gov/qpf/fill_98qwbg.gif?1528293750112

Day 3 below:
http://www.wpc.ncep.noaa.gov/qpf/fill_99qwbg.gif?1528293842764

Days 4-5 below:
http://www.wpc.ncep.noaa.gov/qpf/95ep48iwbg_fill.gif?1526306162

Days 6-7 below:
http://www.wpc.ncep.noaa.gov/qpf/97ep48iwbg_fill.gif?1526306162

7 Day Total precipitation below:
http://www.wpc.ncep.noaa.govcdx /qpf/p168i.gif?1530796126
