When I get a chance later today, I'll get the ball rolling on next week's MAJOR storm.
We should have at least several dozen weather posts/updates before its over!
It will feature widespread severe weather on the warm side(including tornadoes) and blizzard/heavy snows on the cold side.
Scroll down for updates as the storm approaches!


Here's what the forecast for the storm looks like right now. It's actually the 2nd one, which organizes on Tuesday, April 12th on the map below.
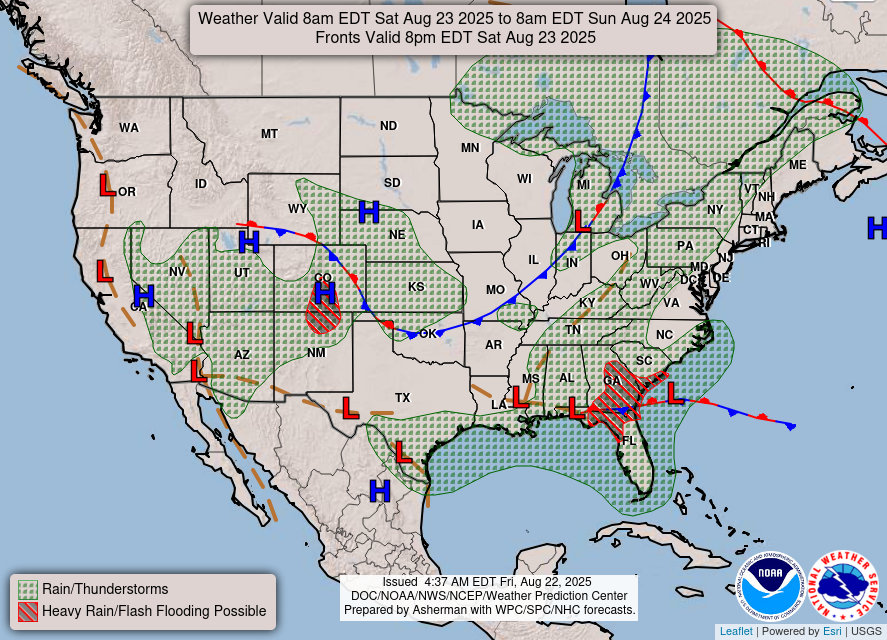
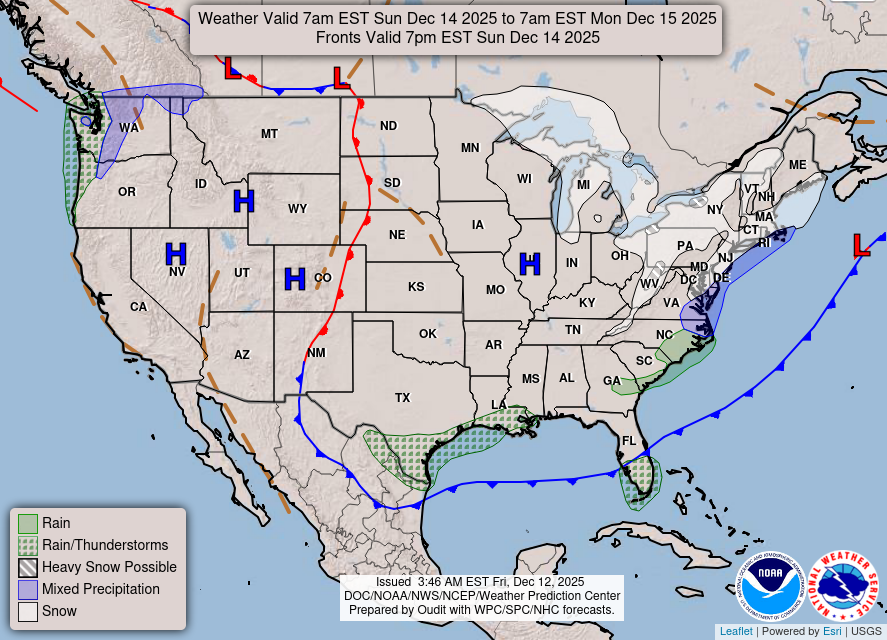
Surface Weather maps for days 3-7 below:
https://www.wpc.ncep.noaa.gov/medr/medr.shtml

U.S. Day 3-7 Hazards Outlook
Go to the link below for the latest updated map.
https://www.wpc.ncep.noaa.gov/threats/threats.php
First, let's hope no one gets hurt. Secondly, the country could use any moisture it can get.
Thanks Jim!
The Western half of the country needs rain.
The Eastern Cornbelt and to the south is much too wet(needs to dry out). We need that area to warm up also.
https://www.cpc.ncep.noaa.gov/products/Soilmst_Monitoring/US/Soilmst/Soilmst.shtml#
![]()
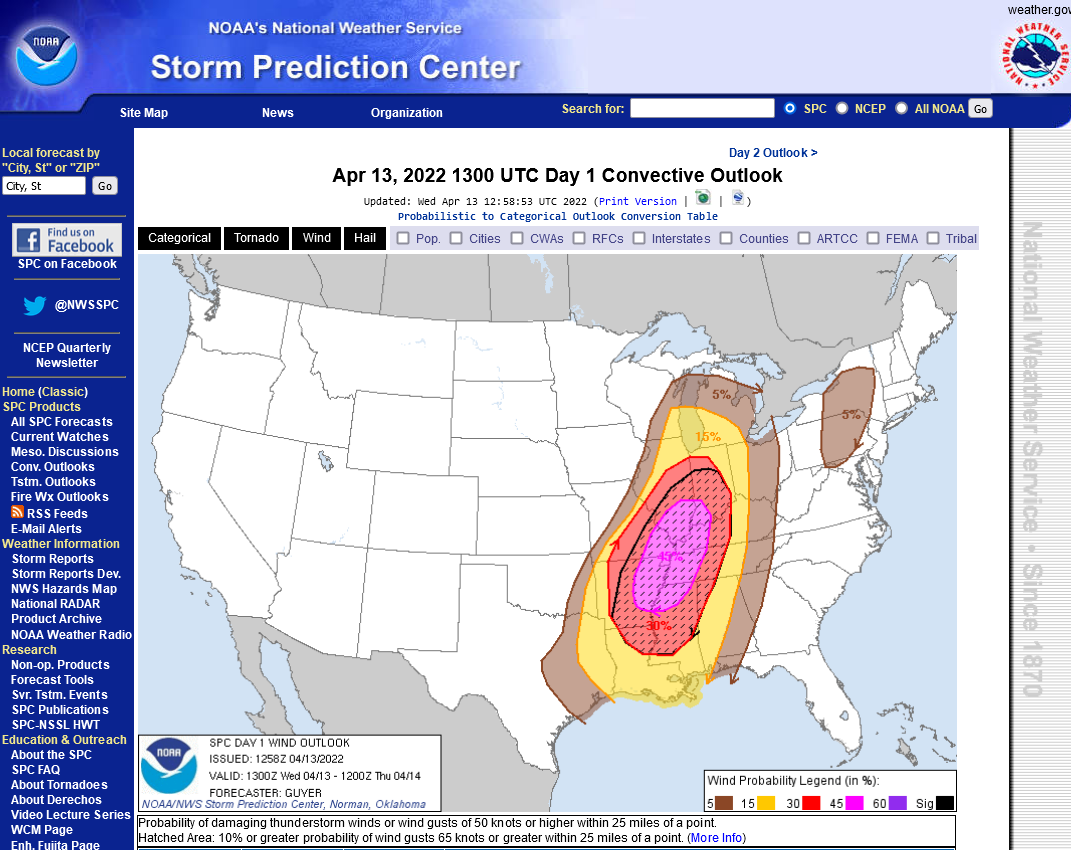
Severe Storm Risk......updated constantly.
https://www.spc.noaa.gov/products/outlook/
Current Day 1 Outlook | |
Current Day 2 Outlook | |
Current Day 3 Outlook | |
Current Day 4-8 Outlook |
Winter weather link from the NWS experts:
Not much threat for excessive rain with this system because it will be moving so fast!
However, 1 week rain totals may be around 3 inches(unwanted) in the Southern Ohio River Valley.
Excessive rain threat(low threat).
https://www.wpc.ncep.noaa.gov/qpf/excess_rain.shtml
Current Day 1 Forecast
Day 1 Threat Area in Text Format
Current Day 2 Forecast |

++++++++++++++++++++++++++++++++++++
The latest precip forecasts are below.
Day 1 below:
http://www.wpc.ncep.noaa.gov/qpf/fill_94qwbg.gif?1526306199054

Day 2 below:
http://www.wpc.ncep.noaa.gov/qpf/fill_98qwbg.gif?1528293750112

Day 3 below:
http://www.wpc.ncep.noaa.gov/qpf/fill_99qwbg.gif?1528293842764

Days 4-5 below:
http://www.wpc.ncep.noaa.gov/qpf/95ep48iwbg_fill.gif?1526306162

Days 6-7 below:
http://www.wpc.ncep.noaa.gov/qpf/97ep48iwbg_fill.gif?1526306162

7 Day Total precipitation below:
http://www.wpc.ncep.noaa.govcdx /qpf/p168i.gif?1530796126

Latest snow forecast from the just out 12z GFS ensemble model:
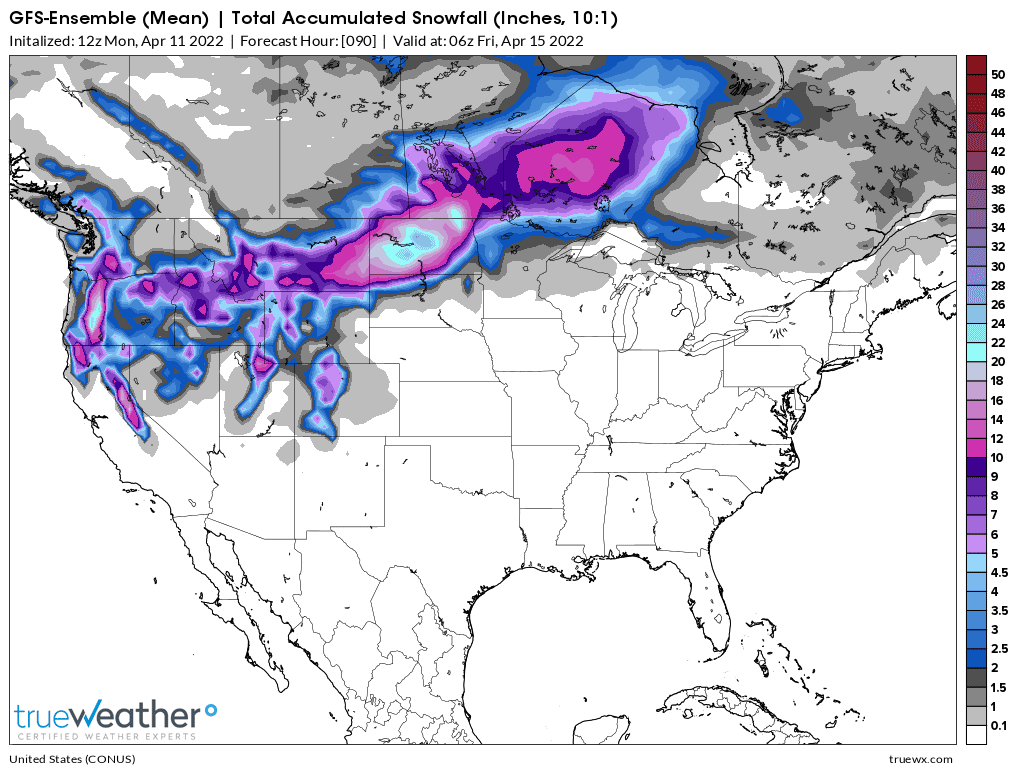
I have a sister that likes in Bismarck. Orange is for a blizzard warning below. Heaviest snows may be northwest of Bismark.
Click a location below for detailed forecast.
Last Map Update: Mon, Apr. 11, 2022 at 1:22:49 pm CDT
Local weather information from the NWS in Paducah that includes the Evansville IN area of responsibility:
Local NWS for Evansville Indiana:

Hourly weather graph:
This link below provides some great data. Hit the center of the box below for the area that you want, then go to observation on the far left, then surface observations to get constantly updated surface observations.
 |
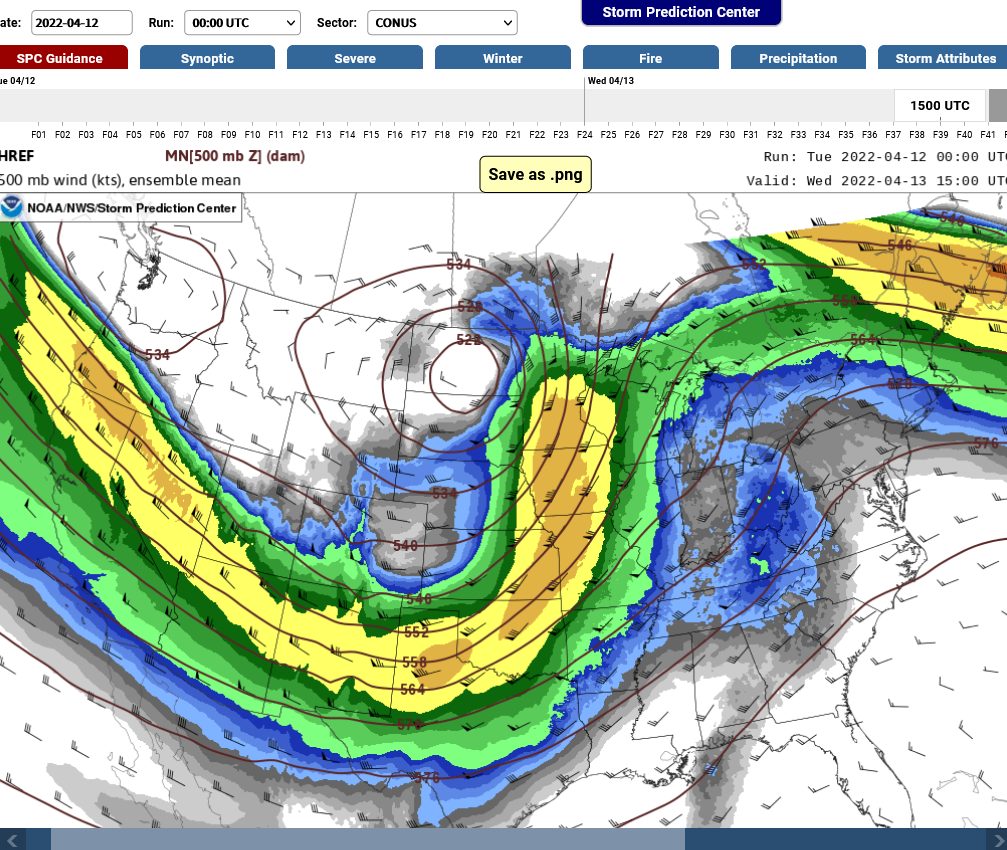
This is what the 500mb map looks like(about the mid point in the atmosphere(not half the distance but half of the mass of the atmosphere)) . Wind speeds are in knots. 5 knots = 6 mph.
This is around 18,000 feet above the surface, over 3.5 miles up.
https://www.spc.noaa.gov/exper/sref/
The speed max crossing the West Coast will provide the energy to strengthent the storm the next 2 days!
It will also help to increase lift and produce rotation/spin for tornadoes.

This is the 500 mb forecast for Wednesday:
https://www.spc.noaa.gov/exper/href/
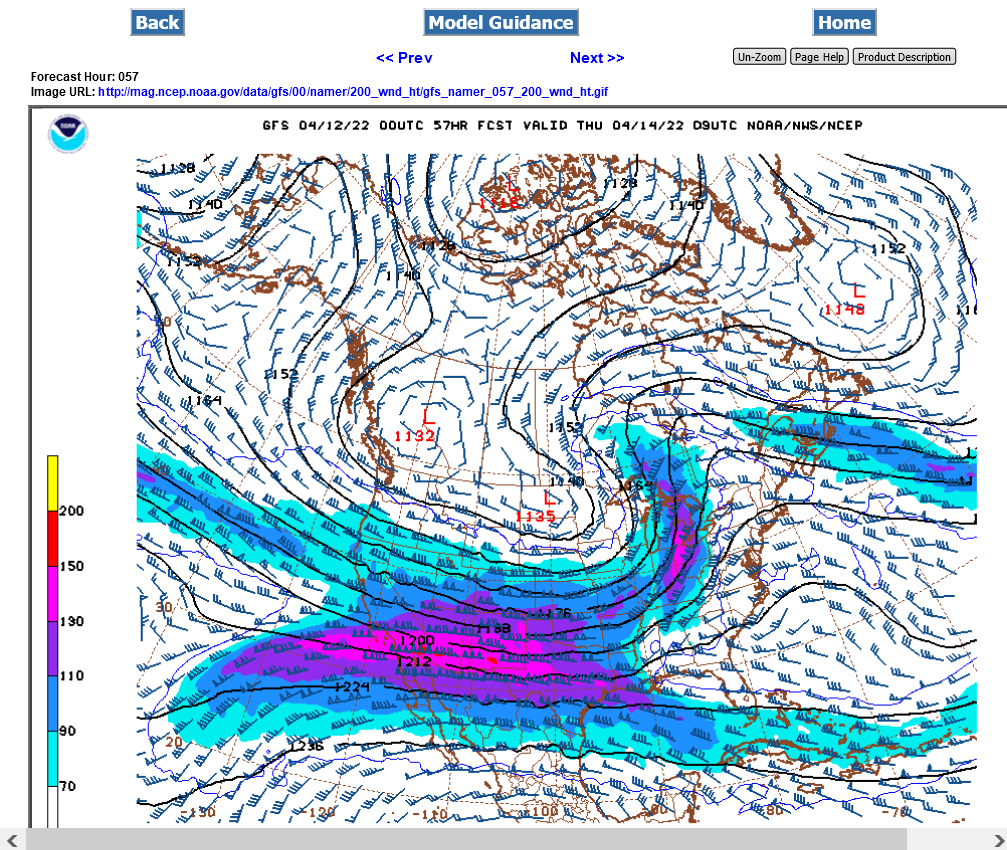
Here's a look at winds a bit higher up, at 200mb and the jet stream level on Wednesday Night. This is around 39,000 feet up or over 7 miles above the surface. It can range from 35,000 to 41,000 feet above the ground.
The tiny 150 knot speed max in the red is 180 mph(in a large area of pink headed across TX. The stronger jet stream to the south is why one might think that the risk for tornadoes should be higher there.
However, we have a 150+ mph speed max crossing Indiana(in pink) which will enhance the threat for tornadoes, including STRONG tornadoes.
The air ahead of and below strong jet streams is lifted greatly and can become very unstable. As that air rises and cools, water vapor condenses out because cooler air has less capacity to hold moisture.

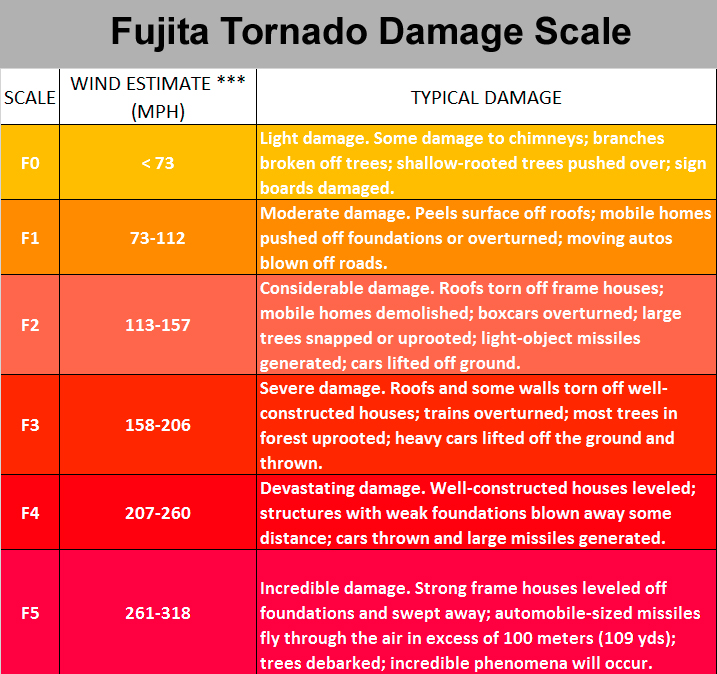
http://www.tornadoproject.com/cellar/fscale.htm
You will note that 76%(most) of tornadoes are "WEAK" tornadoes. They rarely kill people.
When you get to F2 and F3 tornadoes, they become deadly. This current situation is capable of producing that kind of tornado.
F4 and F5 tornadoes are very rare but kill the majority(67%) of people.
++++++++++++++++++++++++++++++++++++++++++++++++++++++++++++++

Showtime to track this storm in real time!
Current Conditions below updated every few minutes.
https://www.spc.noaa.gov/exper/mesoanalysis/new/viewsector.php?sector=13#


https://www.spc.noaa.gov/exper/mesoanalysis/new/viewsector.php?sector=20


Latest National radar images
https://www.wunderground.com/maps/radar/current
This link below provides some great data. Hit the center of the box below for the area that you want, then go to observation on the far left, then surface observations to get constantly updated surface observations.
| |
Severe Storm Risk......updated constantly.
Go to link for forecast discussions. Scroll down for the last update with MODERATE risk for Wednesday.
https://www.spc.noaa.gov/products/outlook/
| Current Day 1 Outlook | |
| Current Day 2 Outlook |
The Severe Storms forecast center JUST updated their day 2 outlook(Wednesday) a few minutes ago to put Evansville in the MODERATE risk.
Get their forecast discussion/philosophy at the link below:
https://www.spc.noaa.gov/products/outlook/day2otlk.html
The upgrade to moderate was based on the damaging wind threat. The tornado threat still at 10% for the northern portion of that area.
HIGH WIND THREAT 45% is pretty high!

Read the verbiage of their forecast discussion at the link below:
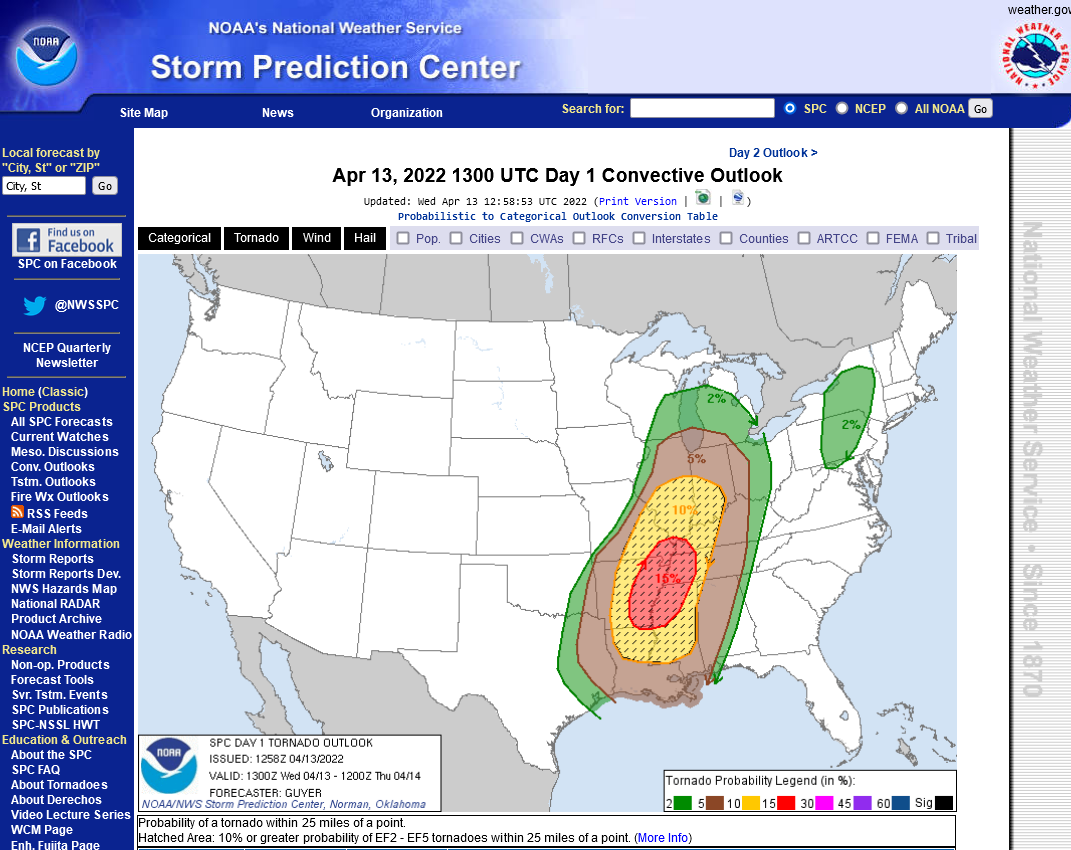
https://www.spc.noaa.gov/products/outlook/day1otlk.html
For areas northward into/across Missouri, Illinois, and Indiana, it appears likely that storms will increase and intensify initially across southern Missouri, as early as this morning in vicinity of the outflow-enhanced effective cold front. These storms will pose a damaging wind and some severe hail risk especially into the afternoon as they organize and race east-northeastward. The potential for tornadoes will exist as well, in dual scenarios including any pre-squall line supercellular development and within an evolving QLCS itself, especially as storms encounter a dramatically strengthening south-southwesterly low-level jet (50-60 kt at 850 mb) across southeast Missouri and areas eastward across Illinois/Indiana/Kentucky. Tornadoes and potentially widespread/locally significant damaging winds are likely especially through the afternoon and early/mid-evening hours.
Threat for tornadoes at 10% (within 25 miles of any location in that shaded area) potential for STRONG tornadoes of 150 mph+.
Threat below for high winds 45%(within 25 miles of any location in that shaded area). Potential for gusts of 70 mph+
This is how they define the categories/numbers:
Thanks for the update Mike!
YW Jim!
It's only a tiny change but it's a BIG one if you live in SW Indiana.
They adjusted the moderate risk zone farther south, so it's south of the Ohio River in KY now.
Latest local watches, warnings and advisories:
Go to this link to see what all the colors are. The highest risk, as we mentioned earlier is staying to our south.
While in ND, they are seeing this:
Impossible travel conditions across most of the state on Wednesday.
Severe threat is over for our area of southwest IN!
Severe weather from last Wednesday's updated storm outbreak report.
The NWS surveys damage and continues to get reports for several days after the severe events, that they did not have initially after the severe weather events.
Mostly high wind reports (412) compared to 34 tornadoes and 14 hail reports. Total of 460.
The area did come pretty close to lining up with the moderate risk area that was mainy used because of a 45% risk of damaging winds within 25 miles of the shaded area.
https://www.spc.noaa.gov/climo/reports/yesterday.html

+++++++++++++++++++
Though they over forecast the risk for tornadoes (we're glad the weather under performed there-better to at least be prepared), they pretty much nailed the maps on high winds:
As noted above and here(this map was adjusted south by them on Wednesday morning, BEFORE the outbreak which used the latest data): https://www.marketforum.com/forum/topic/83112/#83276
Threat below for high winds 45%(within 25 miles of any location in that shaded area). Potential for gusts of 70 mph+
Not as much risk for severe weather with the next few systems.
https://www.spc.noaa.gov/products/outlook/
Current Day 1 Outlook | Forecaster: Hart/Moore Issued: 20/1617Z Valid: 20/1630Z - 21/1200Z Forecast Risk of Severe Storms: Slight Risk |
Current Day 2 Outlook | Forecaster: Kerr Issued: 20/1026Z Valid: 21/1200Z - 22/1200Z Forecast Risk of Severe Storms: Slight Risk |
Current Day 3 Outlook | Forecaster: Kerr Issued: 20/0726Z Valid: 22/1200Z - 23/1200Z Forecast Risk of Severe Storms: Slight Risk |
Current Day 4-8 Outlook |


