NGI headlines from early this morning:
Previous thread:
https://www.marketforum.com/forum/topic/78566/
Thanks much for getting the new thread started Jim and also thanks for Saturdays natural gas news!
This is why we gapped higher on the open last night and were sharply higher very early this morning.
But the threat did NOT increase as needed to inspire more buying.
In fact, the last 12z European model is a -8 HDD's vs the previous one, after that one came out -5 HDD's less than the previous one.
I'm afraid the -PNA and upper level troughing in the West may be strong enough that it induces alot of ridging on some solutions, downstream in the Midwest that provides enough resistance to the cold in Canada to keep it from dropping bodily into the US.
There is ridging in the south, regardless of the strength of the upper level trough in the West but its stronger with the stronger trough solutions.
Instead, we will see shallow intrusions that undercut the upper level flow and moderate greatly headed south because they have non optimal steering current aloft(sometimes even a southerly component)
https://www.marketforum.com/forum/topic/78566/#78961
However,
The overall pattern still poses a legit risk for extreme cold that could quickly threaten and take us back up quickly. There's a wide disparity too.
This analysis from yesterday still applies to the features/graphs/maps below:
https://www.marketforum.com/forum/topic/78566/#78960
https://www.cpc.ncep.noaa.gov/products/precip/CWlink/daily_ao_index/ao.shtml

https://www.cpc.ncep.noaa.gov/products/precip/CWlink/pna/nao.shtml
https://www.cpc.ncep.noaa.gov/products/precip/CWlink/pna/pna.shtml
++++++++++++++++++++++++++++++++++++++++++++
https://www.psl.noaa.gov/map/images/ens/t850anom_nh_alltimes.html
update 12-15-21: This is the 500mb anomaly below at the end of the period....15 days.... from the GFS ensemble mean. Some of the anomalies and teleconnections are FAVORABLE for cold air delivery from north to south. Especially the big positive anomaly over Greenland and negative to its south.
metmike: Yep. But the cold threat is still there.
This last GFS, 18z model was an incredible -20 HDD's milder than the previous 12z run. That's the way it is with this massive temp gradient in the northern US........very mild to the south, frigid to the north across Canada.
A small shift north or south of the features and it can make a massive difference in HDD's.
This time it was shifted northward.
Thanks for the weather updates Mike.
YW Jim!
As overnight forecasts fueled uncertainty over how much cold air will find its way into the Lower 48 late this month, natural gas futures skidded lower in early trading Tuesday. The January Nymex contract was down 6.5 cents to $3.729/MMBtu at around 8:50 a.m. ET. The weather data produced a mix of trends overnight, including…
metmike: Overnight models were slightly less mild but have the same pattern. The problem is the extremely -PNA and very deep trough out West will cause the cold to drop down there and induce ridging downstream across the rest of the country that will resist the deep penetration of the frigid air in Canada(shallow, low level penetrations that undercut the unfavorable upper levels that moderate fast going south will still occur).
The AO has an extreme spread but suggests a good environment to transport cold from high to mid latitudes.........but it doesn't tell us WHERE that will happen.
The NAO and PNA tell us WHERE. A +PNA and --NAO would send the cold deeply into the Midwest and East.......... What we have is a very negative --PNA suggesting the cold will hit the West. The NAO has been increasing which is lessening the chance for much penetration farther east. However, it's still a bit negative, so some of the cold is coming in, especially just south of the Canadian border.
https://www.cpc.ncep.noaa.gov/products/precip/CWlink/daily_ao_index/ao.shtml
https://www.cpc.ncep.noaa.gov/products/precip/CWlink/pna/nao.shtml
https://www.cpc.ncep.noaa.gov/products/precip/CWlink/pna/pna.shtml
++++++++++++++++++++++++++++++++++++++++++++
https://www.psl.noaa.gov/map/images/ens/t850anom_nh_alltimes.html
This is the 500mb anomaly below at the end of the period....15 days.... from the GFS ensemble mean. The anomalies and teleconnections are very favorable for cold air delivery from high to mid latitudes.
What locations will be hit are the big question. There is a Greenland block type set up too, with such a strong positive anomaly over Greenland and negative one to the south.........which could suddenly change the outlook to MUCH colder in the East.
The West definately looks coldest at this point in time.........but this could change really fast.
Last 12z European model turns COLDER in week 2 instead of milder, like the previous run showed.
So ng is having a huge bounce.
Natural gas futures rallied early Wednesday as weather models trended somewhat colder overnight and as forecasters monitored potential for chillier conditions to develop late this month. The January Nymex contract was up 13.1 cents to $3.878/MMBtu at around 8:50 a.m. ET. Models overnight trended colder compared to Tuesday’s midday runs, which appeared to be driving…
metmike: The 12z models yesterday, started the colder solutions that carried on overnight and took ng to sharply higher.
The 12z GFS is coming out milder but the overall pattern still has potential for some extreme cold. Individual ensemble members on many solutions are all over the place in week 2 so there is tremendous uncertainty for the end of December onward.
https://www.marketforum.com/forum/topic/78991/#79001
12z GFS was -11 HDD's....much milder.
for week ending December 10, 2021 | Released: December 16, 2021 at 10:30 a.m. | Next Release: December 23, 2021
https://ir.eia.gov/ngs/ngs.html -88 BCF
| Working gas in underground storage, Lower 48 states Summary text CSV JSN | |||||||||||||||||||||||||
|---|---|---|---|---|---|---|---|---|---|---|---|---|---|---|---|---|---|---|---|---|---|---|---|---|---|
| Historical Comparisons | |||||||||||||||||||||||||
| Stocks billion cubic feet (Bcf) | Year ago (12/10/20) | 5-year average (2016-20) | |||||||||||||||||||||||
| Region | 12/10/21 | 12/03/21 | net change | implied flow | Bcf | % change | Bcf | % change | |||||||||||||||||
| East | 818 | 843 | -25 | -25 | 886 | -7.7 | 830 | -1.4 | |||||||||||||||||
| Midwest | 982 | 1,019 | -37 | -37 | 1,064 | -7.7 | 1,000 | -1.8 | |||||||||||||||||
| Mountain | 199 | 206 | -7 | -7 | 224 | -11.2 | 205 | -2.9 | |||||||||||||||||
| Pacific | 261 | 266 | -5 | -5 | 307 | -15.0 | 285 | -8.4 | |||||||||||||||||
| South Central | 1,158 | 1,171 | -13 | -13 | 1,261 | -8.2 | 1,160 | -0.2 | |||||||||||||||||
| Salt | 328 | 328 | 0 | 0 | 350 | -6.3 | 335 | -2.1 | |||||||||||||||||
| Nonsalt | 829 | 842 | -13 | -13 | 912 | -9.1 | 826 | 0.4 | |||||||||||||||||
| Total | 3,417 | 3,505 | -88 | -88 | 3,743 | -8.7 | 3,481 | -1.8 | |||||||||||||||||
Totals may not equal sum of components because of independent rounding. | |||||||||||||||||||||||||
Working gas in storage was 3,417 Bcf as of Friday, December 10, 2021, according to EIA estimates. This represents a net decrease of 88 Bcf from the previous week. Stocks were 326 Bcf less than last year at this time and 64 Bcf below the five-year average of 3,481 Bcf. At 3,417 Bcf, total working gas is within the five-year historical range.
For information on sampling error in this report, see Estimated Measures of Sampling Variability table below.

Note: The shaded area indicates the range between the historical minimum and maximum values for the weekly series from 2016 through 2020. The dashed vertical lines indicate current and year-ago weekly periods
U.S. Natural Gas Storage
https://www.investing.com/economic-calendar/natural-gas-storage-386
Latest Release Dec 16, 2021 Actual-88B Forecast-86B Previous-59B
| Release Date | Time | Actual | Forecast | Previous | |
|---|---|---|---|---|---|
| Dec 16, 2021 | 10:30 | -88B | -86B | -59B | |
| Dec 09, 2021 | 10:30 | -59B | -54B | -59B | |
| Dec 02, 2021 | 10:30 | -59B | -57B | -21B | |
| Nov 24, 2021 | 12:00 | -21B | -22B | 26B | |
| Nov 18, 2021 | 10:30 | 26B | 25B | 7B | |
| Nov 10, 2021 | 12:00 | 7B | 10B | 63B |
The Energy Information Administration (EIA) reported an on-target 88 Bcf withdrawal from natural gas storage inventories for the week ending Dec. 10, which had little initial impact on futures prices. Ahead of the EIA report, a Bloomberg survey as of Wednesday produced a range of withdrawal estimates from 77 Bcf to 91 Bcf, with a…
metmike: Models overnight to a big jump colder, with low double digit increases in HDD's. It's interesting that the highs were made just before 6am.........so far. ..after the 06z GFS came out colder than yesterday but not as cold at the one around midnight.
Yes, and it is this next polar express to the South that is going to propel the Orange Juice. Instantaneous $2.50 a pound and why not? In a cafe, restaurant, bar(watch out for pricks!) or at home, isn't a fine glass of orange or grapefruit real juice as worthy as a good cup of coffee? Care to weigh in? No beans to grind, for one thing! Stimpy's friend back at Local's Forum. Who remembers Local's Forum, the drinking, smoking and money being made there. I passed out more than a few times just by hanging out there for even a few hours! That was a professional's "Trading Bar", reminds me of 'Limit Up' Bar just inside the Chicago Board of Trade. Deep dive made back in the 80's my first ever visit to the old pit trading arena.
The 12z model runs are milder and ng has collapsed lower.
And when you have crazy winds across the country, you get crazy amounts of wind power.
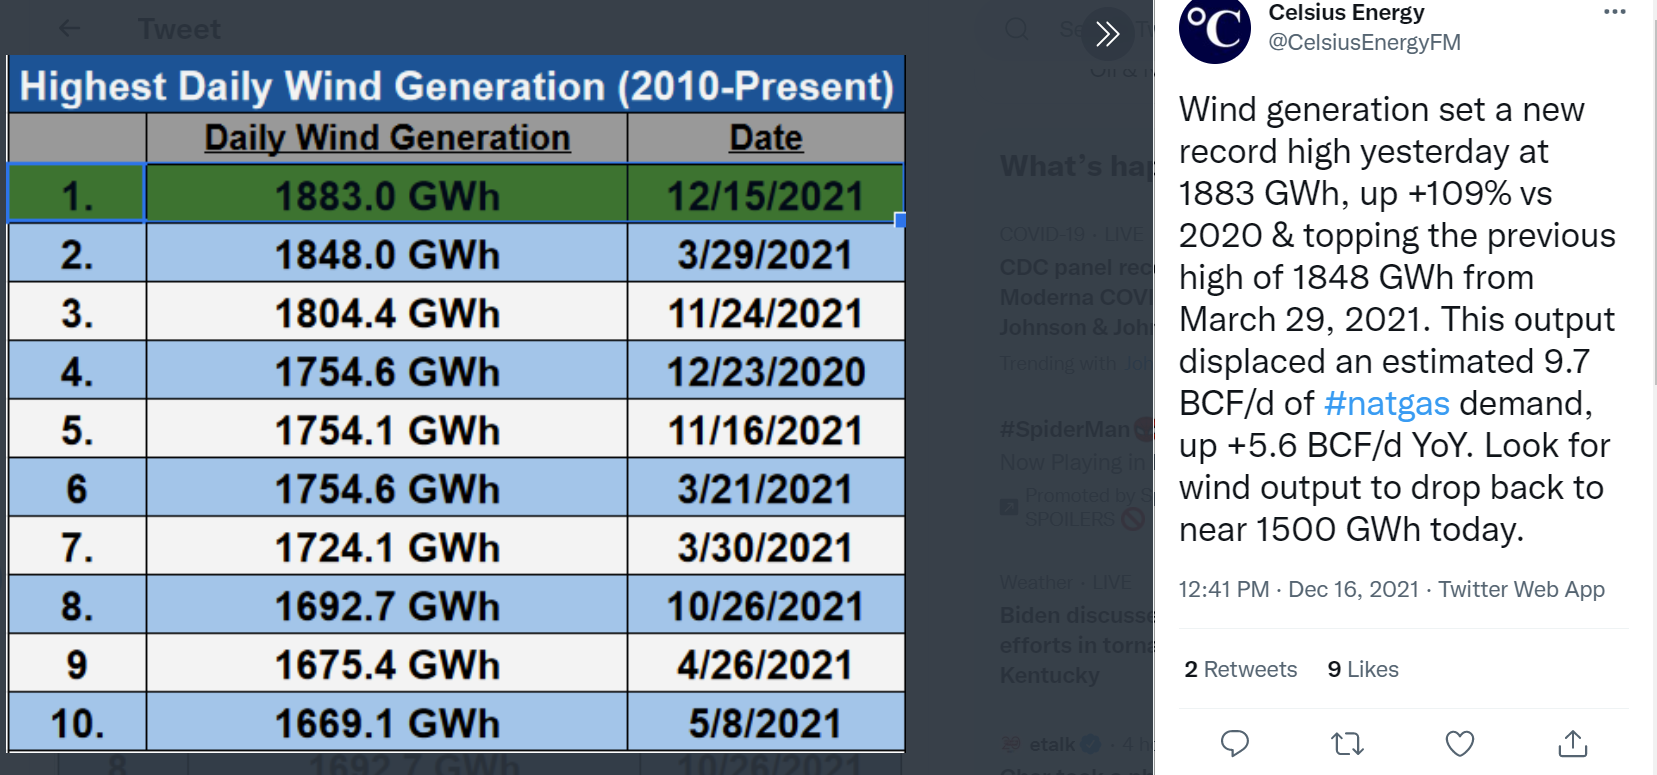
This is a wonderful point that I wasn't even thinking about Jim. Thanks a billion....or in this case, 9.7 BCF/day (-:
metmike: Yep, milder weather models = crashing ng prices.
7 day temps ending last Fri for this last EIA report. Warm Plains/Upper Midwest....chilly Southeast.
0z European model is -6 HDD's milder.
NG under selling pressure from that solution.
The last several GFS solutions have also been the same of milder.
The extremely wide spread of the AO is the most interesting.
https://www.cpc.ncep.noaa.gov/products/precip/CWlink/daily_ao_index/ao.shtml
https://www.cpc.ncep.noaa.gov/products/precip/CWlink/pna/nao.shtml
https://www.cpc.ncep.noaa.gov/products/precip/CWlink/pna/pna.shtml
++++++++++++++++++++++++++++++++++++++++++++
https://www.psl.noaa.gov/map/images/ens/t850anom_nh_alltimes.html
This is the 500mb anomaly below at the end of the period....15 days.... from the GFS ensemble mean. Lots of daily changes to the late week 2 outlook. Great uncertainty for the end of December.
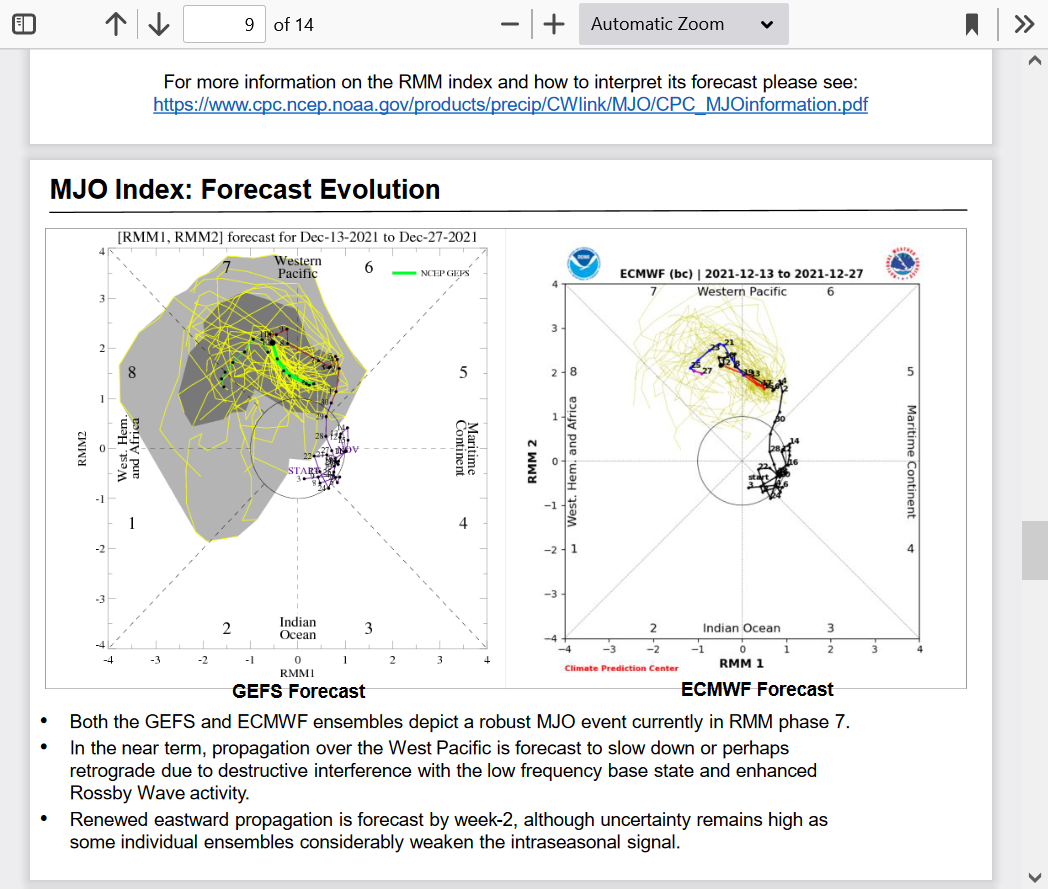
Phase 7 is potentially cold! 8 is even colder based on previous analogs.
See below. We need the NAO to turn down/negative!
However, we still have the potential for models to turn sharply colder than they show right now with plenty of frigid air in Canada to tap into.
https://www.cpc.ncep.noaa.gov/products/precip/CWlink/MJO/mjoupdate.pdf
The pattern is setting up to turn into a cold northern US, warm southern US regime as the month goes us with tremendous uncertainty on how far south the cold will go.
A slight shift north or south will mean a huge difference in temperatures for areas in the tightest part of the temperature gradient.
Pattern to turn MUCH colder at the end of the Month!
More this weekend!
6Z and 12Z Sunday models were all milder than the previous runs after being colder for several solutions.
Same basic pattern, except the temperature bands all shift north 100+ miles and the temp gradient is so tight with this pattern, that it makes a difference of 10 HDD+.
All the weather is below at these linds........warm week coming up for the southern 2/3rds. No White Christmas this year!
Then, turning sharply colder.......but how cold in early January?
https://www.marketforum.com/forum/topic/78385/
https://www.marketforum.com/forum/topic/78385/#78399
Any thoughts Larry....others?
Agree. Models showing colder at the end of second week. Looks like they expect it to get pretty far south.
Thanks Mark,
Wondering if Omicron and crude getting hit might be a negative.
Mike,
Regarding wx, alone, it looks like a battle between losing a sizable number of HDDs during weeks 1 & 2 since Friday and the continued threat of significant cold dominating starting late in week 2 and especially just beyond. There appears to have been some hesitation in the cold moving forward in forecast time on the weekend GEFS runs mainly. At these relatively low prices, it looks like about a stale mate so far this evening vs Friday’s close.
I don’t envy meteorologists’ tough forecasting job right now. I think this is reflected in a lot of variance of ensemble members.
Thanks much Larry! Agree.
metmike: That might have been a factor but the main factor from what I see is the legit threat for more cold coming with time from some of the extreme cold in Canada leaking south.
Natural gas futures traded either side of even in the early morning hours Tuesday as the market weighed near-term warmth against the potential for frigid temperatures to dip into the Lower 48 to kick off 2022. After dropping as low as $3.719/MMBtu in after hours trading, the January Nymex contract was up 3.8 cents
metmike: Yep. However, the market's reaction to it has been impossible to time or gauge. The last European model was -9 HDD's and we sold off overnight before the reality of the colder pattern late in the period taking over kicked in. But that colder pattern has been there since Saturday, as I posted with high confidence.
https://www.marketforum.com/forum/topic/78991/#79214
It's been traded...........sporadically. The loss of HDD's ahead of the colder pattern probably has a lot to do with it as Larry mentioned too.
added 12-21-21 : To be honest, the models don't look as cold today as they did over the weekend for early January!
I think today is one of those days when Europe is having a bullish influence.
Thanks Larry,
The GFS came out -12 HDD's bearish and we had a big spike down, to -$1,000/contract lower than the highs early in the solution but came back to the highs......bounced around for awhile, then when the European model came out the same as its previous solution(that was milder) dropped back down around -$800/contract and are trading so just around +$280/contract higher on the day.
Sorry to just use money but thats how my mind thinks after trading it for 30 years, which is what matters.
7 day temps for this Thursday's EIA number. Needless to say, it will be very small compared to the average for that week. There was also a tremendous amount of wind during that period(for generating power for electricity to displace ng use)..........record amount in fact from the 2 monster/deep low pressure storms with that caused the severe weather outbreaks.
1. Dec 10-11
2. Dec 15-16
3. Dec 12 was also very windy

Map illustrating installed wind generating capacity for U.S. states at end of 2018. Compare with wind speed map.

Power from wind generated annually
since 2000
https://www.wpc.ncep.noaa.gov/dailywxmap/index_20211210.html
December 10-11 storm
December 12 was windy too from strong gradient
December 15-16 storm
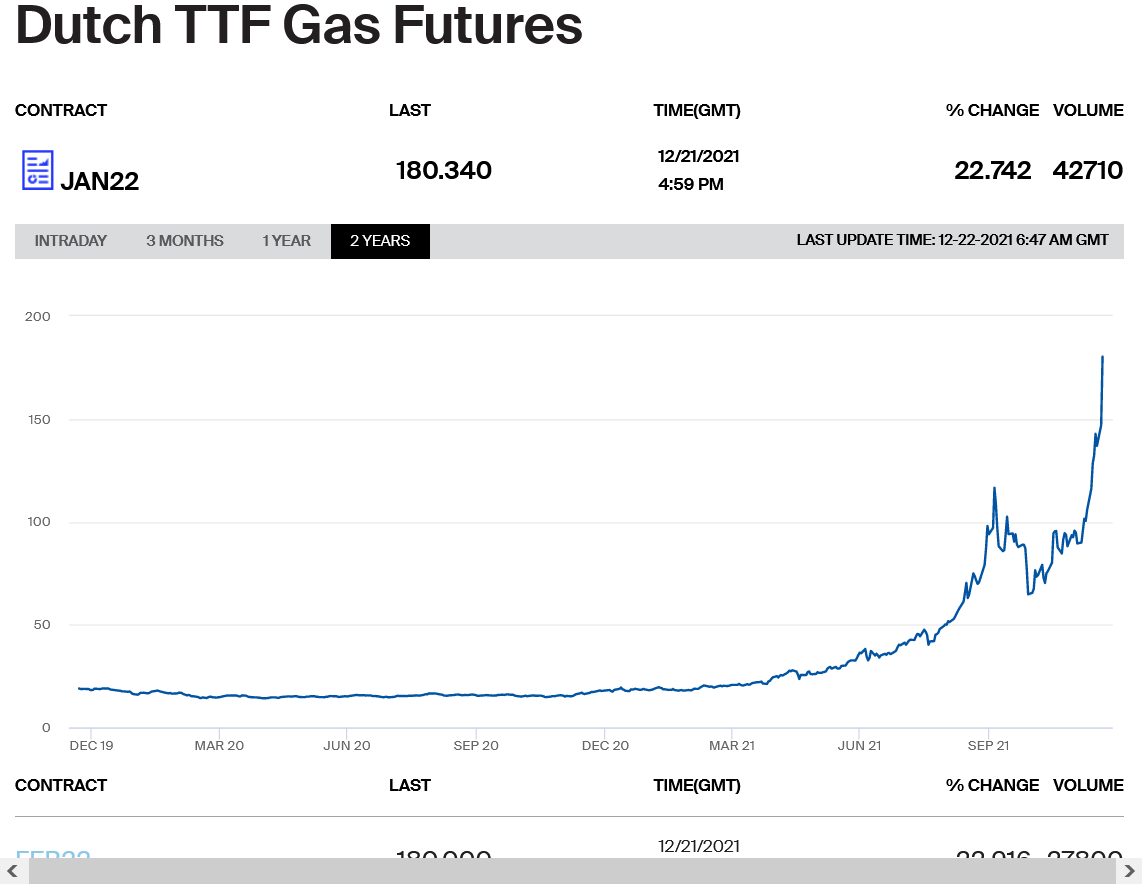
European natural gas prices thru Tuesday ....WOW!
https://www.theice.com/products/27996665/Dutch-TTF-Gas-Futures/data?marketId=5325990&span=3

As the change to colder get closer, the intensity of the cold continues to dwindle.
The market has been on a mission to go higher though because it WILL get colder, even as HDD's in the 2 week period drop on some model solutions.
Latest MJO discussion.
Signal appears to be weakening.
https://www.cpc.ncep.noaa.gov/products/precip/CWlink/MJO/mjoupdate.pdf
MetMike
I need a translation for the "discussion".
Cyclewise, I am tempted to buy, especially since today exhibited a willingness to not stay negative.
Would a short risk a three day weekend AFTER the huge gap down (filled, then back down)?
USA is overdue for a taste of winter---explosive rally, or too much supply?
Also, you have mentioned staying up or getting up for 2am updates. What other times do updates get reported?
Hi tjc!
I've mentioned this before. Weather models are coming out all day every day.
The GFS comes out 4 times a day, every 6 hours.
The European model comes out AFTER the GFS and 2 times a day, every 12 hours.
They take around 90 minutes each time.
Here's a schedule that somebody posted that is WAY OFF on the times but the point is, it shows how models are constantly coming out.
The European Ensemble is the most important, followed by the GFS ensemble.
https://www.33andrain.com/model-times/
If you don't have your own source of this data, continually providing timely, live updates.......you can't use it to trade and even then, it causes incredible, gyrations that are often over reactions that make it tough to just trade these spikes based on model updates and sometimes, cause the market to spike in the WRONG direction before coming back and reversing after the reaction.
Natural gas is not the market that it was 20 years ago, cut out for position weathaer traders, when you could count on it following a predictable/consistent path based on powerful weather patterns, especially in the Winter.
Larry knows.
With regards to the latest MJO, the suggestion is that it's not going to have a great impact and the models don't think so either but the models might be under estimating.
What I have noticed since Saturday, when I had high confidence in it turning MUCH colder at the end of December and first part of January is that every day, the intensity of that cold looks to be less and less.......even as the cold gets closer....but the market still wants to go higher.
Latest:
Just Updated the key factors for week 2 weather here for you:
EIA report -55. Neutral. TTF has been falling away from it's spike. And the wx isn't supporting.
The Farmer's almanac and its prediction of a frigid winter has been a big bust so far.
for week ending December 17, 2021 | Released: December 23, 2021 at 10:30 a.m. | Next Release: December 30, 2021 -55 BCF Neutral
| Working gas in underground storage, Lower 48 states Summary text CSV JSN | |||||||||||||||||||||||||
|---|---|---|---|---|---|---|---|---|---|---|---|---|---|---|---|---|---|---|---|---|---|---|---|---|---|
| Historical Comparisons | |||||||||||||||||||||||||
| Stocks billion cubic feet (Bcf) | Year ago (12/17/20) | 5-year average (2016-20) | |||||||||||||||||||||||
| Region | 12/17/21 | 12/10/21 | net change | implied flow | Bcf | % change | Bcf | % change | |||||||||||||||||
| East | 809 | 818 | -9 | -9 | 849 | -4.7 | 791 | 2.3 | |||||||||||||||||
| Midwest | 963 | 982 | -19 | -19 | 1,021 | -5.7 | 953 | 1.0 | |||||||||||||||||
| Mountain | 188 | 199 | -11 | -11 | 214 | -12.1 | 195 | -3.6 | |||||||||||||||||
| Pacific | 247 | 261 | -14 | -14 | 297 | -16.8 | 276 | -10.5 | |||||||||||||||||
| South Central | 1,155 | 1,158 | -3 | -3 | 1,214 | -4.9 | 1,114 | 3.7 | |||||||||||||||||
| Salt | 334 | 328 | 6 | 6 | 339 | -1.5 | 321 | 4.0 | |||||||||||||||||
| Nonsalt | 820 | 829 | -9 | -9 | 875 | -6.3 | 793 | 3.4 | |||||||||||||||||
| Total | 3,362 | 3,417 | -55 | -55 | 3,596 | -6.5 | 3,328 | 1.0 | |||||||||||||||||
Totals may not equal sum of components because of independent rounding. | |||||||||||||||||||||||||
Working gas in storage was 3,362 Bcf as of Friday, December 17, 2021, according to EIA estimates. This represents a net decrease of 55 Bcf from the previous week. Stocks were 234 Bcf less than last year at this time and 34 Bcf above the five-year average of 3,328 Bcf. At 3,362 Bcf, total working gas is within the five-year historical range.
For information on sampling error in this report, see Estimated Measures of Sampling Variability table below.
Note: The shaded area indicates the range between the historical minimum and maximum values for the weekly series from 2016 through 2020. The dashed vertical lines indicate current and year-ago weekly periods.
https://www.investing.com/economic-calendar/natural-gas-storage-386
Latest Release Dec 23, 2021 Actual-55B Forecast-56B Previous-88B
| Release Date | Time | Actual | Forecast | Previous | |
|---|---|---|---|---|---|
| Dec 30, 2021 | 10:30 | -88B | |||
| Dec 23, 2021 | 10:30 | -55B | -56B | -88B | |
| Dec 16, 2021 | 10:30 | -88B | -86B | -59B | |
| Dec 09, 2021 | 10:30 | -59B | -54B | -59B | |
| Dec 02, 2021 | 10:30 | -59B | -57B | -21B | |
| Nov 24, 2021 | 12:00 | -21B | -22B | 26B |
From earlier:
A large decline in heating demand expectations in the latest round of forecasts sent natural gas futures tumbling in early trading Thursday. The January Nymex contract was down 16.1 cents to $3.815/MMBtu at around 8:55 a.m. ET. Forecasts trended warmer overnight to significantly lower projected demand day/day, with the change particularly pronounced in the European…
metmike: This is what I've been saying the last few days. It's hard to impossible to know now when the market is going to react to these changes. Models have taken out more cold risk almost every day since the weekend..........but we still went up on Tue and Wed and decided on Thu to react to the less cold.
Natural gas futures took a major step back Thursday as an upcoming cold snap was seen not packing quite as much punch as initially expected. Though the latest government inventory data showed continued tightness, the January Nymex gas futures contract settled 24.5 cents lower day/day at $3.731/MMBtu. The February contract dropped 23.0 cents to $3.630.…
metmike: Less cold on Tue, Wed and Thu but the market went up Tue and Wed and crashed on Thu.
Mike,
I know it is NG with its unpredictability, realize an expiration is coming up in a couple of days, and realize there have been several head fakes of strong cold potential moving further east than the upper Midwest into some higher population areas, but I’d be surprised if NG doesn’t open up pretty solidly Sunday evening on increasing cold potential further east into at least much of the rest of the Midwest in week 2. This is especially considering the recent relative bargain prices. Do you agree?
Agree Larry!
https://www.marketforum.com/forum/topic/78385/#78399
I'll be in Detroit the next several days but still be checking in.
As forecasts continued to offer signs of a chillier start to 2022, natural gas futures advanced in early trading Monday. The January Nymex contract was up 14.8 cents to $3.879/MMBtu at around 8:50 a.m. ET, albeit well off the $3.979 high reached in off-hours trading over the weekend. Prices gapped higher following the Christmas holiday…
metmike: Less HDD's on the 0z models put some bearish pressure on prices........for awhile but the colder air is still coming.
Weather-driven demand losses in the latest round of forecasts saw natural gas futures give back some of their recent gains in early trading Tuesday. Coming off a 32.9-cent rally in the previous session, the January Nymex contract was 4.3 cents to $4.017/MMBtu at around 8:50 a.m. ET. The February contract was down 5.5 cents to…
metmike: The pattern shift that brings in colder air is still there on some models but many model runs weaken the cold as we get closer .......with less HDD's.
12z models completely change the pattern late in week 2 to warm the West way up with upper level ridging building where there is deep troughing.
There are a couple of potential changes downstream that aren't clear right now but the most likely one appears to be cutting off the extreme cold connection into Canada and threat for that extreme cold to push into the US.
A more moderate brand of cold, would then be aimed at the East while the West warmed WAAAY up.
Weather models teasing additional January cold helped to rally natural gas futures early Wednesday ahead of front month expiration. The January Nymex contract was up 15.5 cents to $4.210/MMBtu at around 8:50 a.m. ET. After Tuesday’s runs produced warmer trends, weather models shifted colder overnight by “enhancing colder risks” for the eastern half of the…
metmike: This is what I mentioned yesterday with a potential pattern change.
18Z GEFS was the coldest run yet for the length of the run for the US as a whole and especially for the eastern half of the US. To top that off, it looked cold still at the end.
Thanks Larry!
Temperatures for tomorrow's EIA report. Mild in much of the country. Chilly in CA/NV as well as right along the Canadian border.
Most of the indices have shifted away from major cold risks in the US in the extended period. There is cold in Canada and the northwest US right now that is headed east soon but a huge pattern change in week 2 will change the flow/steering currents during the 2nd week in january, making is less likely for major cold to invade and penetrate deeply into the US.
The Northeast quadrant, still could be at risk for cold with the right dynamics amplifying.
When there is a pattern change like this, uncertainty is always high, so things could morph differently in a big hurry.
With the market closed for 3 days, it's the recipe for a huge gap higher or lower on Sunday Night.
The most likely outcome with the new pattern will be the West going from recent extreme cold to very mild.
Latest extended discussion/update here:
Amid mixed overnight weather trends, natural gas futures skidded lower early Thursday as traders prepared to digest another round of government inventory data. Heading into its first day as the prompt month, the February Nymex contract was off 5.0 cents to $3.800/MMBtu at around 8:50 a.m. ET. Surveys show a wide range of expectations for…
metmike: Actual HDD's were pretty bullish on the 18z GFS and 0z European, mainly from better penetration of cold that's out West, headed east the next 2 weeks... but the pattern late in the period is reducing the threat of extreme cold.
Great uncertainty though.......other than the West is going from extreme cold to mild.
-136 BCF
for week ending December 24, 2021 | Released: December 30, 2021 at 10:30 a.m. | Next Release: January 6, 2022
| ge, Lower 48 states Summary text CSV JSN | |||||||||||||||||||||||||
|---|---|---|---|---|---|---|---|---|---|---|---|---|---|---|---|---|---|---|---|---|---|---|---|---|---|
| Historical Comparisons | |||||||||||||||||||||||||
| Stocks billion cubic feet (Bcf) | Year ago (12/24/20) | 5-year average (2016-20) | |||||||||||||||||||||||
| Region | 12/24/21 | 12/17/21 | net change | implied flow | Bcf | % change | Bcf | % change | |||||||||||||||||
| East | 777 | 809 | -32 | -32 | 815 | -4.7 | 758 | 2.5 | |||||||||||||||||
| Midwest | 918 | 963 | -45 | -45 | 979 | -6.2 | 913 | 0.5 | |||||||||||||||||
| Mountain | 180 | 188 | -8 | -8 | 205 | -12.2 | 187 | -3.7 | |||||||||||||||||
| Pacific | 235 | 247 | -12 | -12 | 290 | -19.0 | 265 | -11.3 | |||||||||||||||||
| South Central | 1,116 | 1,155 | -39 | -39 | 1,186 | -5.9 | 1,084 | 3.0 | |||||||||||||||||
| Salt | 326 | 334 | -8 | -8 | 334 | -2.4 | 315 | 3.5 | |||||||||||||||||
| Nonsalt | 790 | 820 | -30 | -30 | 852 | -7.3 | 769 | 2.7 | |||||||||||||||||
| Total | 3,226 | 3,362 | -136 | -136 | 3,476 | -7.2 | 3,207 | 0.6 | |||||||||||||||||
Totals may not equal sum of components because of independent rounding. | |||||||||||||||||||||||||
Working gas in storage was 3,226 Bcf as of Friday, December 24, 2021, according to EIA estimates. This represents a net decrease of 136 Bcf from the previous week. Stocks were 250 Bcf less than last year at this time and 19 Bcf above the five-year average of 3,207 Bcf. At 3,226 Bcf, total working gas is within the five-year historical range.
For information on sampling error in this report, see Estimated Measures of Sampling Variability table below.
Note: The shaded area indicates the range between the historical minimum and maximum values for the weekly series from 2016
https://www.investing.com/economic-calendar/natural-gas-storage-386
| Release Date | Time | Actual | Forecast | Previous | |
|---|---|---|---|---|---|
| Dec 30, 2021 | 10:30 | -136B | -125B | -55B | |
| Dec 23, 2021 | 10:30 | -55B | -56B | -88B | |
| Dec 16, 2021 | 10:30 | -88B | -86B | -59B | |
| Dec 09, 2021 | 10:30 | -59B | -54B | -59B | |
| Dec 02, 2021 | 10:30 | -59B | -57B | -21B | |
| Nov 24, 2021 | 12:00 | -21B | -22B | 26B |
Thursday after the close:
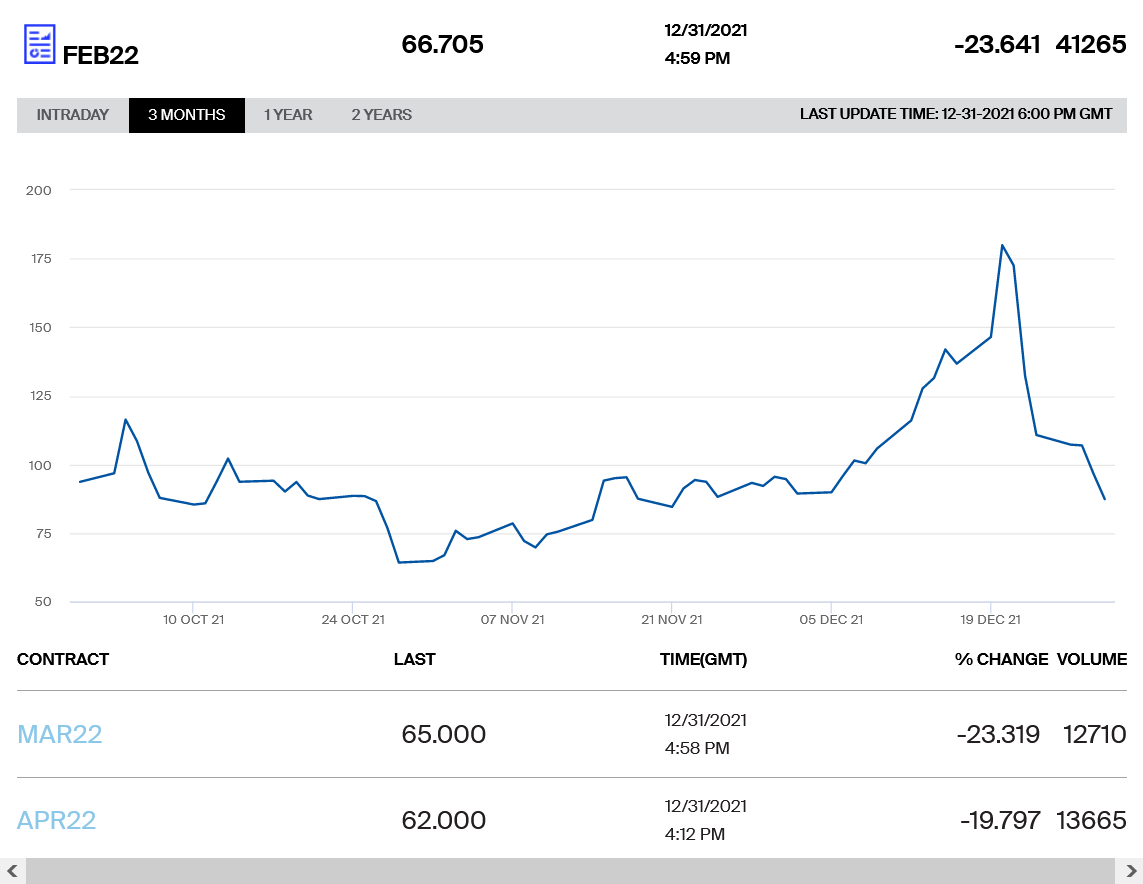
Natural gas futures traders must think fireworks are an overrated way to ring in the new year, as the only sparks on Thursday were those resulting from prices slamming the pavement. The February Nymex futures contract dropped 28.9 cents to settle at $3.561/MMBtu in its debut at the front of the curve. March tumbled 26.1…
Much uncertainty here on Friday morning.
The upcoming pattern change in week 2 is likely to cut off the extreme cold that has been pouring into Canada, some of it getting into the West and N.Plains.
Warming up in the West and, initially sending the remaining cold eastward....as it moderates.
Then, the pattern is more favorable for new cold to move east but how much will there be left by week 3?
Things could look a whole lot different, in 2 days, when we open up the new year for next week's trading. Happy New Year!
Am wondering if near record warm temps in Europe right now are a negative for US NG prices.
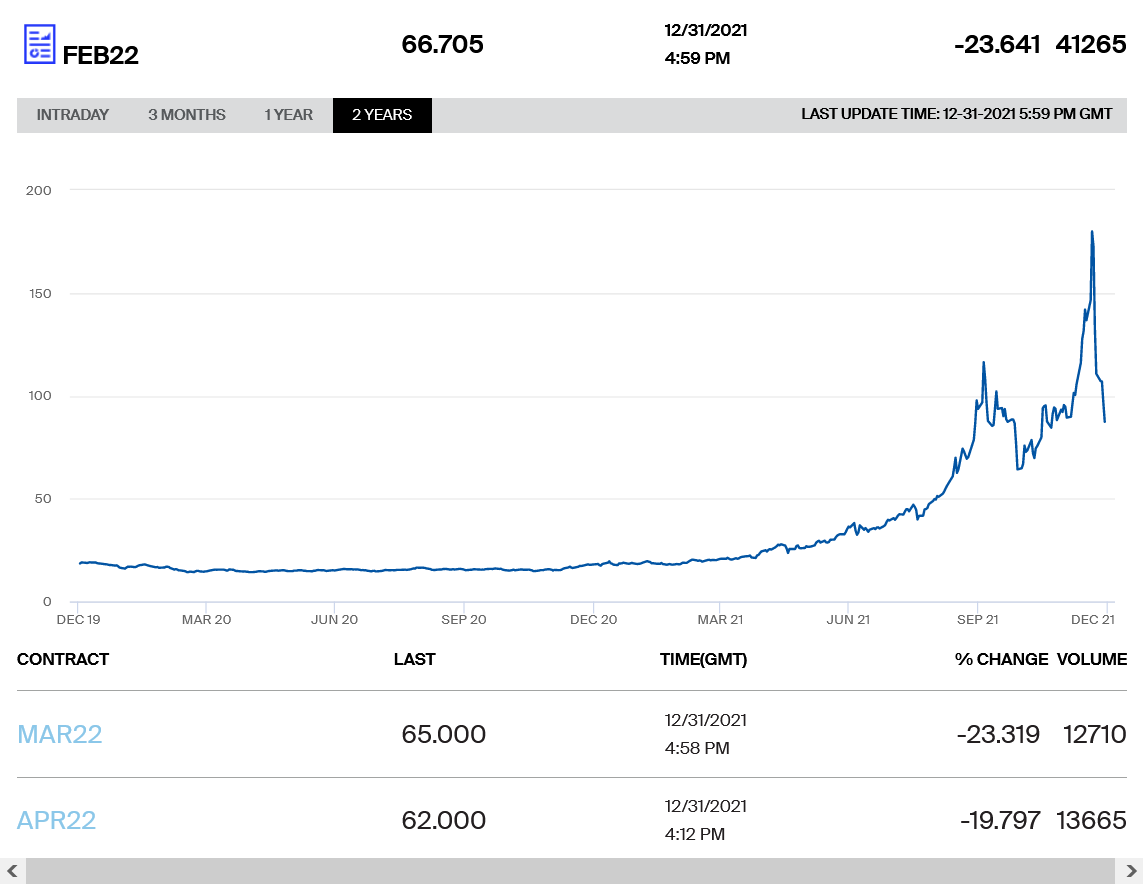
NG prices in Europe have been collapsing the past week!
https://www.theice.com/products/27996665/Dutch-TTF-Gas-Futures/data?marketId=5336900&span=1
The NG market is dumb. First of all, we’ve already been reading recently that Europe prices are trivial compared to the US and it is obvious why. Secondly and most importantly, the pattern change for NG from Dec to Jan is solidly bullish with a change from near record -PNA to +PNA by week 2. Of course you’re going to lose the severe cold anomalies in the NW to NC US when you go from a near record -PNA to a +PNA. And those areas are very low consumption areas for NG, regardless. Most importantly, you’re at the same time going from record warmth in much of the E half of the US (much higher consuming area) to a below normal dominated pattern there in at least the first half of January. This is like night and day for NG usage!
I’m not talking about this from a biased traders’ standpoint as I’m usually not in a NG position. NG in many cases hasn’t moved in correlation to US wx related demand in recent years. It has obviously been very hit and miss. So being flat has been my favorite position. I’m talking from a purely objective view of weather related demand changes. There’s nothing bearish whatsoever about the upcoming US weather pattern change. In contrast, it is solidly bullish without question. NG is up sharply today, which makes perfect sense, but it being near multimonth lows earlier today is just plain dumb.
Thanks Larry!
While I agree with most of that, the neutral AO(after being solidly negative for the past 2 weeks) and slightly +NAO are potential warning signs for getting overly bullish from the obvious pattern change.
It looks still looks like modest cold in the Northeast and this is January. The later it is in the heating season, the more intense the cold must be in order to support a bullish reaction(in the absence of precariously low supplies-and we have more than enough for the rest of the Winter).
Also, the spike higher earlier this week was strongly led by the expiring front month, January contract, so that was likely way overdone to the upside and took Feb with it...... and the drop after that was, at the very least a move back to reality.
This was the Friday 8-14 day outlook, which I agree with.
Some of the recent cold has hit the Great Lakes and Northeast so the biggest areas that are cooler are the Southeast, but I agree that it will be much cooler than December in those high population regions.
However, look at the 6-10 day below that and tell me THAT pattern isn't the one that you'd prefer to be long with. But the 6-10 day temps are extremely transient based on left over cold from the December pattern.
With there being a pattern change in week 2, to a much different pattern, there is tremendous uncertainty.
Also, an amplification of the new pattern, with the upper level ridge in the West expanding and connecting to the higher latitudes, would be much more favorable for a deepening of the downsteam trough and for air coming from high latitudes to be transported deeply into the Eastern half of the US.
The biggest bearish factor in these changes is that the frigid air pooling in Canada all December, within striking distance of the US but never moving very far east..............is going away. So, although it will cool down in the East, the threat of EXTREME cold has actually diminished.
But the Canadian model disagrees and is pretty bullish for widespread major cold in the US in January. More on the next page.
The 8-14 day looks more like the January pattern.


The Canadian ensemble model is an outlier at the end of 2 weeks today........at least with the average. Several members have extreme cold plunging all the way to the Southeast US.
384h GZ 500 forecast valid on Jan 16, 2022 12 UTC


Forecasts for the control (GEM 0) and the 20 ensemble members (global model not available)
I took a look at the individual members of the GFS ensembles and changed my mind(adjusted the position) about the potential type of cold coming to the East. Your view assisted in that Larry.........thanks.
There are enough of them that look like potential major cold and the uncertainty of how the warmer West, colder East pattern will actually shape up after the models catch on to it........that I'm leaning colder now.
This was the 12z GFS ensemble solution.
1. The 6-10 map probably implies more demand per day than the 8-14 due to the much colder MW, but the NE/MidAtlantic demand, a very high demand area, overall is colder per day on the 8-14 map. Note the colder anomalies from New England through Baltimore. So, the amount the 6-10 is colder than the 8-14 may actually not be that much.
2. But even the 8-14 implies way more demand than December with a MUCH colder Midwest, NE US, and most of SE US. You're calling it "modest cold" in the NE quadrant based on there not being deep blue colors (which technically depict probabilities of cold rather than degree of cold although I realize they correlate) but it is still implying good chance for BN in the coldest time of year in the NE to Chicago to MSP strip and much, much colder than Dec, which is what brought the market down so far. Outside of TX, much of the warmest colors are in very low demand areas of the Plains.
Even the 8-14 map implies to me a likely EIA draw of 200++. So, I repeat that there's nothing bearish about it.
One more thing: I think the 8-14 may not be cold enough, especially in the SE.
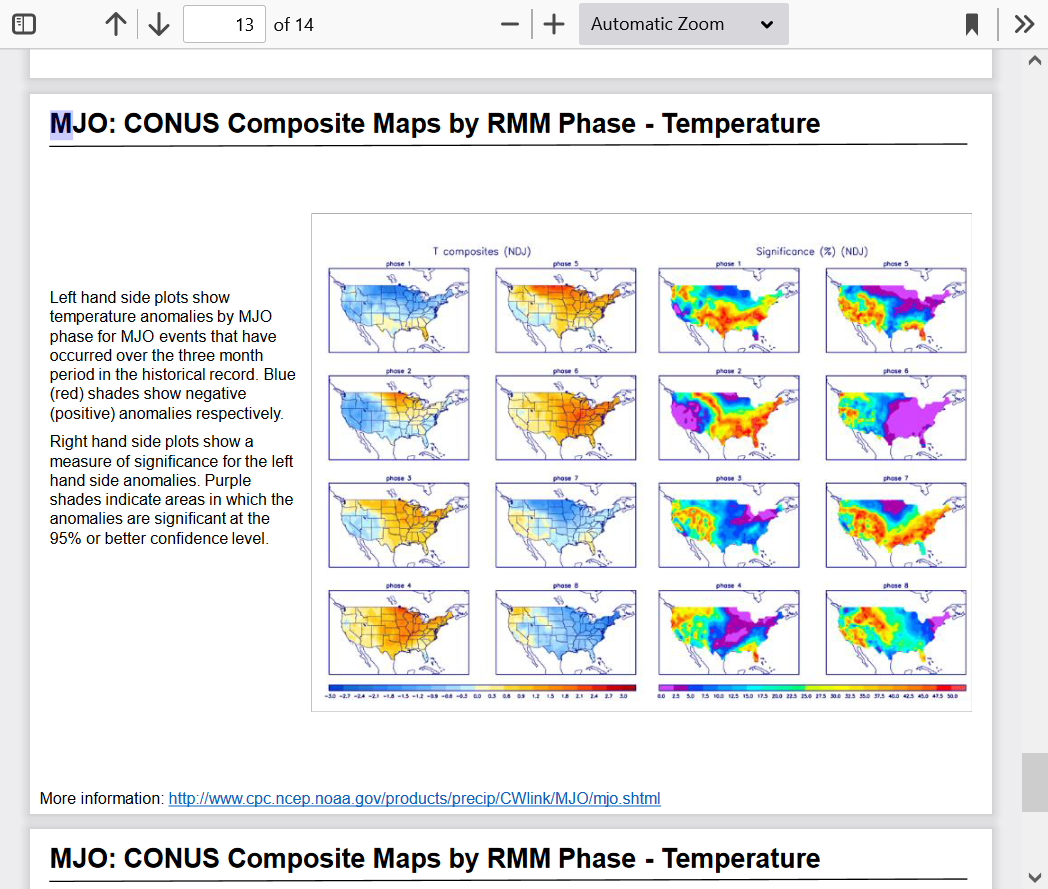
Remember the MJO posts I made a month or so ago about the implications for late Dec turning cold in the E US? Well, what has happened is a major stall/delay way longer than predicted. now it is finally moving very slowly toward phase 8 it appears. That in combo with a +PNA, is typically cold for the E US.
3. I agree with you here 100% because a solid +PNA is generally bullish:
"Also, an amplification of the new pattern, with the upper level ridge in the West expanding and connecting to the higher latitudes, would be much more favorable for a deepening of the downsteam trough and for air coming from high latitudes to be transported deeply into the Eastern half of the US."
4. You said:
"The biggest bearish factor in these changes is that the frigid air pooling in Canada all December, within striking distance of the US but never moving very far east..............is going away. So, although it will cool down in the East, the threat of EXTREME cold has actually diminished."
Threat or not, there never was actually forecasted to be frigid air making it into the E US due to the -PNA holding it at bay. It was frigid to the NW to the upper Plains largely due to it being a -PNA pattern. With the -PNA ending and transitioning to +PNA, those areas to the NW naturally almost have to warm up a lot. I don't know about "frigid" per se, but the new pattern still shows much colder coming to the E US.
5. I maintain that as a futures market, NG has been dumb with it being near lows this morning. Mark my words that should what's shown on the 8-14 map verify and a similar pattern continue well into January, NG will rise sharply from current levels for the next couple of weeks. I would not want to be short right now. Maybe the market finally realized this with the nice afternoon rise.
Thanks Larry,
Before reading your last post, I re analyzed based on having a good discussion with you on this and looking at your very respected views and made an adjustment above with the GFS Ensemble individual solutions.
Earlier, when I saw the very cold looking Canadian model, I had assumed that it was an outlier but considering the individual solutions of the other ensembles, some very cold, I'll just chalk it up to model disagreement as the models catch on to the new pattern.
I believe you too on the MJO. I highlighted your posts on that several times and watched it more closely because of that.
It's influence has been dampened out going eastward(unable to propagate far enough eastward to affect weather this far downstream) and if that would break loose eastward, that phase is highly correlated with some mighty cold in the US.........finally.
I thought the 3-4 week forecast was odd with below temps in the Northwest, considering where we will likely be at the end of week 2.....much above temps. It looks more like the current pattern.

The thing about models, is that the parameters that are set, are not always accurate to reality. And can change in 6 hours. The market reponds to them, even though they might be inaccurate. The reality of today, is not what directs our course in trading. Except on report day. But, rather, the imagined future prospect. And that is what we focus on.
Thanks Mark,
Models are just ten of thousands of mathematical equations(mostly calculus) that represent the physical laws of the atmosphere.
These equations are "solved" after feeding in initial conditions in the form of measurements/observations of temperature, pressure, wind, moisture and so on from the bottom to the top of the atmosphere at various key levels and time frames.
Like you said, the GFS GLOBAL model is run every 6 hours with data that is 6 hours fresher each time and out to 384 hours-16 days. Other GLOBAL models are run every 12 hours.
Regional models can be run every hour with new hourly observations. They don't go out that far in time.
The market will put more weighting on the European Ensembles, that come out every 12 hours, then the GFS ensembles.
The ensembles are dozens of different solutions of the same model, with slight variations in a parameter/equation to get a solution thats like a 2nd, 3rd, 4th....etc opinion..........because the main operational model does NOT have the omnipotent equations that are always right under every condition.
Each individual ensemble member might do better under certain situations and bad under other situations.
Turns out, when you average them together(the mean) you filter/balance out the extremes/outliers and are extremely consistent from run to run and in the long run, have the best product.
1 individual run might go from one extreme to the opposite extreme 6 hours later but that only happens with a few at the most. The rest, stay on the previous path because, really, not much has changed in 6 or 12 hours that will justify an extreme change going forward.
The biggest problem by far is that errors magnify with time.
None of the models will be too different from each other 5 days from now, for instance.
However, a slight variation at 5 days can grow into an entirely different pattern in 15 days. The disparity grows with time. The more models/solutions that you average in, the more you can average out these extreme outliers.
However, sometimes, the outliers are picking up on something new. In that case, you will often have several other members that see the same thing, against the other ones that haven't seen it yet. If there is only 1 outlier against dozens of others against it........then you should throw it out.
New thread: