Prediction for tomorrow is +25.
As Mike said, less cold in the second week.
Exports are back to normal capacity.
Wind generation is above 1700 Gwh, which displaces about 8BCF/day of NG.
Europe still struggling to get winter injections. Dutch TTF is moving higher.
Here's the link to the previous ng thread:..........clearly the most consistently active trading topic.
NG 11/11/21+
58 responses |
Started by MarkB - Nov. 11, 2021, 8:56 a.m.
https://www.marketforum.com/forum/topic/77552/
Natural gas futures careened on Wednesday amid profit-taking and expectations for a relatively plump storage increase for mid-November. The December Nymex contract dropped 36.1 cents day/day and settled at $4.816/MMBtu. January fell 35.6 cents to $4.914. NGI’s Spot Gas National Avg. shed 18.5 cents to $4.845. The prompt month had advanced more than 38 cents…
metmike: Models were not AS cold and ng, as usual, over reacted. Down almost $6,000/contract from the high on Tuesday-5.392 to the low on Wednesday-4.800.
At the end of 2 weeks, the CMC model is now the coldest with the most pronounced ridge/west, trough east couplet, followed by the Canadian model that has a pretty extensive trough from the Great Lakes to the Gulf Coast. Then the European model that was the coldest but has only a very slight ridge/west, trough east couplet and the mildest is the GFS which is almost straight zonal, west to east flow.
The GFS still has a positive anomaly in northern Canada to Greenland with a slight weakness in the EastCentral US seen below.
Same cold anomaly as earlier this week but its filled in, so the connection between those 2 features might be too weak to cause a Greenland block northern stream to flush air down from high latitudes to the mid latitudes(as was indicated the previous 2 days).
The negative anomaly off the Northwest Coast is part of the Pacific jet stream branch that is indicated to be more dominant with the zonal, west to east streamlines(that don't drop much crossing the country) and air flow.
To get good merional flow(north to south), the streamlines should drop from north to the south as they cross North America and the air basically travels in between them, if you imagined them sort of like the banks in a river of air.
This could amplify again pretty easy and look pretty cold or could completely deamplify entirely, with straight west to east steering currents and widespread above temps spreading all the way to the East Coast(where temps right now, still are a category below average, like maybe -5 degrees)
Temperatures for that EIA report at 9:30 am Thursday, ending last Friday.
Should be a double digit, late season injection, thanks to the mild wx over a large part of the country, especially the Midwest.
metmike: GFS, which has been the least cold, was a bit colder overnight. ....but still, the trend in week 2 is moderation to a milder regime.
https://ir.eia.gov/ngs/ngs.html
![]()
for week ending November 12, 2021 | Released: November 18, 2021 at 10:30 a.m. | Next Release: November 24, 2021 Neutral to a tad bearish at +26 BCF
| Working gas in underground storage, Lower 48 states Summary text CSV JSN | |||||||||||||||||||||||||
|---|---|---|---|---|---|---|---|---|---|---|---|---|---|---|---|---|---|---|---|---|---|---|---|---|---|
| Historical Comparisons | |||||||||||||||||||||||||
| Stocks billion cubic feet (Bcf) | Year ago (11/12/20) | 5-year average (2016-20) | |||||||||||||||||||||||
| Region | 11/12/21 | 11/05/21 | net change | implied flow | Bcf | % change | Bcf | % change | |||||||||||||||||
| East | 900 | 897 | 3 | 3 | 951 | -5.4 | 908 | -0.9 | |||||||||||||||||
| Midwest | 1,079 | 1,075 | 4 | 4 | 1,137 | -5.1 | 1,091 | -1.1 | |||||||||||||||||
| Mountain | 212 | 213 | -1 | -1 | 241 | -12.0 | 220 | -3.6 | |||||||||||||||||
| Pacific | 261 | 258 | 3 | 3 | 319 | -18.2 | 303 | -13.9 | |||||||||||||||||
| South Central | 1,191 | 1,175 | 16 | 16 | 1,304 | -8.7 | 1,202 | -0.9 | |||||||||||||||||
| Salt | 331 | 324 | 7 | 7 | 349 | -5.2 | 330 | 0.3 | |||||||||||||||||
| Nonsalt | 860 | 850 | 10 | 10 | 955 | -9.9 | 871 | -1.3 | |||||||||||||||||
| Total | 3,644 | 3,618 | 26 | 26 | 3,954 | -7.8 | 3,725 | -2.2 | |||||||||||||||||
Totals may not equal sum of components because of independent rounding. | |||||||||||||||||||||||||
Working gas in storage was 3,644 Bcf as of Friday, November 12, 2021, according to EIA estimates. This represents a net increase of 26 Bcf from the previous week. Stocks were 310 Bcf less than last year at this time and 81 Bcf below the five-year average of 3,725 Bcf. At 3,644 Bcf, total working gas is within the five-year historical range.
For information on sampling error in this report, see Estimated Measures of Sampling Variability table below.

Note: The shaded area indicates the range between the historical minimum and maximum values for the weekly series from 2016 through 2020. The dashed vertical lines indicate current and year-ago weekly periods.
+++++++++++++++++++++++++++++++++++++++++++++++++++
https://www.investing.com/economic-calendar/natural-gas-storage-386
Latest Release Nov 18, 2021 Actual 26B Forecast 25B Previous 7B
| Release Date | Time | Actual | Forecast | Previous | |
|---|---|---|---|---|---|
| Nov 18, 2021 | 10:30 | 26B | 25B | 7B | |
| Nov 10, 2021 | 12:00 | 7B | 10B | 63B | |
| Nov 04, 2021 | 09:30 | 63B | 63B | 87B | |
| Oct 28, 2021 | 09:30 | 87B | 86B | 92B | |
| Oct 21, 2021 | 09:30 | 92B | 90B | 81B | |
| Oct 14, 2021 | 09:30 | 81B | 94B | 118B |
I still contend that NG is wildly over priced. To be within 2% of the 5 year average and yet prices are almost double of what we would normally see for this time of year? Yea....no.
Jim,
I agree with that if the statement was "if this was 2019".
Markets sometimes evolve and in this case, 3 HUGE greatly amplified fundamentals have suddenly popped up, that are causing a massive bullish influence pushing us MUCH higher than we were with those fundamentals not that big of a factor in 2019.
1. Prices in Europe have been trading to record highs because of extremely low supplies of natural gas.
2. Our export market has been massively expanding and the US natural gas market is now greatly affected by GLOBAL prices and fundamentals. We are no longer on our little island, trading just US fundamentals and market dynamics.
3. The war on fossil fuels. The big money is shying away from oil and gas investments and going where all the subsidies, grants, funding and tax breaks are......the fake green energy.............solar and wind. The ng rig count is still only half of what it was 3 years ago. We are still doing great with wells that were previously drilled and being developed..........but those will RUN OUT soon and either the rig count needs to ramp up quickly or we will start running out of ng. No doubt that much higher prices are needed to increase the rig count than in the past because every other time in history, when prices doubled.......the rig count went up fast...........but NOT this time.
Here's a comprehensive discussion on Marketforum of this from a couple of weeks ago:
https://www.marketforum.com/forum/topic/76792/#76918
4. This is part of #3. It's the intention of this administration and those on that side, regarding the fake climate crisis, to have higher prices for fossil fuels which is the best way to price them out, using market forces instead of regulations. The more expensive they are compared to solar and wind, the more solar and wind we will get.
I also agree strongly with you that NG is very overpriced here but am just stating the reasons why we have those really high prices at this point in time and why we are likely not going to ever see the lower prices of the past, correspond to similar storage levels then.
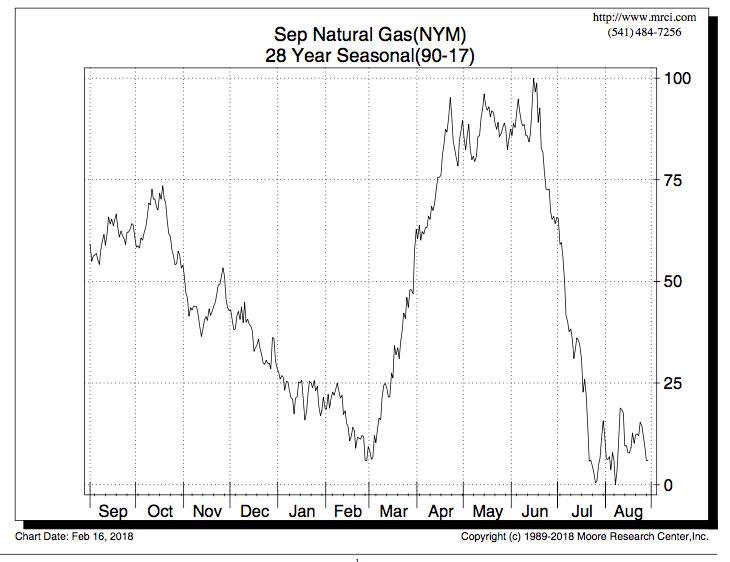
When the pattern turns milder in November, you don't want to be long natural gas! The little bounce in the seasonal below in the 2nd half of Nov was mostly from averaging in some spikes higher because of extreme cold waves and also some short squeezes as expiration approached in a low storage situation.
I couldn't agree more that the Biden administration is sticking it to oil and gas companies. But I think the pain has been to acute for Biden and he approved opening leases to oil companies last night. Even he isn't senile enough to know that high oil and gas prices are a sign of death for the Democrats in the next election. At this point he has to hope that prices come down fast.
While I am aware of our growing export business, we are still "land locked" and our exports are somewhat restricted by transportation constraints.
And to your point, we have so much untapped capacity at our disposal and is only a "well" away. People aren't stupid. They will start asking much harder questions about, why is this Administration begging OPEC for more oil and not US companies. Especially when oil companies are close to 2mbbls a day less now than they were before the pandemic. The side benefit for US companies not producing right now, is the "tight" market has to have them raking in the money right now. Good for them. Biden probably wishes they would go bankrupt, but he is effectively making them richer!
Quite the dilemna.
The greens are screaming at him to kill fossil fuels and the consumers are screaming at him for high prices because of those policies.
The fake green energy scam, as presented on the drawing board was destined to fail catastrophically from the get go.......and we are seeing just the early stages of why.
And the markets will end up ruling in the end..........as well as politicians do whatever they need to do to maximize votes.
Agree with you on this too.
Biden has to salvage RIGHT NOW in politics vs acting to save the planet in XX number of years from the current climate optimum, twisted to be a climate crisis for the long term global political objectives of Agenda 2030 from the United Nations....which is what the Climate Accord is REALLY about.
I'm actually all for this..........except for hijacking climate science and energy markets to accomplish a big part of it.
Sorry for the politics but its a key element right now for explaining our energy markets.
https://www.un.org/sustainabledevelopment/development-agenda/
I don't know why you're apologizing about politics. Our oil output, or lack of, is dominated by what Biden does and the influence The Progressives have over him. I read last night where a Republican won a mayoral election over a Democratic stronghold. The writing is on the wall and if they don't see it, they deserve to lose big in the next election.
Not to get preachy, but I get so sick of hearing about how everything is racist or has something to do with white supremacy, I would vote against ANYONE that uses those arguments during a campaign.
Good points Jim. People are hypersensitive about many things today and many things are just conjured up to create scenarios that don't exist to allow gatekeepers of the information to get control of people.
| Directors Cut | 11/16/2021 | |||||||
| NDIC | ||||||||
| Oil | M over M | M over M | Gas | M over M | ||||
| Mth | Mthly cum | Bbls/ D | Mthly cum | Mcf/ D | ||||
| 2021 | Sept | 33,402,299 | -3% | 1,113,410 | 1% | 90,467,024 | -1% | 3,015,567 |
| Aug | 34,323,696 | 3% | 1,107,216 | 3% | 91,774,175 | 3% | 2,960,457 | |
| July | 33,411,470 | -1% | 1,077,789 | -4% | 89,122,575 | 0% | 2,874,922 | |
| June | 33,845,554 | -3% | 1,128,185 | 0% | 89,477,475 | -3% | 2,982,583 | |
| May | 34,953,034 | 4% | 1,127,517 | 1% | 92,411,537 | 4% | 2,981,017 | |
| April | 33,646,529 | -2% | 1,121,551 | 1% | 88,898,778 | 0% | 2,963,293 | |
| March | 34,361,668 | 13% | 1,108,441 | 2% | 89,236,535 | 18% | 2,878,598 | |
| Feb | 30,324,555 | -15% | 1,083,020 | -6% | 75,710,555 | -14% | 2,703,943 | |
| Jan | 35,568,679 | -4% | 1,147,377 | -4% | 88,327,784 | -2% | 2,849,283 | |
| 2020 | Dec | 36,956,504 | 1% | 1,192,145 | -3% | 89,680,150 | 4% | 2,892,908 |
| Nov | 36,736,201 | -3% | 1,224,240 | 0% | 86,323,059 | -3% | 2,887,402 | |
| Oct | 37,909,008 | 3% | 1,223,107 | 0% | 89,083,281 | 5% | 2,873,654 | |
| Sept | 36,649,997 | 1% | 1,221,667 | 5% | 84,453,374 | 3% | 2,815,112 | |
| Aug | 36,126,492 | 12% | 1,165,371 | 12% | 81,692,742 | 14% | 2,635,250 | |
| July | 32,304,503 | 21% | 1,042,081 | 17% | 71,375,125 | 21% | 2,302,356 | |
| June | 26,703,268 | 0% | 890,109 | 4% | 59,198,681 | -1% | 1,973,289 | |
| May | 26,640,218 | -27% | 859,362 | -30% | 59,771,779 | -27% | 1,928,122 | |
| April | 36,572,571 | -17% | 1,219,086 | -15% | 81,365,042 | -16% | 2,712,168 | |
| March | 44,276,463 | 1,428,273 | 96,902,755 | 3,125,895 | ||||
| All time highs | ||||||||
| Oil | 1,519,037 | Bbls/D | 11/30/19 | |||||
| Gas | 3,145,172 | Mcf/D | 11/30/19 | |||||
| Rig count | 218 | 5/29/2012 | ||||||
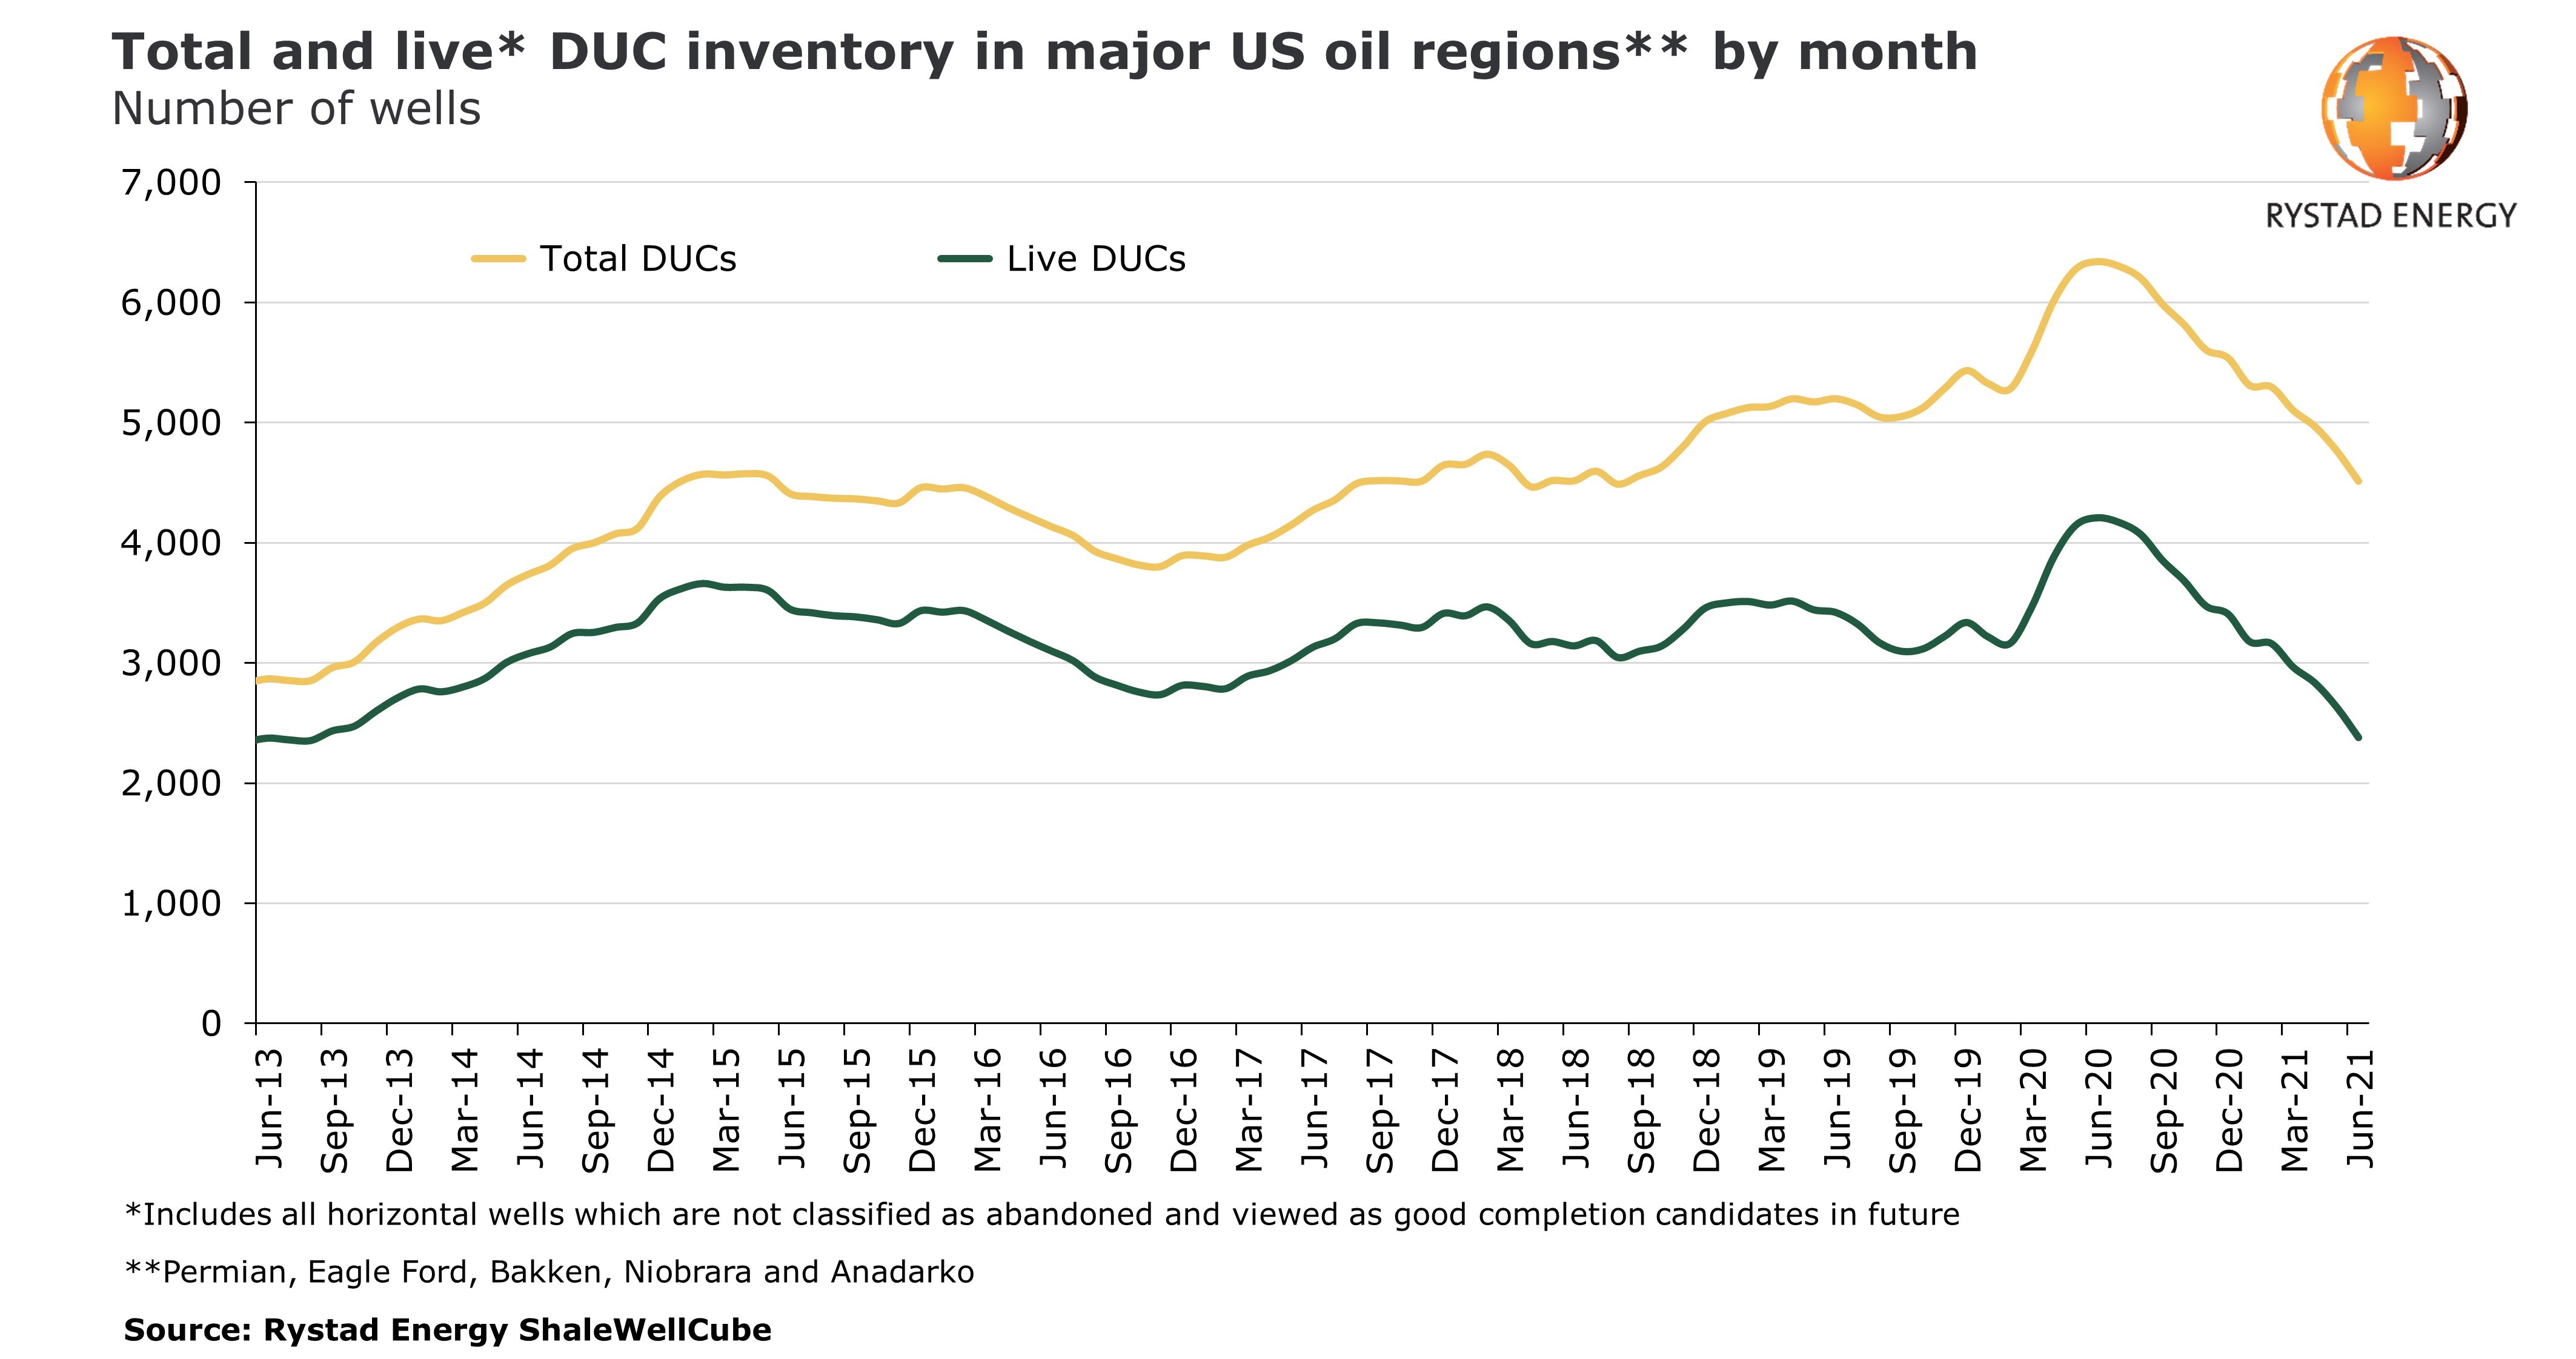
Could not be more clear. At current rig count new well volume insufficient to get back to 2019 highs. NG fairs better since operators/gathers have time and focus to connect flared NG.
Personal observation: Larger fracks 7M - 10M #s of sand not yielding the initial rates hoped for by the operators. See more test results where frack water returns dominate oil by 2 to 1.
Thanks very much Joe!
Are the DUC's(drilled but uncompleted) well numbers running low?
Where is that number now compared to 2 years ago, if you know it.
What does the rig count need to be in order to catch that number up to the highs 2 years ago.
How long does it take after drilling a new well for it to start producing?
Does it vary there and vary for other shale plays............based on geological formation for instance?
You can get all of Joe's reports for 2020/21 here:
Joelund ng reports "From the Bakken" 2020/21
Started by metmike - May 2, 2021, 5:25 p.m.
After some notable swings in after hours trading, natural gas futures hovered close to even in early trading Friday as forecasters highlighted volatility in the weather data. The December Nymex contract was up 3.7 cents to $4.939/MMBtu at around 8:50 a.m. ET. Weather models as of early Friday had been “all over the place” in…
metmike: Actually, the models are NOT all over the place(but the price sure has been). The GFS for instance has had almost the exact same HDD's for 3 solutions in a row and all the models show moderation but still a weak ridge/west, trough/east couplet, that is capable of amplifying and turning much colder pretty fast. But the forecast looks a bit more bearish than bullish to me and it would be shocking that we can still be hanging out just below $5.............if this were any other year with the current fundamentals. But our exports and the price in Europe(record highs recently from low storage) has added tremendous price premium to the price in the US, as has the war on fossil fuels that wants higher prices from the markets vs regulations to make solar and wind more competitive.
The fact that we can't go lower here, by itself seems bullish.
The AO and NAO are also less bullish this morning as they head back to near 0 at the end of 2 weeks....reducing the threat for extreme cold in December.........at least today. However, its that ridge west/trough east configuration late in week 2 that matters entirely. If it amplifies..........the temp forecast turns bullish fast. If it flattens out........the temp forecast turns bearish fast.
https://www.marketforum.com/forum/topic/75004/#77682
GFS was -5HDD's bearish but the market spiked up $1,000 as if it was bullish, not bearish.
This is not a market that wants to go lower on bearish weather updates as mentioned this morning.
Pump and dump... :)
World Oil
Bakken current estimat at 300 DUCs. Know of no place where DUCs are tracked with precision, however, recall NDIC disclosing estimate of 1000 DUCs in early 2019.
https://www.dtcenergygroup.com/bakken-5-year-drilling-completion-trends/
Outdated but helpful write of drill/completion of a Bakken well. Would add that most operators have further reduced Frac stages to 170 ' or 60 stages per well.
Takes about 17 days to drill a Bakken well, this assumes roads, pad, and oil. gas.water lines in. Frac operations on a single well now take about 7- 10 days , however, Fracs are done in multiples usually on pads in close proximity. This extends the time to complete a well. I don't complete wells but would estimate a well will produce /sell 4- 6 months after drilling completed.
What is the rig count "sweet spot"? Good question. Hell of a lot more rigs than we have working right now. Consider the peak production of 11 2019 occurred after 12 years of drilling with anywhere from 150 rigs to 200+ active.
Rigs are available I do see them stacked around. Would doubt that 100% of inactive rigs could be activated due to labor, skilled labor, parts shortages.
Thanks Joe, that helps answer alot!
I note the DUC #'s low here but just for ng, I would bet are LOWER.
Also, I featured a discussion on this here a few weeks ago. Feel free to chime in to elaborate or correct on anything Joe.
https://www.marketforum.com/forum/topic/76792/#76918
Maybe the market was expecting to see more NG wells drilled and they didn't get it.
Here are more good data links that I just found and haven't processed into my brain yet...some of it is repeating the same things stated elsewhere but it can't hurt to read something new.........more than once to help it stick in your brain!
https://www.marketforum.com/forum/topic/76792/#76918
https://www.eia.gov/todayinenergy/detail.php?id=48537

metmike: The 12z HDD's were actually a bit lower and slightly bearish, so the rally was not from colder maps.
Mike et al,
NG sometimes treats US wx like it is the most important thing and at other times doesn’t. It is inconsistent. US Wx is more often than not considered but the extent of that varies so much. Another thing is how individual market participants interpret the models/forecasts. This is far from straightforward as different folks have different interpretations. Not black and white.
Agree totally Larry.
To me, we could sort of break it down into different categories. Tell me if you agree or not.
1. Time of year and storage vs average. Whether its justified to trade weather or not. If it's April or September for instance and past the key time frames for trading temperatures that determine demand for ng use and the pattern is benign/average, the weather...........then weather gets such a miniscule consideration by SPECULATORS trading ng......that's irrelevant.
If it's December and storage is low, then every forecast POTENTIALLY matters and if the pattern is changing greatly it can really POTENTIALLY matter. Especially at turning points in a pattern change.......where the market has to dial in the new pattern.
2. We can break the POTENTIALLY matters into at least 2 categories of traders/trading. Larry will like this one.
a) Pure/short term HDD/CDD trading/traders. When each run of each model comes out, there is HDD/CDD data that comes out slowly as the run proceeds......out to 360 hours for the EE and 384 hours for the GFS. During more sensitive times of years and weather sensitive periods when weather counts from above, there's very frequently crazy spikes during the model runs when the DD's change a great deal, especially the EE model early in the morning. The early part of the run can have just 1 day that is warmer or colder and the market will immediately spike up or down and the next day can go in the exact opposite direction. Several days in a row like that, especially in week 2 as a result of a widespread temp difference and ng can spike $1,000 in just minutes. Often, after this OVER reaction, ng will retrace some of the spike but rarely comes all the way back if the overall change at the end of the period supports the direction of the spike.
b) Overall/big picture weather pattern(this one ca be broken down too). Models will always jump around from solution to solution, some individual runs can be +/- as much as 10 DD's but still feature the same pattern. When the big money comes in early in the morning, I think the main pattern gets more weighting and it can trump the DD changes, which is the way it should be.
It's sort of like trading DD's only is looking at the trees but trading the main pattern is looking at the forest. Day or even minute traders will do best trading the DD's but position traders will usually do best trading the pattern.
c) But even trading the pattern is not clear either. There are different factors that go into a weather pattern. You can go strictly by the model runs.........which by itself can be tricky because the GFS can be mild and the EE can be cold. Which one will the market give most weight to? Usually the EE but that only comes out 2 times a day and the GFS comes out 4 times a day.
Or, you can look at the underlying factors that tend to be superimposed on the models and define a REGIME ......cause future runs to be either colder or warmer because models......are models. They just go off of mathematical equations that don't always dial in perspectives on past anomalies or teleconnections/upsteam dynamics that humans are able to do. ........like the NAO or AO or state of the MJO out in the Pacific.
If you were the type of trader that liked to hold a position over a weekend, banking on having insight into the models changes over the weekend and cashing in on Sunday Night, then that last paragraph defines the element that you are placing a very high value/weighting on.
3. Then we have days like Friday. If you traded weather and didn't lose money on Friday you were either lucky or smart enough to pick spots to sell for instance, based on resistence or technicals to assist you and only stayed in for minutes.
I wish Katie would sell this site. Just when you start thinking the ad pop ups couldn't get any sillier, they do. But I digress.
If I was long NG and saw the NWS weather for the 10-14 time period, I am breaking out in a cold sweat because of what we might see at the open tonight. Again, I said might. Who knows, we could be up another 20 cents.
End of week 2 of the GFS is showing a pretty harsh drop in temps all the way to the FL panhandle. I would bet we open up in about an hour.
Mark,
You must be referring to the outlier, operational GFS that came out the run before this one during the late morning hours.
The market almost never pays attention to an operational GFS run because, as Larry calls it, the solutions are so jumpy. Especially an outlier one with almost no support from the ensembles.
The ensembles will get 10 times more weighting. They were slightly colder in week 1 but the trend in week 2 for days is moderation to above average temperatures.
In fact, the last week 2 solution of the GFS ensembles was the warmest one of the entire month maybe and only a tiny minority of cold members, only 1 being really cold.....vast majority very mild.
The Canadian ensembles on the other had several very cold members.
Regardless, I think we open LOWER!
December ng expires on Friday of this week........so volatility could be elevated this week.
Sharply lower open. Around 1,500 lower and 2,500 from the highs on Friday.
The main reason that it wasn't a gap lower is that very early on Friday we were trading moderately lower and the range on Friday from lows to highs was over $3,000!
December still has a bit more volume than January but that will flip soon with Dec expiring on Fri.
Tell me how prices are trading in Europe and I'll be more confident about ng here. It's been pretty stubborn at NOT dropping to new lows on week 2 forecasts warming up the last couple of trading sessions.
There are other potentially bullish underlying fundamental factors too, mentioned above.
Dutch TTF traded lower last thursday and friday.
Thanks Mark!
Looking at the actual chart of TTF suggests some potential correlation between that market and our ng market.
NG in Europe set an all time high price Oct 4th......the US ng market hit our highest price in over a decade on Oct 5th at just over 6.3.
However, the US market spiked back up to 6.2 on Oct. 27th, when Europe dropped to the recent low on Oct 28th, which was when the US market was trading very cold weather models and ignoring Europe.
The US market fell hard on Nov. 9th, which was in tandem with a drop to another low in Europe.....after several days of the US market not reacting bullishly to bullish US weather.
The problem is that there is US weather going on at the same time and other factors that makes for too many variables to pin down any one consistently and the tendency of humans to want to assume causation on correlation days when it could have been coincidence on some of those days(or something else, like weather or other news that the graphs can't tell us).
Rather than take up massive space with the actual price charts, I'll just post the links and have already stated a couple of key dates above.
What is important too is the pattern in Europe is one that shows the potential historic top for ng prices on Oct. 4th but also a bottom on Oct 28th at some significant support.
One can guess that as long as TTF stays above the Oct. 28th low, US ng prices will have at least "some" support (from that factor) at unusually high levels.
Again, several other key factors but am just trying to isolate the pure price factor from that one in this post, using data analysis and speculation combined.
Europe prices for 3 month, 1 year and 2 years below:
https://www.theice.com/products/27996665/Dutch-TTF-Gas-Futures/data?marketId=5303640&span=1
https://www.theice.com/products/27996665/Dutch-TTF-Gas-Futures/data?marketId=5303640&span=2
https://www.theice.com/products/27996665/Dutch-TTF-Gas-Futures/data?marketId=5303640&span=3
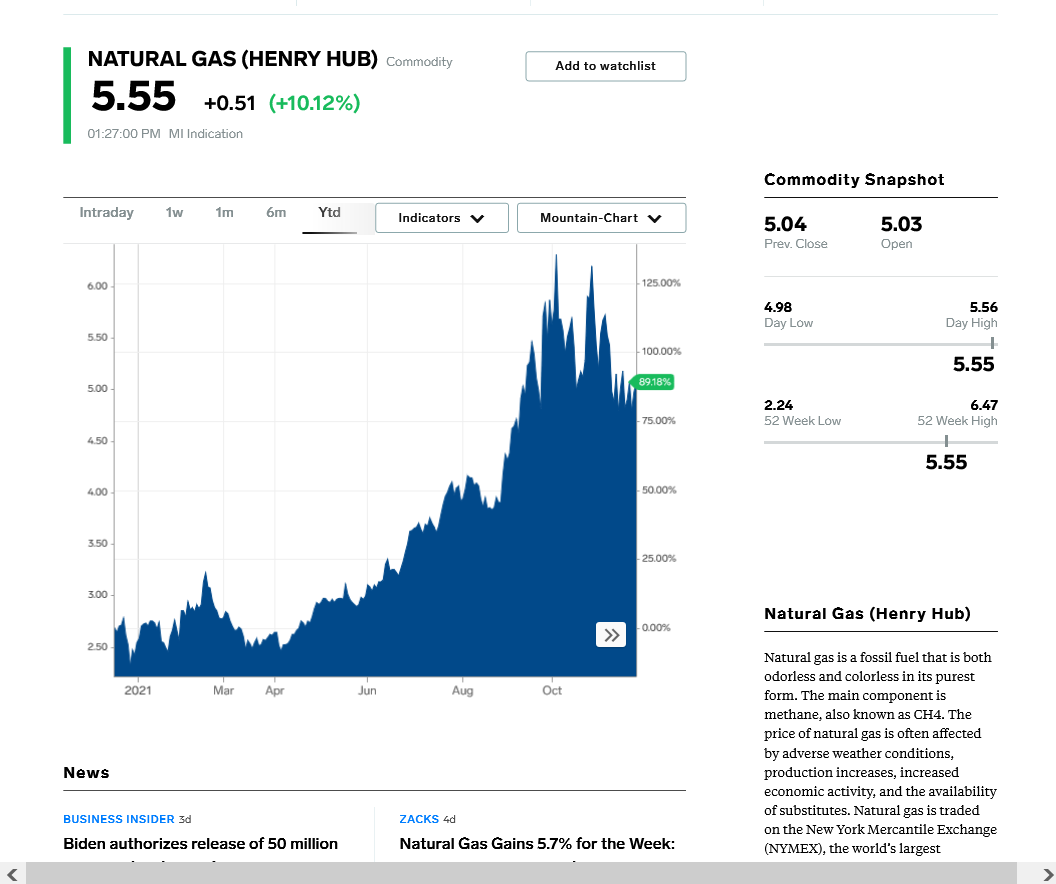
Go to the price chart for 6 months and MAX at the link below for good perspectives on US ng prices.
https://www.nasdaq.com/market-activity/commodities/ng:nmx
Another good link going back over 2 decades of ng prices:
https://www.macrotrends.net/2478/natural-gas-prices-historical-chart
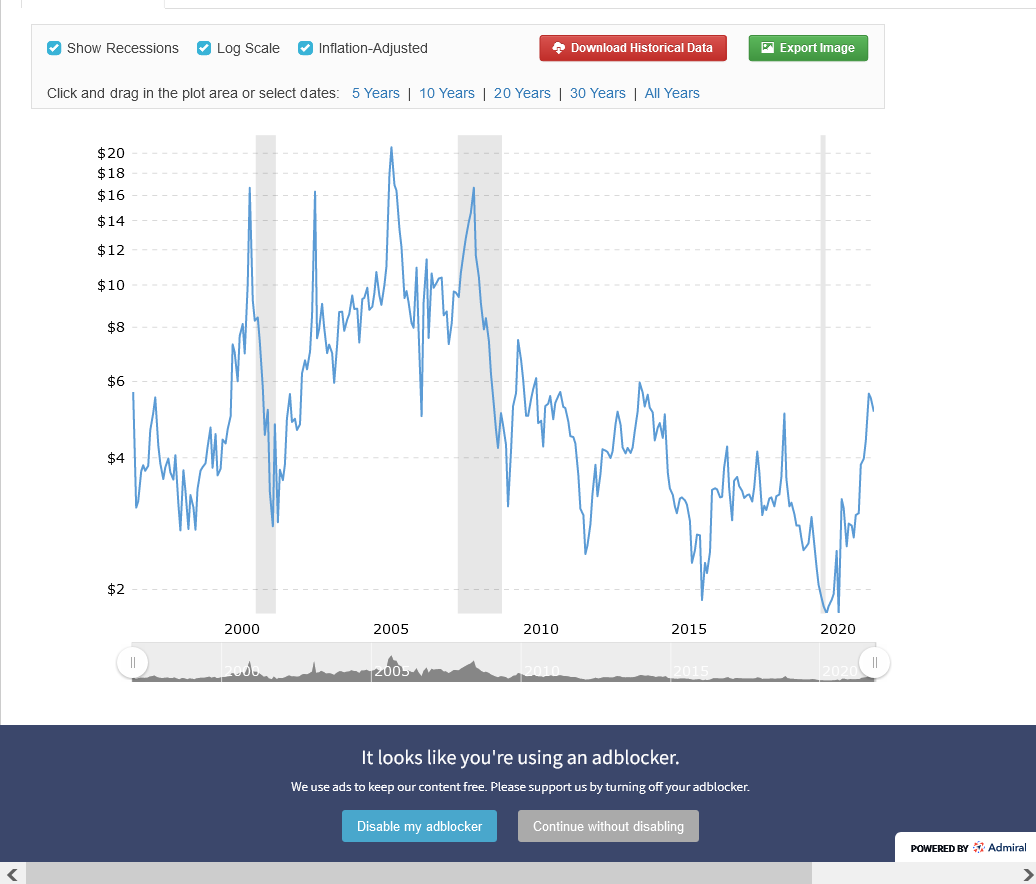
The extreme volitility and ranges during the Bush years, is rather daunting. I wasn't trading NG back then, just paying the bill. And I remember being surprised sometimes at how high it got. I'm big on using NG in my home. Much better than the heat pump/electric crap. At least now, I know what to expect in the coming months.
We could go higher, but I don't think we will. There have been many developments in NG in both the US and Russia since then. And we feed Mexico, as Russia feeds Europe. And still have more exports to other countries. But, yes, I've been watching the corellation with the European market, because we also export to them as well, which has become a sizable part of the market. When dictator Joe allows, of course.
Natural gas futures were down sharply in early trading Monday as weather models over the weekend advertised a pattern that would deliver notably warmer-than-normal temperatures for early December. The December Nymex contract was down 25.2 cents to $4.813/MMBtu at around 8:45 a.m. ET. Compared to Friday’s outlook, the largest change in the temperature outlook occurred…
metmike: No doubt that ng is following the much milder week 2 forecasts. As mentioned before the Sunday Night open, the week 2 GFS ensemble is the mildest of the entire month. EE was also -5 HDD's overnight.
AO/NAO also go positive and bearish towards the end of week 2. Last week they were solidly negative and bullish. PNA negative.
https://www.marketforum.com/forum/topic/75004/#77682
500 mb anomaly map extremely bearish at 2 weeks.
Volume for the January contract exceeded the front month December contract for good this morning. December expires this Friday.
Natural gas futures floundered Monday as the prospect of a coronavirus resurgence and the potential for weak weather demand extending into December weighed on markets. The December Nymex contract dropped 27.6 cents day/day and settled at $4.789/MMBtu. January fell 28.4 cents to $4.861. At A Glance: Forecasts point to light weather-driven demand next month New…
metmike: It was amazing that we were able to bounce $2,000/contract off the spike lows set just after 8am. This is an impossible market to position trade. Who wants to stay short for a bounce higher of that magnitude? No me! The strategy on all recent trades for me has been to just put in a trailing stop and get taken out quickly when the market decides to stop going in the right direction. At times, it will cut profits short but in this environment, more often than not its locked in profits that could have been lost.
At times, the price can move $200/contact in just seconds! There were a couple of times when storage was extraordinarily tight in the distant past or when a major hurricane was threatening with all the production still in the Gulf that we traded like this for awhile but that was over a decade ago.
Mike et al,
Watch the MJO. It is forecasted by the Euro and other models to be in a position that could bring a resurgence of cold into the E half of the US in mid to late December, especially if the NAO, AO, and PNA were to shift by 12/10.
Thanks Larry!!!
Madden-Julian Oscillation: Recent Evolution, Current Status and
Predictions
https://www.cpc.ncep.noaa.gov/products/precip/CWlink/MJO/mjoupdate.pdf
This last oz CMC model turned sharply colder late in week 2 compared to previous solutions.
0z European model a whopping +13 HDD colder than the previous 12z run!
Just a heads up. The EIA report comes out tomorrow.
Thanks Mark!
metmike: The GFS was actually a tad milder overnight. You can see what model the market trusts more(and this is a bull market, where bullish news trumps bearish news)
7 day temperatures for tomorrows EIA report.
Very mild western half. A bit chilly eastern half, outside of the Northeast.
Natural gas futures forged higher on Tuesday, recovering much of the ground lost a day earlier, as markets shifted attention to European supply woes and expectations for robust demand for U.S. exports of liquefied natural gas (LNG) through winter. The December Nymex contract climbed 17.8 cents day/day and settled at $4.967/MMBtu. January gained 17.4 cents…
metmike: As we've been saying, the ng market is not trading mostly weather every day like it did at this time of year for the past 3 decades.
The EIA report is tomorrow, then Thanksgiving, then Dec. expires on Friday, which even during a previous November would bring uncertainty. It's possible that some of the strength today was related to short covering ahead of expiration.
Larry,
On your MJO comment, I did note this study after you pointed this out:
https://agupubs.onlinelibrary.wiley.com/doi/abs/10.1029/2020GL088894
The results indicate that the statistical relationship between the MJO and SSWs is robust during La Niña years but almost nonexistent during El Niño years. During La Niña years, a significant response of stratospheric temperature appears after certain MJO phases with a distribution consistent with MJO periodicity, whereas the response becomes nonsignificant during El Niño years. Further analysis indicates that ENSO influences the MJO-related geopotential height anomalies in middle to high latitudes of the upper troposphere, which leads to an increase in wavenumber 2 in La Niña winters. And wavenumber 2 plays a key role in generating the strong heat flux anomalies in the stratosphere. The results may help to explain the more frequent occurrence of extreme events in the stratosphere, such as SSW during La Niña winters."
++++++++++++++++++++++++++++++++++++
Of course we need a -AO and -NAO......which we DON'T have.
Also, very often the La Nina(El Nino) will dampen out the MJO signal traveling eastward out of the Pacific with neutral ENSO conditions having the best chance to impact our weather.......with plenty of exceptions.
This is the WRONG configuration for extreme cold.....at least after 2 weeks but we should watch beyond that based on what you've alerted us to.
https://www.marketforum.com/forum/topic/78385/#78399
metmike: European model warmed up overnight but GFS cooled off but they both look pretty mild.
![]()
for week ending November 19, 2021 | Released: November 24, 2021 at 12:00 p.m. | Next Release: December 2, 2021
-21 BCF neutral/slightly bearish vs expectations???
These were the temps for that period: https://www.marketforum.com/forum/topic/77992/#78246
| Working gas in underground storage, Lower 48 states Summary text CSV JSN | |||||||||||||||||||||||||
|---|---|---|---|---|---|---|---|---|---|---|---|---|---|---|---|---|---|---|---|---|---|---|---|---|---|
| Historical Comparisons | |||||||||||||||||||||||||
| Stocks billion cubic feet (Bcf) | Year ago (11/19/20) | 5-year average (2016-20) | |||||||||||||||||||||||
| Region | 11/19/21 | 11/12/21 | net change | implied flow | Bcf | % change | Bcf | % change | |||||||||||||||||
| East | 889 | 900 | -11 | -11 | 937 | -5.1 | 890 | -0.1 | |||||||||||||||||
| Midwest | 1,066 | 1,079 | -13 | -13 | 1,134 | -6.0 | 1,075 | -0.8 | |||||||||||||||||
| Mountain | 210 | 212 | -2 | -2 | 242 | -13.2 | 220 | -4.5 | |||||||||||||||||
| Pacific | 262 | 261 | 1 | 1 | 320 | -18.1 | 302 | -13.2 | |||||||||||||||||
| South Central | 1,197 | 1,191 | 6 | 6 | 1,311 | -8.7 | 1,195 | 0.2 | |||||||||||||||||
| Salt | 338 | 331 | 7 | 7 | 355 | -4.8 | 330 | 2.4 | |||||||||||||||||
| Nonsalt | 859 | 860 | -1 | -1 | 956 | -10.1 | 865 | -0.7 | |||||||||||||||||
| Total | 3,623 | 3,644 | -21 | -21 | 3,943 | -8.1 | 3,681 | -1.6 | |||||||||||||||||
Totals may not equal sum of components because of independent rounding. | |||||||||||||||||||||||||
Working gas in storage was 3,623 Bcf as of Friday, November 19, 2021, according to EIA estimates. This represents a net decrease of 21 Bcf from the previous week. Stocks were 320 Bcf less than last year at this time and 58 Bcf below the five-year average of 3,681 Bcf. At 3,623 Bcf, total working gas is within the five-year historical range.
For information on sampling error in this report, see Estimated Measures of Sampling Variability table below.
Note: The shaded area indicates the range between the historical minimum and maximum values for the weekly series from 2016 through 2020. The dashed vertical lines indicate current and year-ago weekly periods.
+++++++++++++++++++++++++++++++++++++++++
https://www.investing.com/economic-calendar/natural-gas-storage-386
Latest Release Nov 24, 2021 Actual-21B Forecast-22B Previous26B
| Release Date | Time | Actual | Forecast | Previous | |
|---|---|---|---|---|---|
| Nov 24, 2021 | 12:00 | -21B | -22B | 26B | |
| Nov 18, 2021 | 10:30 | 26B | 25B | 7B | |
| Nov 10, 2021 | 12:00 | 7B | 10B | 63B | |
| Nov 04, 2021 | 09:30 | 63B | 63B | 87B | |
| Oct 28, 2021 | 09:30 | 87B | 86B | 92B | |
| Oct 21, 2021 | 09:30 | 92B | 90B | 81B |
And a hair closer to the 5 year average.
Hey Mike,
I finally got a chance to read this. Sorry about the delay. The article mentioned that certain phases during La Niña (like we’re now in) increase the chance for SSWs. But I couldn’t find those phases in the article. Did you see any?
Meanwhile, the current MJO forecasts still maintain the forecasted MJO track going in a path that would increase the chance for cold to dominate much of mid to late December in the E half of the US.
No I didn't see the phases Larry. i Haven't had the chance to read thru these and some don't have the complete report/study.
And here's a study that found something different:
Equal frequency of
stratospheric sudden warmings in
El Nino and La Nina
https://www.cpc.ncep.noaa.gov/products/outreach/proceedings/cdw37_proceedings/AButler.pdf
Revisiting the ENSO–SSW Relationship
https://www.proquest.com/openview/d89190fc127daddd74be84a016e94ea6/1?pq-origsite=gscholar&cbl=32902
In
other words, SSW events tend to occur more prefer-entially during both El Niño and La Ni ña winters (ENSO winters) than during ENSO-neutral winters.
Supporting their finding, the polar vortex exhibits en-hanced variability during both El Niño and La Ni ña
winters in comparison to during ENSO-neutral winter
https://ams.confex.com/ams/21Fluid19Middle/webprogram/Paper317541.html
metmike: Models were colder overnight but the pattern has NOT changed to colder..........just a bunch of colder HDD days within the same regime.......that turns very mild during week 2.
I feel that the main driving force here with the spike higher today (and this week) is the front month expiring today and converging with the extreme high price at Henry Hub vs historical relationships. The article below explains very well what we've been saying for almost 2 months now.
Amid a growing global reach for U.S. natural gas, and the coincidental timing of gas contract expirations, Henry Hub December basis prices are trading at a rare premium to New York Mercantile Exchange (Nymex) futures, NGI Forward Look data show. Historically, Henry Hub basis tracks within a penny or so of the comparable Nymex contract.…
Historically, Henry Hub basis tracks within a penny or so of the comparable Nymex contract. However, the spread began to widen in late September and has continued to expand since then. It reached as high as 3.0 cents on Monday before contracting a bit. A similar basis premium is seen through the February contract, according to NGI’s day-over-day forward basis price comparisons.
Until now, there have been only a few times since NGI launched Forward Look in 2012 that Henry Hub basis prices have moved more than 1.0 cent above the Nymex futures contract. “Even then, it was never like this,” said NGI’s Nathan Harrison, senior systems engineer.
A lot has changed since then.
NGI’s Patrick Rau, director of Strategy & Research, said liquefied natural gas (LNG) exports are likely the biggest reason that traders are willing to pay a premium in the physical market versus the futures market. He noted that a similar premium in LNG contracts linked to oil.
“Normally, oil price parity holds in the LNG market, meaning LNG prices don’t climb above 17.2% of the spot Brent crude oil price,” Rau said. “But the so-called slope of LNG in Asia has reached more than 40% in recent days.”
As for natural gas, Rau said there are two ways to settle the Henry Hub futures contract. Traders may sell the contract if they are long or buy it if they’re short. Alternatively, they can take it to physical delivery where they are obligated to make or take delivery of the gas.
“If more and more folks are doing that, then they are competing for gas in the market,” Rau said.
Not everyone needs gas at the Henry Hub, though. And if a trader exits the futures obligation, then the gas can be bought or sold as the trader wishes. However, the potential for make/take delivery is the reason the market sees short squeezes and massive liquidations ahead of the expiry, according to Rau.
“Lots of folks would be screwed if they were stuck with the gas and didn’t have transport out of the Henry Hub,” he said.
[Forward Look: Quickly understand where the price of natural gas is headed with these graphic day–on–day comparisons of NGI’s forward curves at 70 locations. View Now.]
With LNG export demand near all-time highs, netback prices on the Gulf Coast are roughly $30/MMBtu, according to NGI data. Furthermore, the thirst for LNG volumes appears unquenchable. Global natural gas prices remained strong Tuesday as benchmarks in Europe bounced back amid a colder forecast and supply shortages that are seen keeping the market tight. Asian prices also have unwavered amid supply issues at three LNG import terminals in the region and continued strong demand.
“The U.S. has never experienced a winter with so much gas exiting the country in the form of LNG, which could explain why we’ve never seen this kind of premium in physical versus futures gas before,” Rau said. “It’ll be interesting to see if that premium goes away when gas prices in Europe and Asia stabilize, but that likely won’t happen for a few more months at the earliest.”
Marex North America LLC’s Steve Blair agreed that LNG exports have dramatically altered the U.S. gas market. With the Northeast experiencing the only noteworthy cold in the country through early December, price risk is likely tied to global factors.
Global gas demand has lifted U.S. gas prices in recent weeks, according to Blair. “You’ve got two huge regions of the world that don’t have a lot of storage. We wouldn’t have had $6 gas without that.”
Saal and Blair separately noted that this isn’t the first time basis blowouts have occurred between the Henry Hub contracts. The market experts said the trend was fairly common in the 1990s and early 2000s, before the advent of shale development.
“Back then, though, everything that happened was because of something that happened domestically. Now, it’s a global market,” Blair said.
https://markets.businessinsider.com/commodities/natural-gas-price
There is a cold snap coming up in Europe next week(with their low storage) but by week 2 in the forecast there, temps are back to normal.
Day 4 below:
Day 15 below:
For the US, after some chilly weather the next 10 days or so in the East, the extremely mild weather spreads across the entire country as we go from the current cold -NAO to the very mild +NAO regime.
My bet is on sharply lower prices next week. This is the week 3-4 forecast. With a +NAO is will be extremely hard to get cold air into the US.
https://www.cpc.ncep.noaa.gov/products/predictions/WK34/

Nobody knows what NG will do from one day to the next with regard to how it treats model changes. Sometimes they have a bigger impact than at other times. Also, how a particular model run is interpreted isn’t always black and white as far as whether it is net bullish, bearish, or neutral. Some may be looking strictly at changes in DD whereas others may just be looking at late week 2. Others may look at both aspects as well as other things.
Having said all of the above, I think today’s rise was due mainly to both the EE and GEFS showing much colder in week 2 than what had been suggested by those models a few days ago. If you look at the HDD of both the GEFS and the EPS, they have been trending several HDD higher for each day of 12/4-9 over the last few days of runs although not always in a straight linear manner due to jumpiness that is common between runs. It isn’t that the model data has colder anomalies late in the runs than what are in the first few days because they’re not as you said. It is that the formerly very warm anomalies for 12/4-9 have cooled off to less warm, normal, or even slightly colder than normal in some cases.
Also, the 500 mb pattern has changed markedly (for 12/4-9 especially) to more of an E trough/w ridge couplet vs a zonal west to east flow. The market may feel that should those verify that the actual wx will end up colder than even the colder models show.
Regarding the ends of the runs still showing mainly zonal, the market isn’t putting a lot on that imo because they’re far less credible than earlier days in the forecast, especially considering how much colder earlier days (12/4-9) have gone this week. The market may feel that the end days will continue the trend of cooling off in later runs. Regarding the weeks 3-4 forecast, that has next to no credibility as you know and thus is likely being largely ignored.
Another thing about the funky NG is timing of reacting to wx changes. Sometimes it is right after a model comes out and sometimes it is long delayed to say other new data comes out to support it. Sometimes one can go long or short too early.
Timing is very tricky as a trader could have the right idea but be off on timing, which can get frustrating. If you get in too early and then get stopped out, you can miss a nice gain. That’s where options can come into play as they let you stomach the downturns and hold on.
Thanks Larry!
I'm confused on your position about the week 3-4 forecast period from contradicting statements this past week.
This was the last one about the period of Dec. 11-24 which is the weeks 3-4 forecast after the NWS came out warm(which I agree with).
https://www.marketforum.com/forum/topic/77992/#78378
"Regarding the weeks 3-4 forecast, that has next to no credibility as you know and thus is likely being largely ignored."
These were the previous ones about the same period.
https://www.marketforum.com/forum/topic/77992/#78221
By WxFollower - Nov. 22, 2021, 10 p.m.
" Mike et al,
Watch the MJO. It is forecasted by the Euro and other models to be in a position that could bring a resurgence of cold into the E half of the US in mid to late December, especially if the NAO, AO, and PNA were to shift by 12/10."
https://www.marketforum.com/forum/topic/77992/#78347
"By WxFollower - Nov. 26, 2021, 12:10 a.m.
Meanwhile, the current MJO forecasts still maintain the forecasted MJO track going in a path that would increase the chance for cold to dominate much of mid to late December in the E half of the US."
metmike: Am I detecting a bias here for disregarding guidance that contradicts your expectations........saying, today that this period has next to no credibility when it shows warm temps based on the NWS that used solid reasoning for that lower skill period after you advised us twice, earlier this week to be on the look out for a change that might increase the chance for cold..........for that exact same period?
I agree that the week 3-4 period has much lower skill than week 2 but whether its based on the MJO on some models(which says it MIGHT turn colder if several other things cooperate) which seems to have MUCH lower skill than the half a dozen other models/indicators that tell us it will be mild ..........it seems that you are giving much greater weighting to the one outlier indicator that suggests potential cold rather than weighting the indicators fairly based on previous skill scores/historical performance.
Please elaborate?
Why would the more uncertain effect of the potential MJO phase be more skillful than all the other ones below?
This was the forecast philosophy from the NWS in making their forecast today......and they do acknowledge the MJO forecast on some models that you pointed out earlier in the week:
"The Madden-Julian Oscillation (MJO) is forecasted by some models to emerge in phase 6 by the beginning of the Week 3-4 forecast period, however the uncertainty regarding that signal is large. The current Week 3-4 outlook is based on other large scale signals such as the present La Nina conditions and the projected positive phase of the NAO, as well as blends from the dynamical model guidance including the GEFS, CFS, Canadian, ECMWF, JMA, the SubX multi-model ensemble (MME), and statistical guidance."
I respect your opinion tremendously and you have showed me many things here that I was overlooking and am wondering if maybe I'm completely missing something here.
Thanks
One reason that I'm in the mild camp is because of the 500 mb anomaly map at the end of 2 weeks that I showed earlier. Many of the key anomalies and teleconnections are almost the complete opposite of what would bring cold into the US and all the models agree on it....extremely mild with very high confidence relative to that decreasing skill period. Where will the cold come from?
It's one thing to think that they might be too warm but another to expect them to completely flip to the exact opposite pattern.
I think a big part of these forecasts coming in colder with model updates this past week is the -NAO regime.
We are flipping to +NAO, so that bias will stop and models may start coming in milder as they pick up on the more dominant, very mild, west to east Pacific jet stream deflecting the -NAO northern stream (that has been ruling the Midwest/East in recent forecasts)out of the picture.
Mike said: “metmike: Am I detecting a bias here for disregarding guidance that contradicts your expectations........saying, today that this period has next to no credibility when it shows warm temps based on the NWS that used solid reasoning for that lower skill period after you advised us twice, earlier this week to be on the look out for a change that might increase the chance for cold..........for that exact same period?”
Valid point! I’m saying week 3-4 is too far out for NG to pay much attention to it due to low credibility of models/forecasts and that it cares way more about the much more reliable week 2. My comments are to watch the MJO because it is being progged to be in a location that has had tendency for E US cold, especially if some of all of PNA, NAO, and AO we’re to change. I’m not saying that NG should rise because of that. I’m saying that just as something to keep in the back of your mind.
Thanks Larry!
Models, as expected are picking up on the new, much milder pattern change as we shift from the recent, cold -NAO/AO regime to a more +NAO regime.
Question is probably not whether ng will open lower on Sunday Night but ...........how much lower?
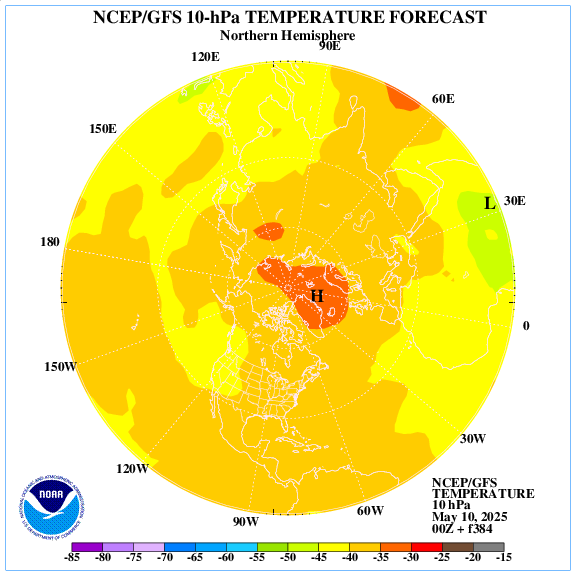
No signs of a Sudden Stratospheric Warming event ahead......just the opposite. The stratospheric polar vortex at 10hPa looks locked in at 16 days...........in the high Arctic, northeast of Greenland.
https://www.cpc.ncep.noaa.gov/products/stratosphere/strat_a_f/
https://www.cpc.ncep.noaa.gov/products/stratosphere/strat_a_f/gif_files/gfs_t10_nh_f384.png
https://en.wikipedia.org/wiki/Sudden_stratospheric_warming
A sudden stratospheric warming (SSW) is an event in which the polar stratospheric temperature rises by several tens of kelvins (up to increases of about 50 °C (90 °F)) over the course of a few days.[1] The warming is preceded by a slowing then reversal of the westerly winds in the stratospheric polar vortex. SSWs occur about 6 times per decade in the northern hemisphere,[2] and only about once every 20-30 years in the southern hemisphere[3] (and two SSWs have been observed so far
Dropped like a lead balloon
Indeed and no surprise with the much milder GEFS/EPS runs of today vs Friday.
Down 4,000/contract.
As big of a drop lower on the open, it was not close to a gap lower because the previous session had a massive rally from the December contract expiring to meet unusually high cash prices(mainly from record exports to Europe and their record low supplies/record high prices).
Shorting on Friday near the end of the session was a big gift!
Funds are heavily short too and that dynamic could have resulted in some extra short covering(not sure about that one).
If the models stay mild, its likely we can still go lower but often, when we see these enormous gaps lower in ng, its from panic selling or buying at the market on the open from people that want the heck out no matter what and not enough orders from the other side at that moment to fill them...............so the market has to go waaaay lower to fill all those orders flooding the market all at once at that moment.
I would be a bit surprised if we came back more than halfway and shocked if we get back to $5.5 this week unless the models suddenly turn sharply colder.......which looks pretty unlikely.
However, much colder weather at some point in December with a sustained pattern change, like Larry advised us to be on the look out for, could easily take us higher than that with this market.
Natural gas futures were off sharply in early trading Monday, erasing gains recorded alongside front-month expiration late last week as analysts pointed to warming forecasts and weaker fundamentals. The January Nymex contract was down 51.5 cents to $4.962/MMBtu at around 8:40 a.m. ET. The December contract rolled off the board on Friday with a 37.9-cent…
metmike: No changes. In fact, the +NAO and +AO are even more positive today (-PNA) at the end of 2 weeks, which makes strong, sustained cold extremely unlikely.
metmike: No changes
metmike: Still no changes. ........... in fact, even milder overnight.
12z models were COLDER.
GFS was a whopping +18 HDD's vs the previous 2 runs which gave us the 2,000/contract spike higher!
Euro was only +2 HDD's and caused the price to drop 1,000 but is still not as mild and we held half the gains from the GFS.
Larry,
Still looks like the MJO could make it to phase 7 later in December based on the update this week which would increases chances for a pattern change to cold(if the NAO shifts negative). That would be later in December.
https://www.daculaweather.com/4_mjo_phase_forecast.php
metmike: Big bounce higher after the 12z GFS came out +18 HDD's. Still closed towards the bottom of the range.
metmike: European model was an incredible -18 HDD's from the previous solution and we immediately crashed as it was coming out.