Looks like crude has put in a top. Not really sure as to why. It may hang in this area for a short while before dropping.
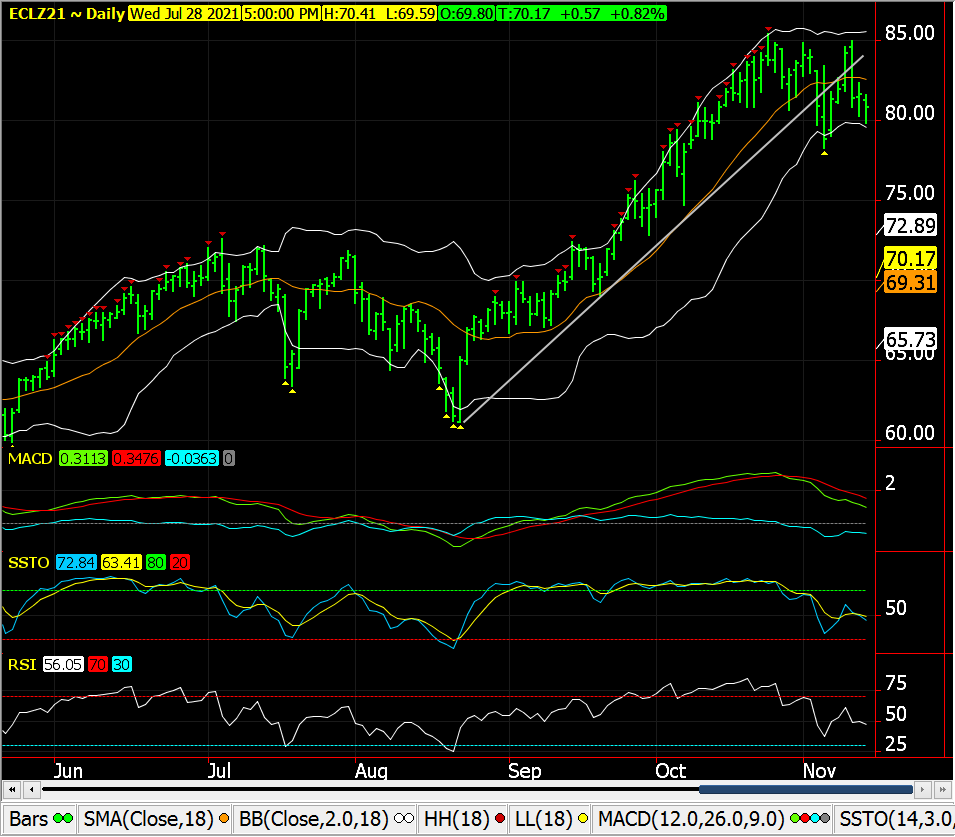
Thanks much Mark!
Could be a top orrrrrr a bull flag.
The war on fossil fuels is intentionally forcing prices higher and taking away subsidies to make them less competitive with the fake green energy..........solar and wind.
Much of the new investment and even old investment money is looking at non fossil fuels.
This is unprecedented and makes predicting the future prices especially challenging.
Seasonally, prices are usually very weak for all the energy markets in November.
https://www.marketforum.com/forum/topic/76969/
$555 billion to fight the fake climate crisis
Started by metmike - Nov. 2, 2021, 12:19 p.m.
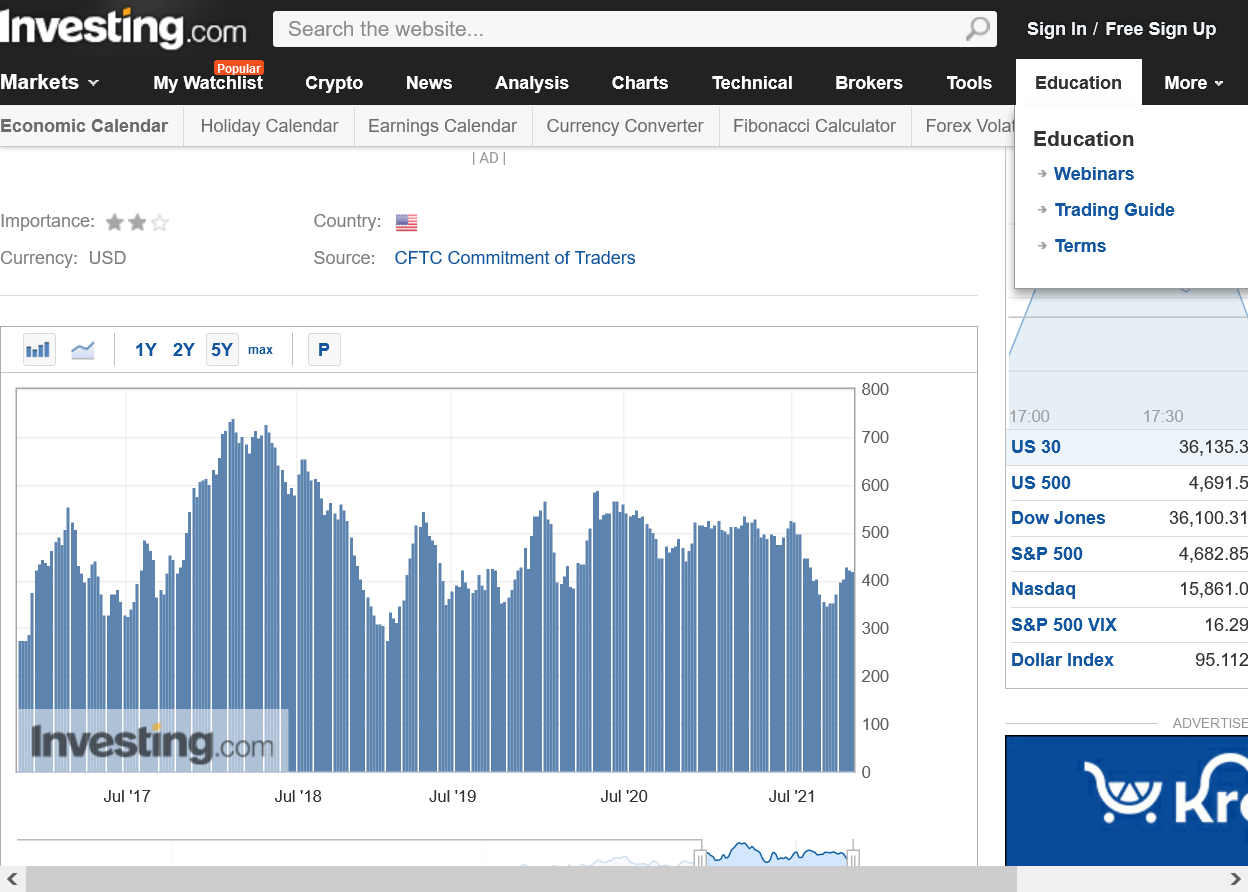
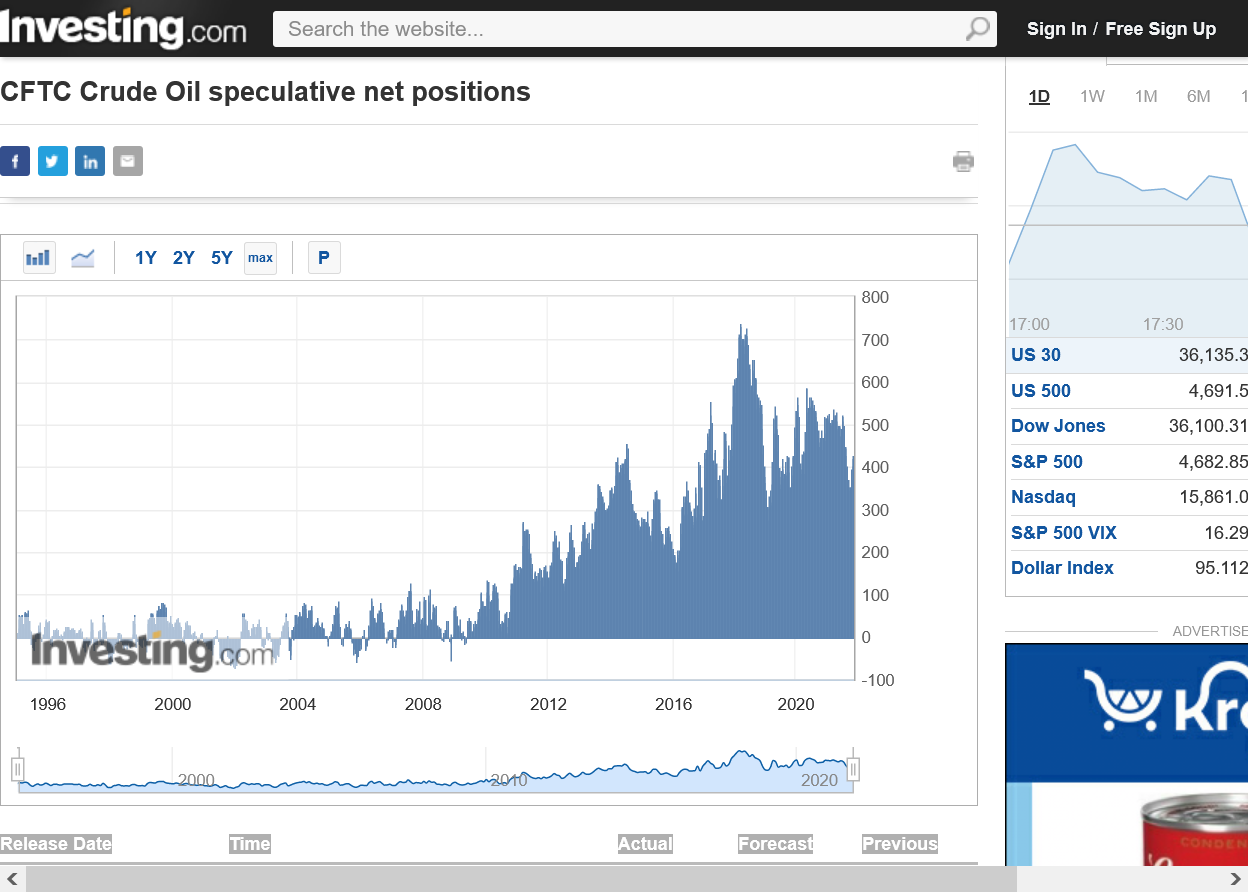
Funds are always mega long crude apparently in recent years.
https://www.investing.com/economic-calendar/cftc-crude-oil-speculative-positions-1653
| Release Date | Time | Actual | Forecast | Previous | |
|---|---|---|---|---|---|
| Nov 12, 2021 | 14:30 | 419.3K | |||
| Nov 05, 2021 | 14:30 | 419.3K | 423.7K | ||
| Oct 29, 2021 | 14:30 | 423.7K | 429.6K | ||
| Oct 22, 2021 | 14:30 | 429.6K | 404.8K | ||
| Oct 15, 2021 | 14:30 | 404.8K | 398.3K | ||
| Oct 08, 2021 | 14:30 | 398.3K | 373.8K | ||
| Oct 01, 2021 | 14:30 | 373.8K | 356.0K | ||
| Sep 24, 2021 | 14:30 | 356.0K | 355.1K | ||
| Sep 17, 2021 | 14:30 | 355.1K | 349.2K | ||
| Sep 10, 2021 | 14:30 | 349.2K | 356.5K | ||
| Sep 03, 2021 | 14:30 | 356.5K | 374.3K | ||
| Aug 27, 2021 | 14:30 | 374.3K |
Here are the latest gas prices across the country:
https://www.gasbuddy.com/GasPriceMap?z=4&lng=-96.591588&lat=38.10118167223963

https://www.quora.com/Why-are-west-coast-gasoline-prices-higher
The two main reasons are transportation and taxes. Part of the cost of gasoline is what it costs to take refined product and transport it to the end user. Below is a map of the main refineries and pipeline in North America.
You can see that the west coast has a much smaller amount of infrastructure than other parts of the map. As a result, more of your gasoline is refined in places that require it to be shipped by transportation.
The second reason is that the states on the West Coast have used fuel taxes more than the average.
If you add to that state requirements about how the gasoline is blended based on the various state environmental air quality and emissions standards, you can tweak the price again. The addition of MTBE or ethanol seasonally, further adds cost to a gallon.
Both coasts tax their gasoline beyond the norm. Add to that in California they require 2 to 3 times as many fuel mixes as any other state which increases the cost again.
U.S. Crude Oil Inventories
https://www.investing.com/economic-calendar/eia-crude-oil-inventories-75
Latest Release Nov 10, 2021 Actual 1.001M Forecast2.125M Previous 3.291M
| Release Date | Time | Actual | Forecast | Previous | |
|---|---|---|---|---|---|
| Nov 17, 2021 | 10:30 | 1.001M | |||
| Nov 10, 2021 | 10:30 | 1.001M | 2.125M | 3.291M | |
| Nov 03, 2021 | 09:30 | 3.291M | 2.225M | 4.267M | |
| Oct 27, 2021 | 09:30 | 4.267M | 1.914M | -0.431M | |
| Oct 20, 2021 | 09:30 | -0.431M | 1.857M | 6.088M | |
| Oct 14, 2021 | 10:00 | 6.088M | 0.702M | 2.346M | |
| Oct 06, 2021 | 09:30 | 2.346M | -0.418M | 4.578M | |
| Sep 29, 2021 | 09:30 | 4.578M | -1.652M | -3.481M | |
| Sep 22, 2021 | 09:30 | -3.481M | -2.440M | -6.422M | |
| Sep 15, 2021 | 09:30 | -6.422M | -3.544M | -1.529M | |
| Sep 09, 2021 | 10:00 | -1.529M | -4.612M | -7.169M | |
| Sep 01, 2021 | 09:30 | -7.169M | -3.088M | -2.979M |
+++++++++++++++++++++++++++++++++++++++++++++++++++
Weekly US ending stocks of crude oil.
https://www.eia.gov/dnav/pet/hist/LeafHandler.ashx?n=PET&s=WCRSTUS1&f=W
Weekly ending stocks for unleaded gasoline.
https://www.eia.gov/dnav/pet/hist/LeafHandler.ashx?n=PET&s=WGTSTUS1&f=W
Weekly US ending stocks for distillate fuel oil(heating oil-especially used in the Northeast).
https://www.eia.gov/dnav/pet/hist/LeafHandler.ashx?n=PET&s=WDISTUS1&f=W