A new risk assessment found that around 25 percent of all critical infrastructure in the U.S. is at risk of becoming inoperable due to flooding.
For its report titled "The 3rd National Risk Assessment: Infrastructure on the Brink," nonprofit research group First Street Foundation looked at residential properties, roads, commercial properties, critical infrastructure and social infrastructure.
According to the report, 25 percent — or 35,776 critical infrastructure facilities — are at risk of being affected by worsening flood events. By the year 2051, the number of critical infrastructure facilities at risk is estimated to rise to 37,786.
The same report found that 14 percent of residential properties, 25 percent of roads and 20 percent of commercial properties are similarly at risk.
"In the United States, many infrastructure discussions over the past 20 years have been centered around possible physical attacks, energy crises, and terrorism, but climate change has a higher probability of significant impact on the Nation’s infrastructure," the foundation wrote.
"With an increasing number of flooding events making U.S. headlines, there is a greater awareness of the economic and human cost that flood-damaged infrastructure can produce," it added.
Jeremy Porter of First Street Foundation told The Associated Press, "Our work aims to determine the amount of flooding that would render infrastructure either inoperable or inaccessible."
"By applying research on depth thresholds and comparing them to flood data and probability metrics, we can determine roughly the extent of flooding that would cause a road to be impassable to cars, or a hospital to be shut down," he added.
The report on the risks facing U.S. infrastructure comes out as Congress is stalled in passing a bipartisan infrastructure bill that includes $550 billion in funding for new investments into roads, bridges, broadband, water and rail.
The bill also calls for $40 billion for the repair, replacement and rehabilitation of bridges. These investments would also address climate change and resilience.
The Senate passed the bill in September and it has since been held up in the House as moderate and progressive Democrats spar over a separate reconciliation package that would spend big on climate change and drastically expand the country's social safety net.
Speaker Nancy Pelosi (D-Calif.) has set an Oct. 31 deadline to vote on the infrastructure bill, while Senate Majority Leader Charles Schumer (D-N.Y.) has said he hopes to have both bills to President Biden by that date.
I'm in no position to assess if this is statistically accurate but know with certainty that it's a very legit problem.
With regards to spending to adapt to climate change, I am actually for funding for adaptation and updating infrastructure for high end/flooding events.
In many places it was built to accomodate heavy rain events from 100 years ago.
The 1 degree C warmer atmosphere, though it's beneficial to most life, )as well as the CO2 is beneficial)......can hold 7% more moisture.
This means that even if its a climate optimum, with the benefits of the slight warming outweighing the negatives for at least the next few decades.......we MUST do something to address the heavier rains that are being caused by that slight warming.
Almost all of life prefers these slightly warmer temperatures but humans built big cities which are on top of miles of concrete and the extra water with heavier rains has to go somewhere.
If the drainage systems were designed to barely handle the old climate's heaviest rains, then you add 10% more water falling from the sky on top many thousands of new homes and more concrete meaning even much more runoff that will go into the same system.............it's the recipe for increasing flood damage.
https://journals.ametsoc.org/view/journals/clim/32/17/jcli-d-19-0096.1.xml

++++++++++++++++++++++++++++++++++++++++++++++++++++

America's Corn Fields Are Making the Weather Really Weird
https://www.wired.com/story/corn-fields-are-making-it-rain-more/?mbid=social_twitter_onsiteshare
Americans Have Planted So Much Corn That It’s Changing the Weather
https://www.atlasobscura.com/articles/corn-belt-weather
Climate change should help Midwest corn production
https://weatherfarm.com/2018/05/climate-change-should-help-midwest-corn-production/
https://www.sciencemag.org/news/2018/02/america-s-corn-belt-making-its-own-weather
https://addins.wrex.com/blogs/weather/2011/07/why-is-the-humidity-so-high-the-answer-is-pretty-corny
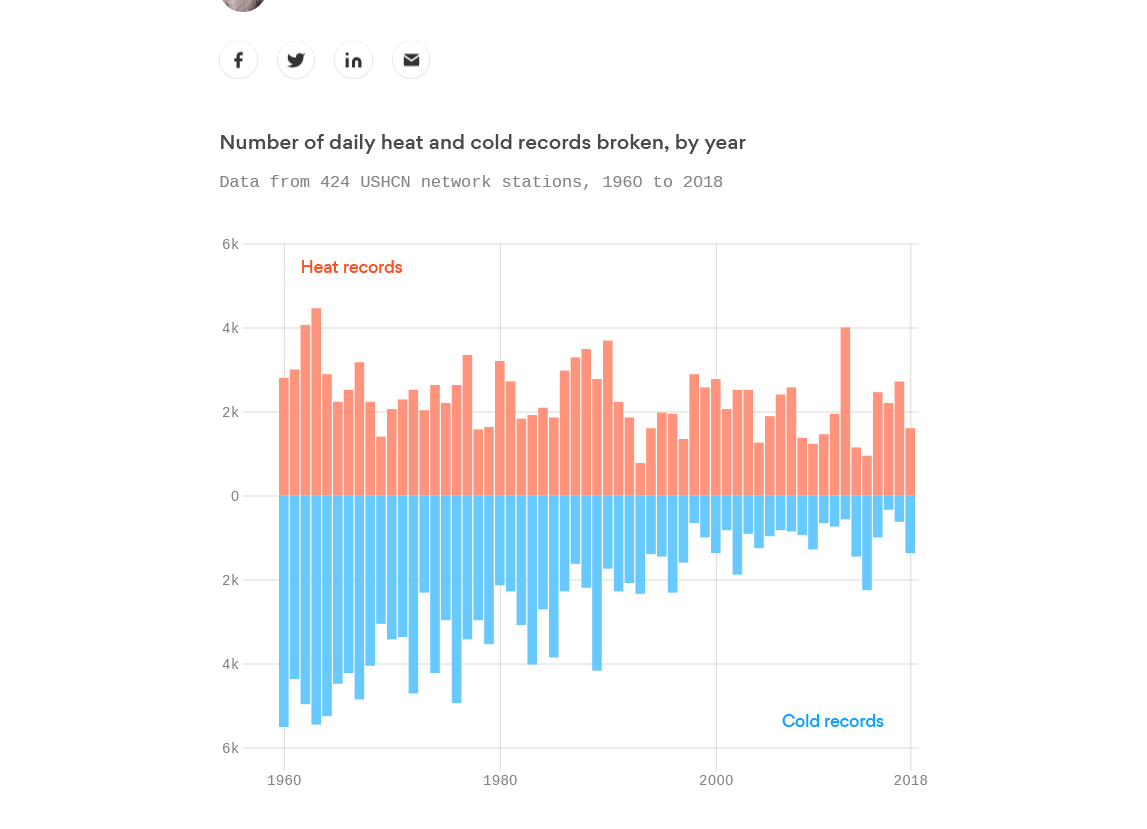
Let's look at 424 cities(most of them) in the US, to see what the pattern has been. It actually shows us something that is very surprising. I was not even expecting the extent of it. There has NOT been an increase in record highs going back to 1960. In fact, there has been a DECREASE in daily record maximums over the past 60 years.
Outside of the major Midwest drought year 2012, when we had the 3rd highest bar on the graph, the top 2 record high setting years were 1962/63 and 9 of the top 10 years with the most record setting highs were from 1990 or earlier. Only 1(2012) since then.
This is the complete opposite of what everybody thinks.
Like you mentioned, it's the nighttime lows that are being affected the most with a well defined drop in the number of record cold daily lows.
The 1960s(coldest decade) featured around 4 times (4,000) as many record lows as the last decade(1,000) has recorded.
The graph below is updated thru 2018 because the study was done in 2019.