My neighbor is a civil engineer, has a state of the art weater station. His rain guage measured eight inches during thrre wave of heavy downpours. The second wave was five inches in thrity minutes.
Yessir MTP you got some rain.
My niece and a friend in Phoenixville got hammered as did Brandywine museum area when the river spewed!!
My sister near Kennett had recently redone their driveway culvert which constantly failed in the past cause the stream it manages rages during storms like this. It now is a one piece concrete thing and held quite well-the wing walls are taking a beating.
I saw some pics of Rt 1 by the museum ugh!
You must have been pumping some basements, eh?!
John
Scroll down for a detailed analysis!
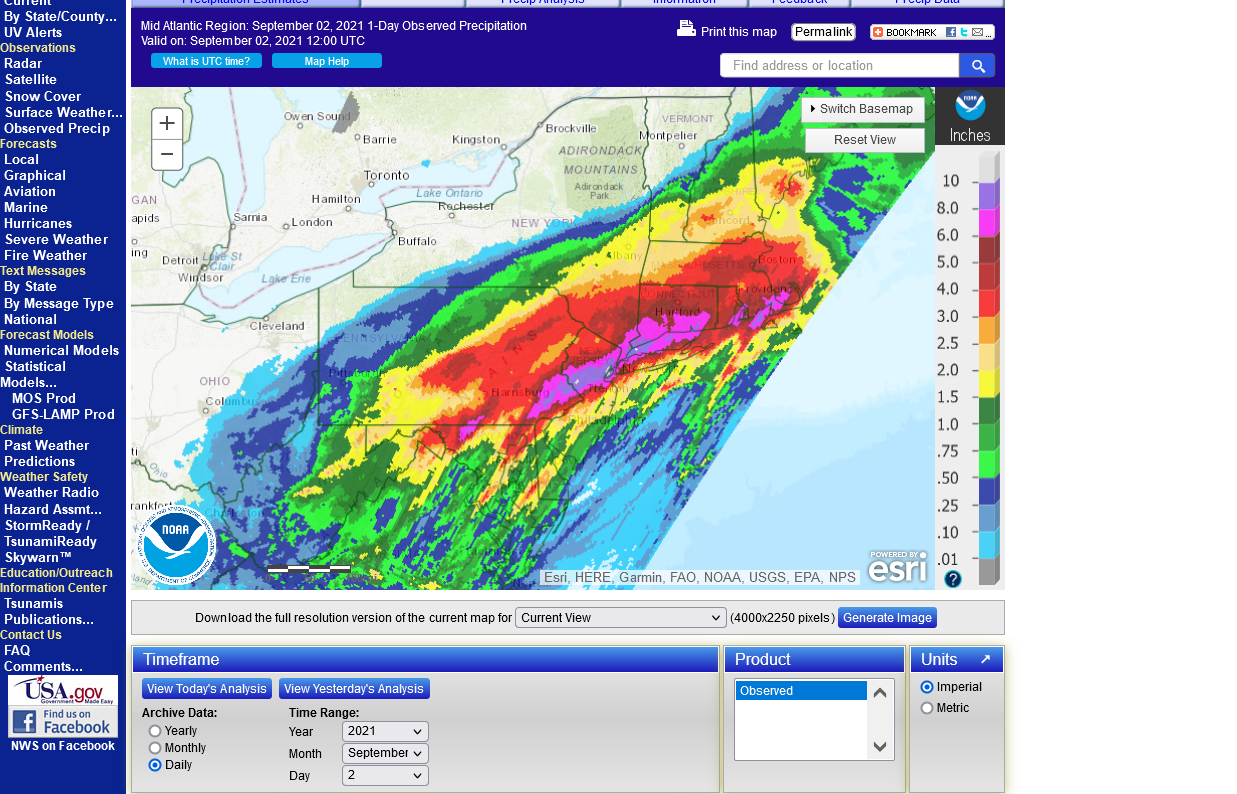
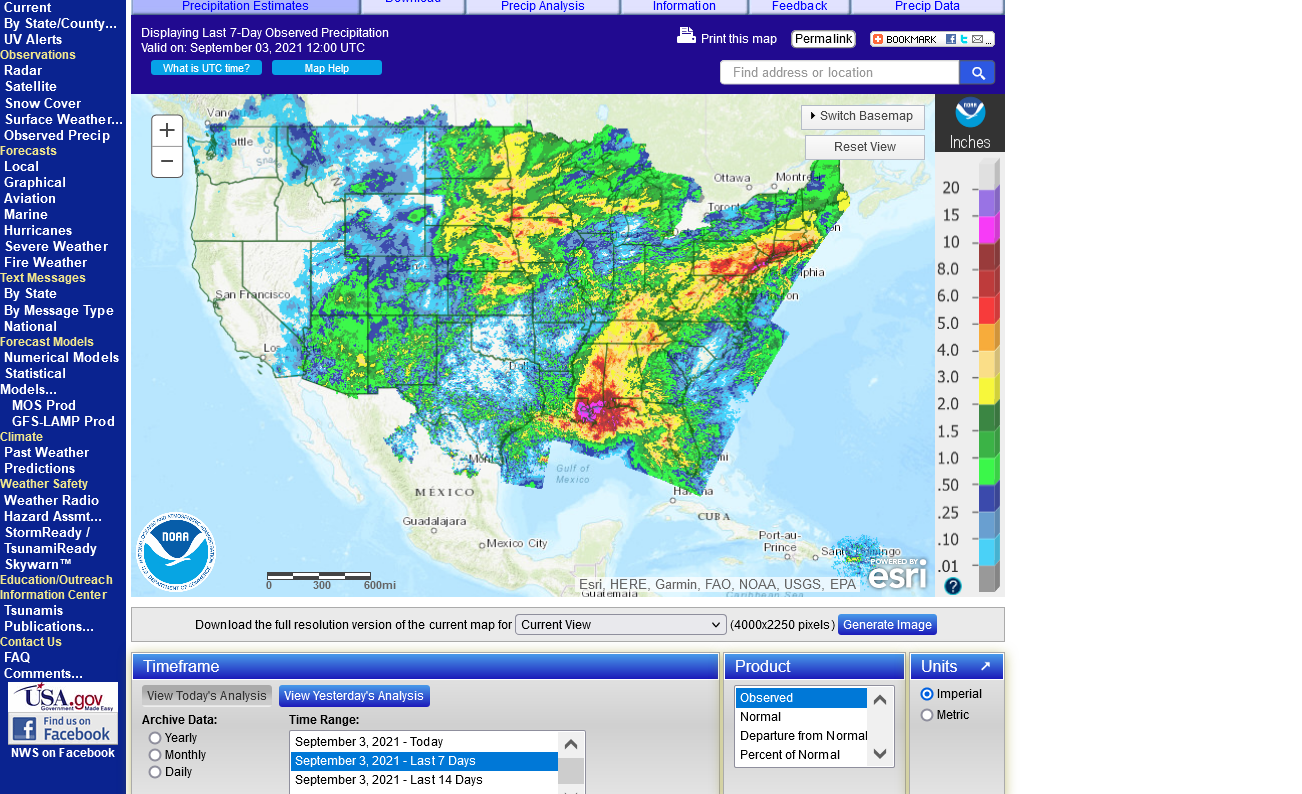
This was the 24 hour rain for that event.
Note the band of very heavy rains that tracked right along the I-95 corridor, almost exactly where the most people live. .......from Philly to NYC to Boston. That area saw 6+ inches of rain with 3 isolated spots of 10 inches. Much of this fell in a matter of several hours.
Producers that live in the cornbelt, probably remember a map similar to this with extreme rains at least several times in the last decade. Whether they remember it or not...........it's happened.
How much was caused by global warming? What are US and world records? See comprehensive discussion below.
We hear that this is a once a century type event but that's very misleading.
Once a century............for any 1 location.............even while events like this are expected several times a year in the world but scattered around.
The odds of NYC, for instance to see this much rain so fast might be very tiny but the odds for the United States are actually pretty high every year and for the world...........it's actually very likely/expected that several to numerous places will see rains like this every year.
It just so happened that this extreme rain event occurred where the most people live and it maximized the impact and the coverage.
That said, there WAS a connection to how extreme this and other heavy rain events are becoming with global warming.
At +1 deg. C vs 100 years ago, the atmosphere/air can hold 7% more moisture. Not 700% or 70% more.......7% more. As as result of this, all things being equal(which they never are), rain events like this, should be able to yield 7% more rain.
So the highest totals up near 10 inches, would have been more like 9.3 inches. 5 inches would have been more like 4.7 inches.
The actual weather pattern and hurricane remnants were not from climate change but individual systems, when you superimpose 1 deg. C of warming, can hold 7% more water vapor/precipitable water. So for every inch of rain that would have fallen, you can add .07 inches(all other things held constant).
We can actually use an equation in meteorology that applies to the correlation between temperature and saturated water vapor in the air.
https://en.wikipedia.org/wiki/Clausius%E2%80%93Clapeyron_relation
"Clapeyron equation" and "Clapeyron's equation" redirect here. For a state equation, see ideal gas law.
The Clausius–Clapeyron relation, named after Rudolf Clausius[1] and Benoît Paul Émile Clapeyron,[2] is a way of characterizing a discontinuous phase transition between two phases of matter of a single constituent. The relevance to climatology is that the water-holding capacity of the atmosphere increases by about 7% for every 1 °C (1.8 °F) rise in temperature.
Scroll down for more:
metmike: This particular study found the actual rainfall rates for just it's limited area and time frame to be almost double what would be expected using the Clausius-Clapeyron equation in physics/meteorology. That was for events at more than 10 deg. C or 50 deg. F.
Below that temperature and the rates followed the CC equation.
Events of extreme precipitation have a huge influence on society. They are associated with flooding, erosion, water damage, and may have impacts on transport and safety.
"For temperatures above 10 oC a transition is seen to a stronger temperature dependency close to 14 % per degree: a super CC scaling. For the most extreme events this super CC scaling occurs at slightly lower temperatures than for the less extreme events."
metmike: The point of the graphs below is to show how rain intensity(vertical/left side of graph) increases with temperature(horizontal/bottom of graph. )
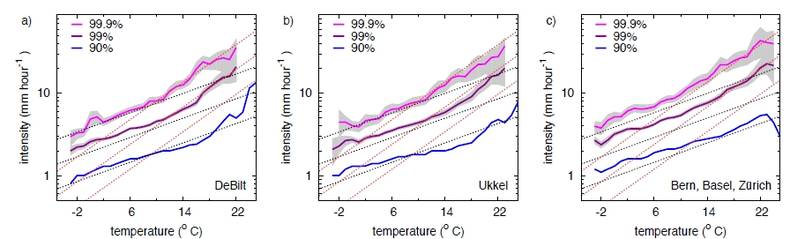
Figure 2. Scaling of observed hourly precipitation extremes with temperature for three different data sources (De Bilt: source KNMI; Ukkel: source RMI; Bern, Basel and Zürich: source MeteoSwiss). Shown are different percentiles of the distribution.
How does this event stack up to US rainfall records?
Not even close to any of them! The original link is not working but I saved the data below.
US Rainfall Records
The map/link below shows rainfall records for the US for total rains, going from a time frame of 1 minute up to a time frame of 1 year. If you go to the link, you will see this better. It shows the date of occurrence for each of these 20 events. The surprise is that all of them occurred BEFORE 1983 and before man made global warming and climate change would have been a factor. I can't completely explain this as I had recently done a study on our local region going back 120 years that did show heavier rain events over the last 30 years with an especially big increase in the last 15 years..
I'm certain that we have in fact had at slight increase in the # of extreme rain events, however, this shows that regardless of humans the really extreme events have always happened and will continue to happen.
http://www.nws.noaa.gov/oh/hdsc/record_precip/record_precip_us.html
| USA Records-HDSC/OWP www.nws.noaa.gov Disclaimers: Some data are estimates. Not all data have been verified. "*" indicates questionable veracity. Coordinates are approximate. |
Duration Amount (in) Location Start date
1-min 1.23 Unionville, MD 4 Jul 1956
5-min 2.03 Alamogordo Creek, NM 5 Jun 1960
12-min 2.30 Embarrass, WI 28 May 1881
15-min 3.95 Galveston, TX 4 Jun 1871
30-min 7.00 Cambridge, OH 16 Jul 1914 42-min 12.0 Holt, MO 22 Jun 1947
13.8* Burnsville 6 WNW, WV 4 Aug 1943
60-min 12.0 Holt, MO 22 Jun 1947
12.0 305 Kilauea Sugar Plantation, Kauai, HI 24 Jan 1956
90-min 14.6 Burnsville 6 WNW, WV 4 Aug 1943
2-hr 15.0 Woodward Ranch (D'Hanis), TX 31 May 1935
2.17-hr 19.0 Rockport, WV 18 Jul 1889
2.75-hr 22.0 Woodward Ranch (D'Hanis), TX 31 May 1935
3-hr 28.5 Smethport, PA 18 Jul 1942
4.5-hr 30.7 Smethport, PA 18 Jul 1942
12-hr 34.3 Smethport, PA 17 Jul 1942
18-hr 36.4 Thrall, TX 9 Sep 1921
24-hr 43.0 Alvin, TX 29.42 -95.24 25 Jul 1979
3,4,5 4-day 62.0 Kukaiau, Hamakua, HI 27 Feb 1902
8-day 82.0 Kukaiau, Hamakua, HI 28 Feb 1902
1-month 149 Mt. Waialeale, Kauai, HI 1 Mar 1982
12-month 739 Kukui, Maui, HI 1 Dec 1981
Note the years of the records. They all happened a long time ago....4 decades or longer ago.
https://www.ranker.com/list/worst-floods-in-history/eric-vega?page=4
1. August 1931 Yangtze River, China 3,700,000 killed
2. September 1887 Yellow River, China 2,000,000 deaths
3. June 1938 Yellow River, China 800,000 deaths
4. August 1975 Banqiao, China 230,000 dead
5. 1935 Yangtze River 145,000 dead
6. November 1530 St. Felix Flood, Holy Roman Empire/Europe 100,000+ killed
7. August 1971, Hanoi/Red Rivers, North Vietnam 100,000 dead
8. May 1911 Jiangsu-Anhui, China 100,000 dead
9. December 1287 Holy Roman Empire/Europe 50,000+ dead
10. September 1949 Guatemala 40,000 dead
11. June 1954 Yangtze River, China 30,000 dead
12. June 1974 Bangladesh 28,700 dead
13. January 1362 St. Marcellus Flood-Ireland/Britain/N.Germany 25,000+ dead
14. November 1570 All Saints Flood Netherlands 20,000+ killed
15. December 1999 Vargas mudslides Venezuela 20,000 dead
How many of these events took place in the last 40 years?
Answer: 1
Yes, this is part of climate change(7% increase in heaviest rains).
Is it killing the planet?
Actually, the thing that is supposed to be killing the planet, is greening up the planet, from the best weather/climate for life in the last 1,000 years(since the last time that it was this warm).
CO2 is still the building block for life and is still a beneficial gas NOT pollution.
Fake beer crisis/Death by GREENING!
Started by metmike - May 11, 2021, 2:31 p.m.
Previous posts on Ida:
Ida downgraded from extremely dangerous cat 4 after landfall LA
24 responses |
Started by WxFollower - Aug. 25, 2021, 5:14 p.m.
https://www.marketforum.com/forum/topic/74215/
Hurricane Ida
Started by mikempt - Sept. 1, 2021, 10:03 a.m.
OK, since we are getting bombarded with statements by people that claim global warming/climate change caused this to happen in the Northeast, let's correct that false statement, using the principles of authentic meteorology and facts/data/maps of Ida in the real world.
This will be fun!
The atmosphere at 1 deg. C warmer can hold 7% more water vapor/precipitable water. So rains in systems like this are likely to be 7% heavier. We can assume this and add .07" to every inch of rain that fell. So at temperatures a century ago, all things being equal, the 10 inch rains would have been around 9.3 inches. 5 inch rains around 4.7 inches.
This is based on the rock solid meteorological correlation between the temperature of the air and the amount of H2O that it can hold. The warmer the air, the more H2O that it can hold. We have studies and mathematical equations(Clausius Clapeyron equation) that represent the physics of this indisputable law. There are additional factors/dynamics with individual weather patterns that play a big role too but we know what the relationship in general is between temperature and water vapor(saturation).
Some studies suggest that under unique conditions, we can get a super Clausius-Clapeyron scaling which can double the amount of rainfall rate increase because of the positive feedback dynamics in strong thunderstorms....which could lead to a 14% increase in rainfall rates per +1 deg. C increase.
Under those unique conditions, for every 7 inches of rain, you can add another 1" of rain, based on an increase of 1 deg. C.
I discussed this earlier today here:
https://www.marketforum.com/forum/topic/74503/#74537
The problem here, with Ida, this week is that people are describing the events in the Northeast this week incorrectly and correlating them with climate change/global warming that go well beyond a 7% increase in rain or even an upper limit, still theoretical upper limit of 14% increase. .........and they are meteorologically WRONG on their rationale because they are overlooking the actual weather pattern in place.
The actual weather pattern that caused the extreme event was a cold weather pattern. The -NAO in the Northeast/Southeast Canada from a cold upper level trough is what caused the intensification.
But we will clear that up for everybody right now!
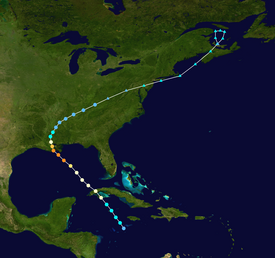
This was the track of Ida.
A hurricane until it was inland, then it quickly died down to a tropical storm, after being cut off from the source for every tropical storm and hurricane's energy.......the warm ocean(at least 80 degrees needed).
When it got to far W.Miss, it was just a depression, with 35 mph winds. Those winds fell further to 30 mph as Ida tracked across MS, AL, TN and Ky but then Ida strengthened back up to 40 mph.
This was the NHC's last update map, when Ida had died down to just a depression(area of low pressure) in western Miss.

You can see all the NHC technical discussions here:
One would think, that being cut off from the warm ocean, that Ida would continue to weaken more and more and produce less and less rain, wind and severe weather.
That happened for 1,000 miles but then..........Ida got stronger again and rainfall amounts more than doubled.............while completely over land.
Here were the severe weather reports from Ida.
Note the SEVERE STORM reports for 9-01, that go back to the previous day.
Numerous high wind reports in AR/LA/MS from Ida, then nothing in AL/TN/KY/WV.
Then numerous high wind and TORNADO reports from Ida in the Northeast.
https://www.spc.noaa.gov/climo/reports/210901_rpts.html

Exact same pattern with the rains.
Huge rains along the Gulf coast from Ida. Then rain amounts plunged for 1,000 miles along Ida's northeast path, then they skyrocketed again in the Northeast, along with the severe storms and tornadoes.
Again, this was Ida's track:
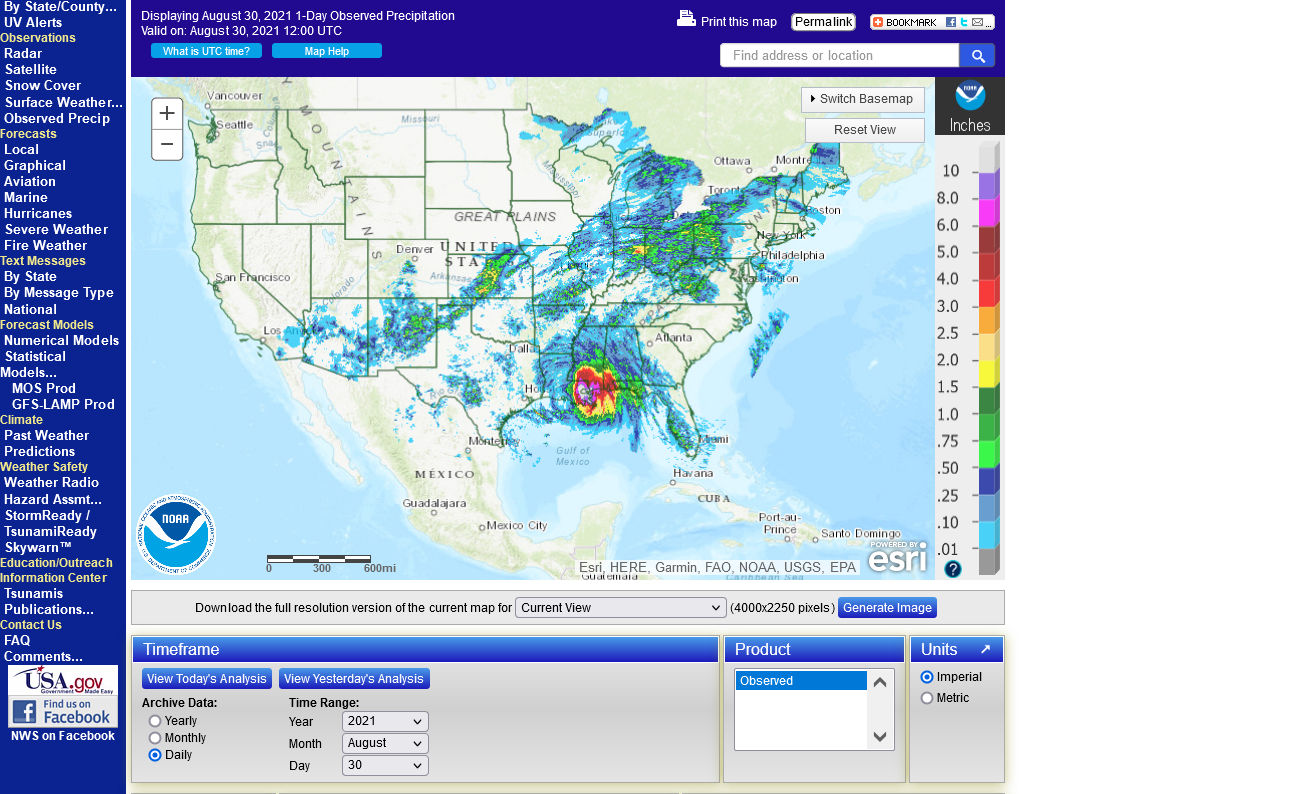
Here's the day by day rains, starting with rains ending 8-30
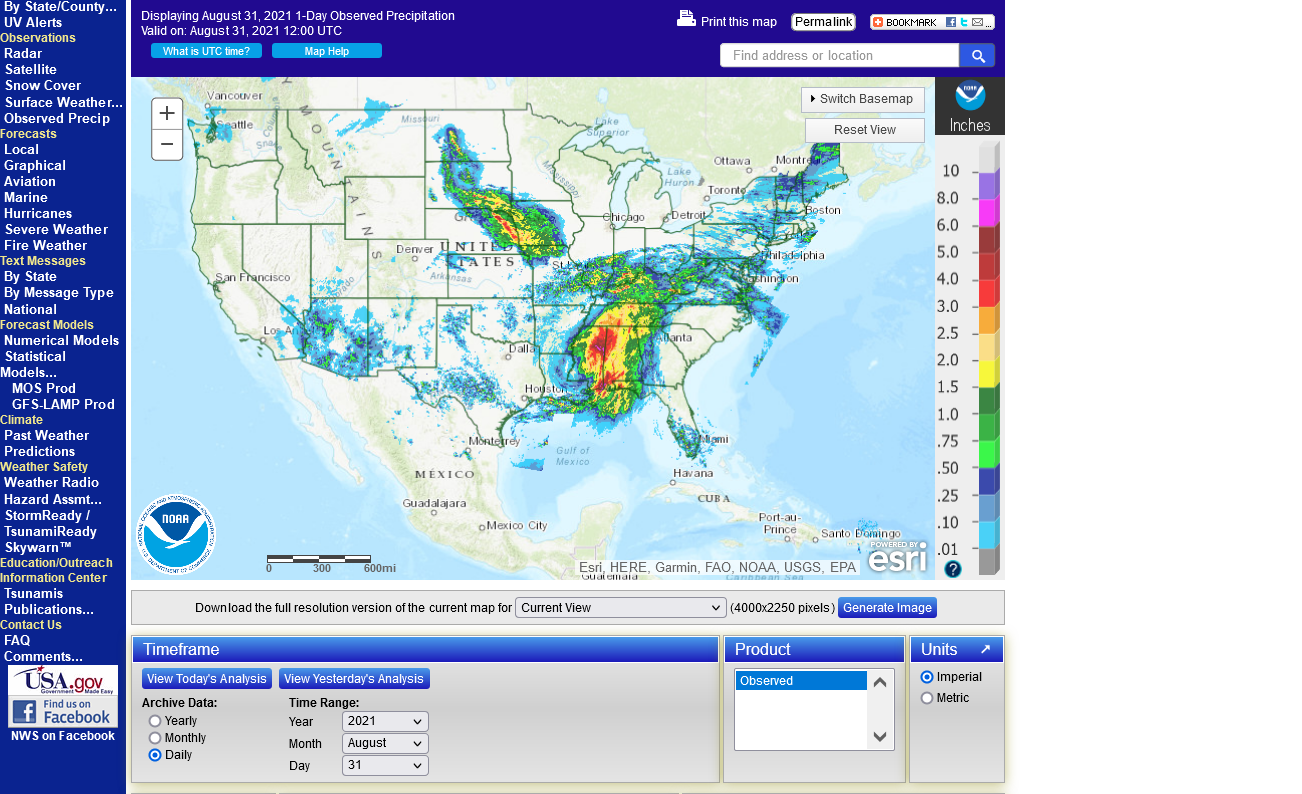
Rains ending 8-31 below
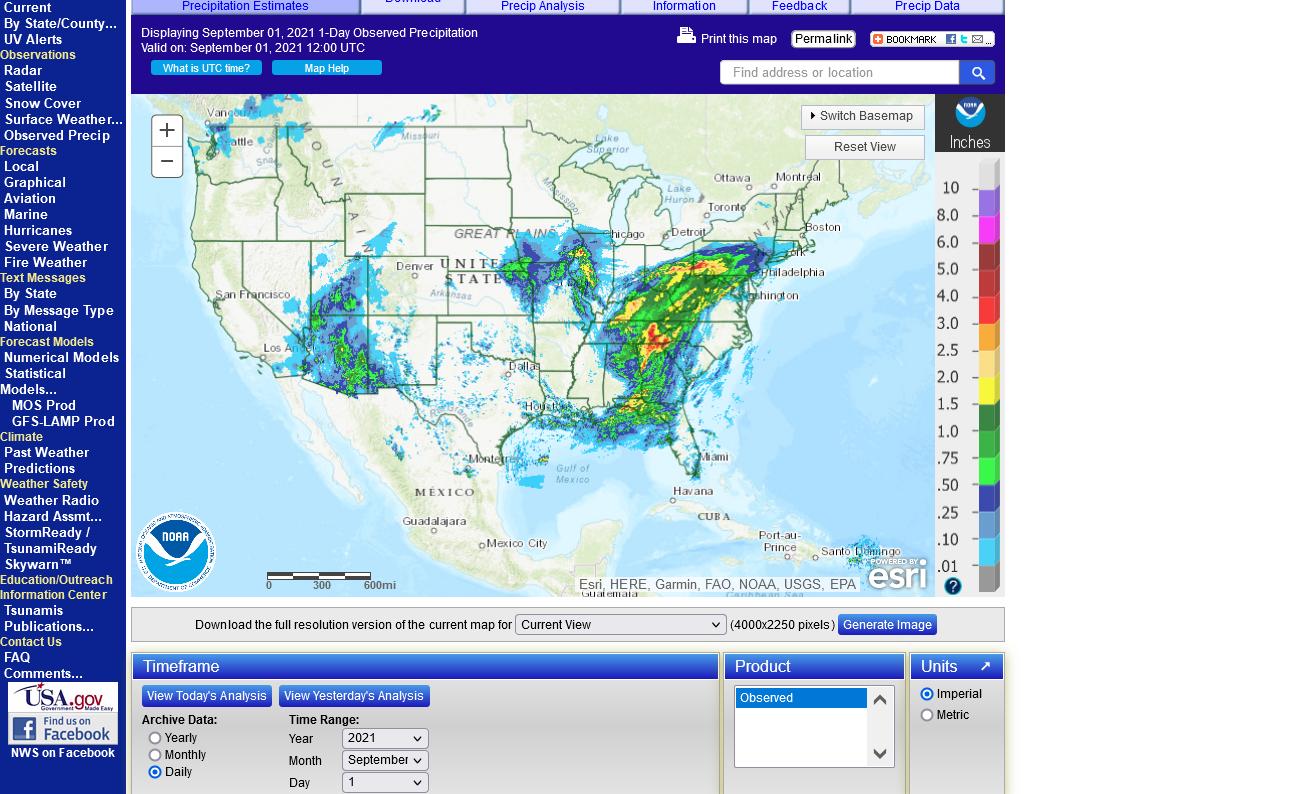
Rains ending 9-1 below
Rains ending 9-2 below.
What would cause this??
NOT global warming(or climate change from global warming) but a cold weather pattern.
Ida was getting picked up by and phasing with a cold upper level trough in Southeast Canada that had cold air aloft which destabilized Ida as it became POST tropical on Wednesday.
This pattern is one that we call an -NAO pattern(with the deep trough in Southeast Canada to the East Coast. It's most common in the Winter and surrounding months.
Here's a description of the -NAO pattern that often affects this area in the Winter:
https://www.almanac.com/return-nao-crossing-guard-atlantic

You will note below, that the NAO was at -1 and the lowest value all Summer earlier this week.
https://www.cpc.ncep.noaa.gov/products/precip/CWlink/pna/nao.sprd2.gif
 | |
