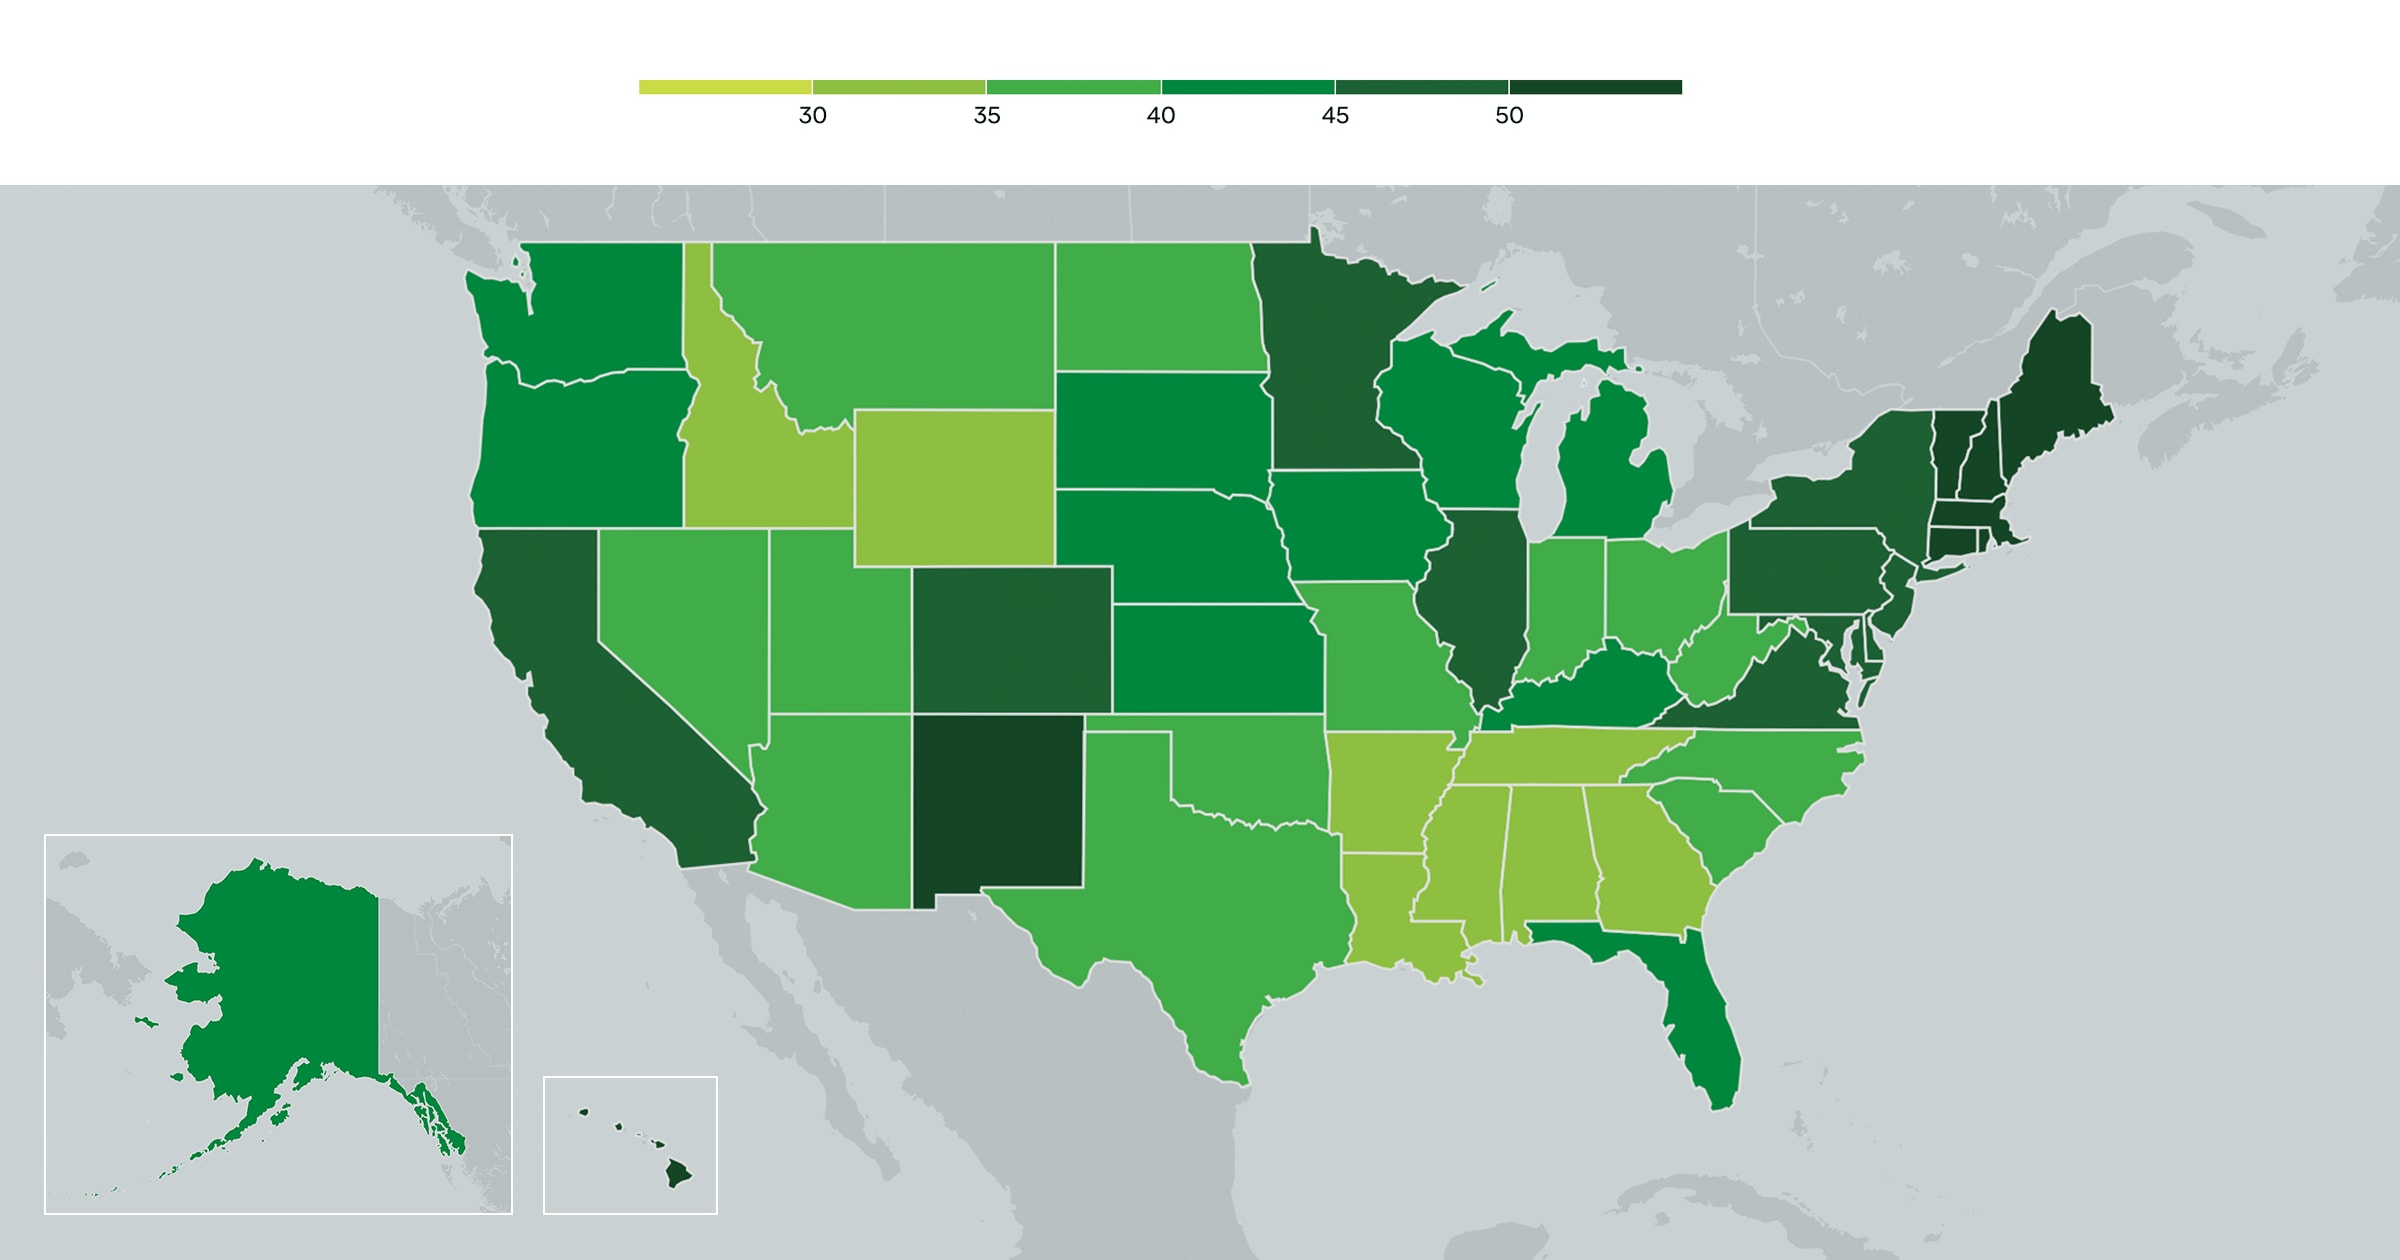
Blue states the most vaccinated. Red states the least vaccinated.
Dark Greens below have the most vaccinated.
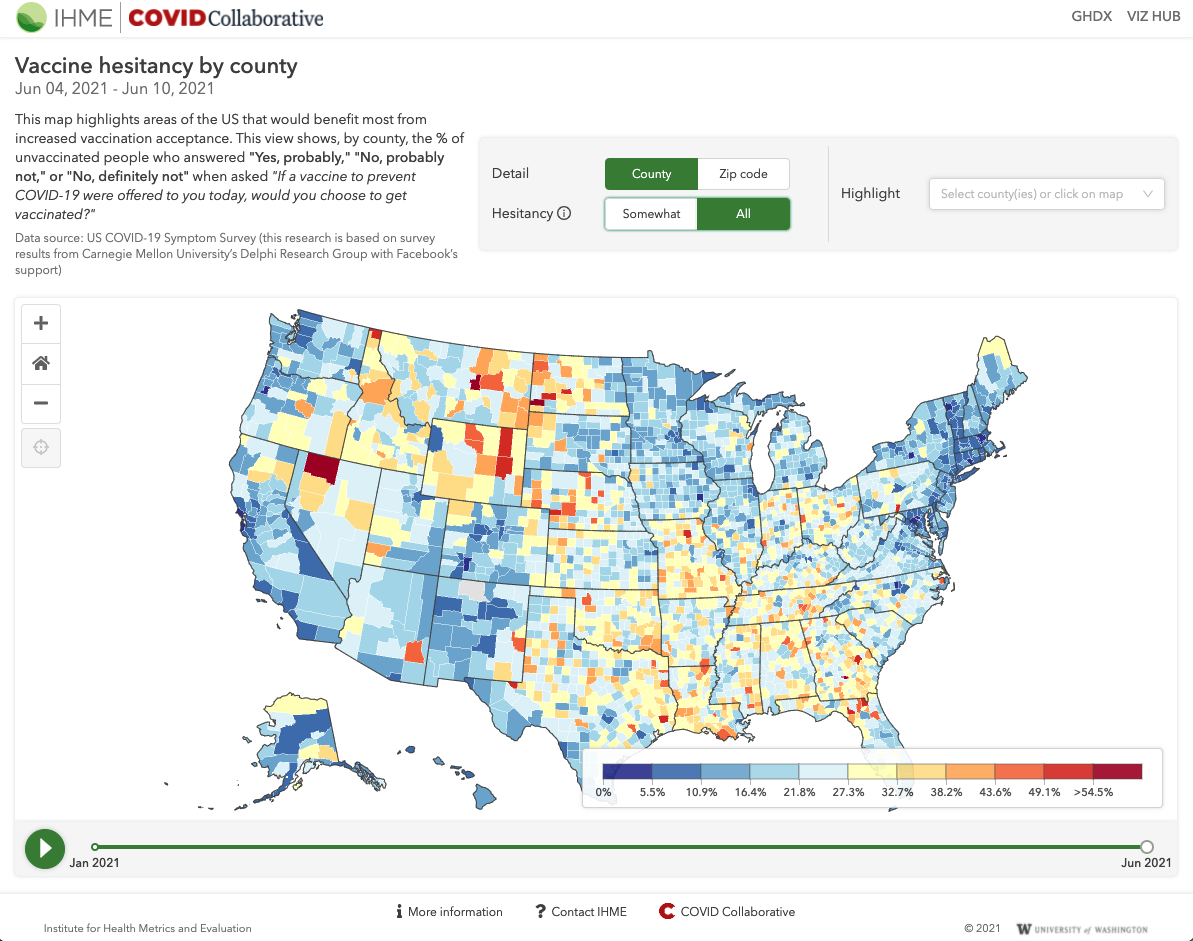
http://www.healthdata.org/acting-data/covid-19-vaccine-hesitancy-us-county-and-zip-code
The political party map below matches the COVID vaccination rate almost exactly.
https://en.wikipedia.org/wiki/Red_states_and_blue_states

It would appear that the surge is moving and there is less correlation to red states. Just maybe there is not the strongly proposed correlation between politics and who is infected? It is still to early to tell in my opinion.
https://coronavirus.1point3acres.com/en
Actually cutworm, there is a massive undeniable correlation. Showing a map of total cases for states is a totally misleading stat.
As you know, the blue states have most of the high population areas. Of course they will have more TOTAL COVID.
Doing this would be like comparing total production from a 50,000 acre farm with production from a 15,000 acre farm.
You must take the YIELD in bushels/acre from both farms to do a fair comparison.
But you must know this.
So we take the COVID cases/100,000 people to make the fair comparison. Interestingly, before the vaccine, during the first surge, the high population centers had MUCH MORE COVID by a wide margin......which makes total sense. Densely populated areas will be most favorable for spread.
During this surge, it's been the complete opposite.
After the vaccines, instead of the densely populated areas having the highest COVID rates, it's been the less densely populated areas with the most COVID....... because those are the areas with the least amount of vaccinated people.........the red states.
It's totally undeniable:
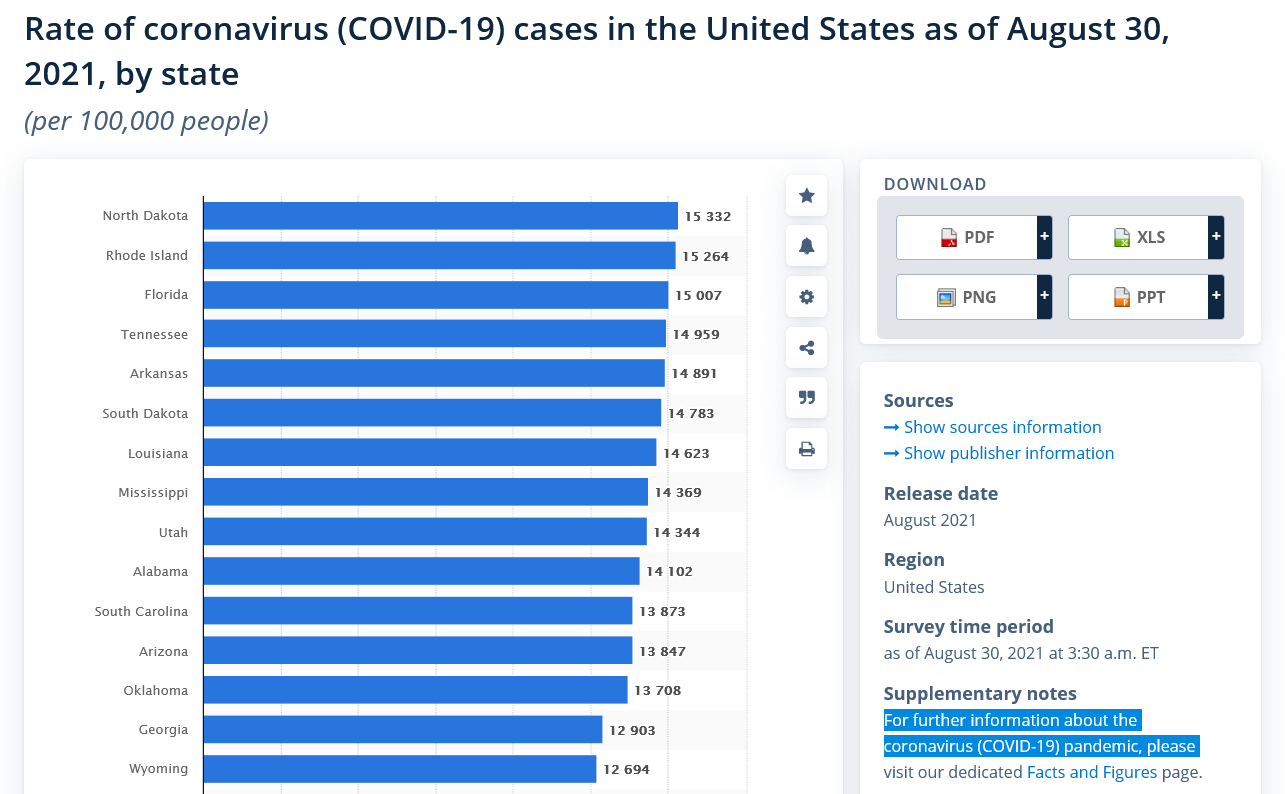
https://www.statista.com/statistics/1109004/coronavirus-covid19-cases-rate-us-americans-by-state/
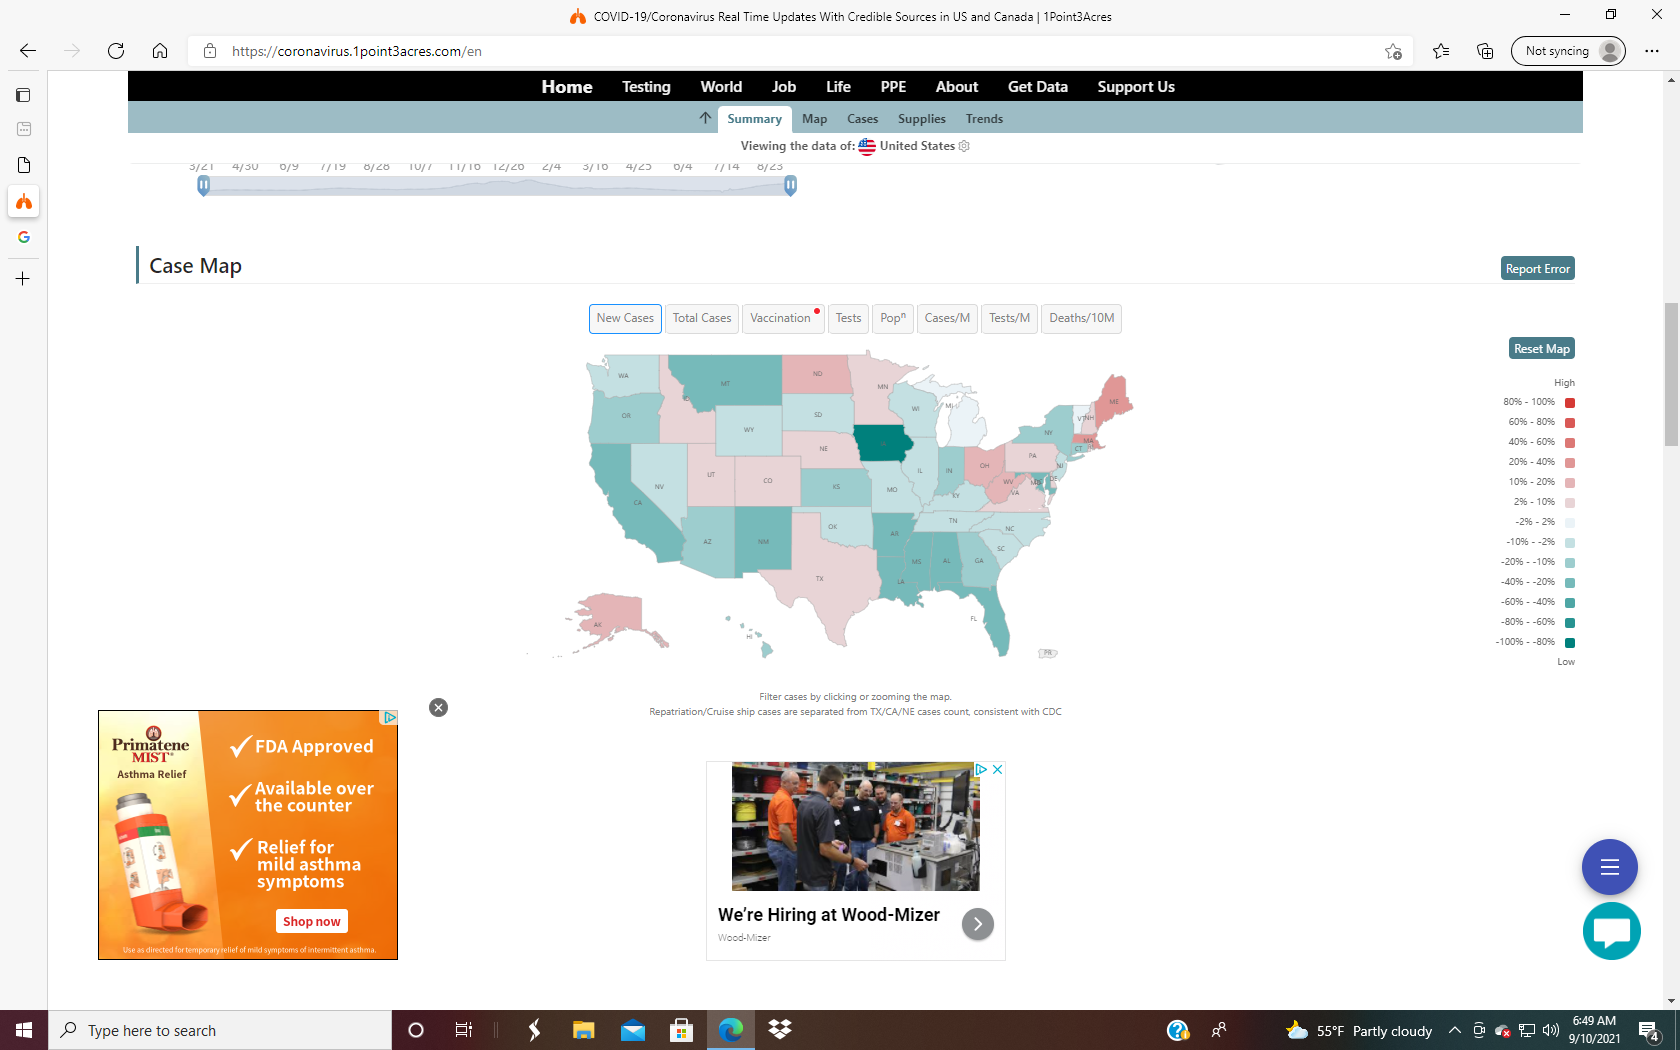
Actually the map I showed was for change of NEW cases not Total cases. Actually your https://www.statista.com/statistics/1109004/coronavirus-covid19-cases-rate-us-americans-by-state/
was for total cases / 1,000,000 for the whole pandemic where as my map show's the recent change in % of cases.
Still to soon to tell for sure.
OK, thanks for correcting me on that cutworm.
I didn't see any labels on your map but just went to the link and found that it is a map that shows the rate of change, as you indicated which is very important.
Appreciate it.
Here is southwest IN, we have low vaccination rates and the hospitals are filling up with mainly unvaccinated people.
There's now a 2 day wait to get tested because they are so backed up.
My youngest son that lives here, thinks that he got COVID at a St. Louis wedding last week and had to wait 2 days to get tested, which was yesterday. Haven't heard back.
No chess again this school year for the 200 kids that I coach at 5 schools )-:
This map is a good one to best reflect the current state, which is worst in the South, along with WY and ID.
IN is not doing well.
It won't allow the map to be copied:
This map shows a rolling average of daily cases for the past week. This is the best sign of hot spots. Our experts monitor this 7-day average instead of new cases, especially since local health departments have shifted their focus to vaccine reporting and no longer report case counts every 24 hours
https://www.mayoclinic.org/coronavirus-covid-19/map
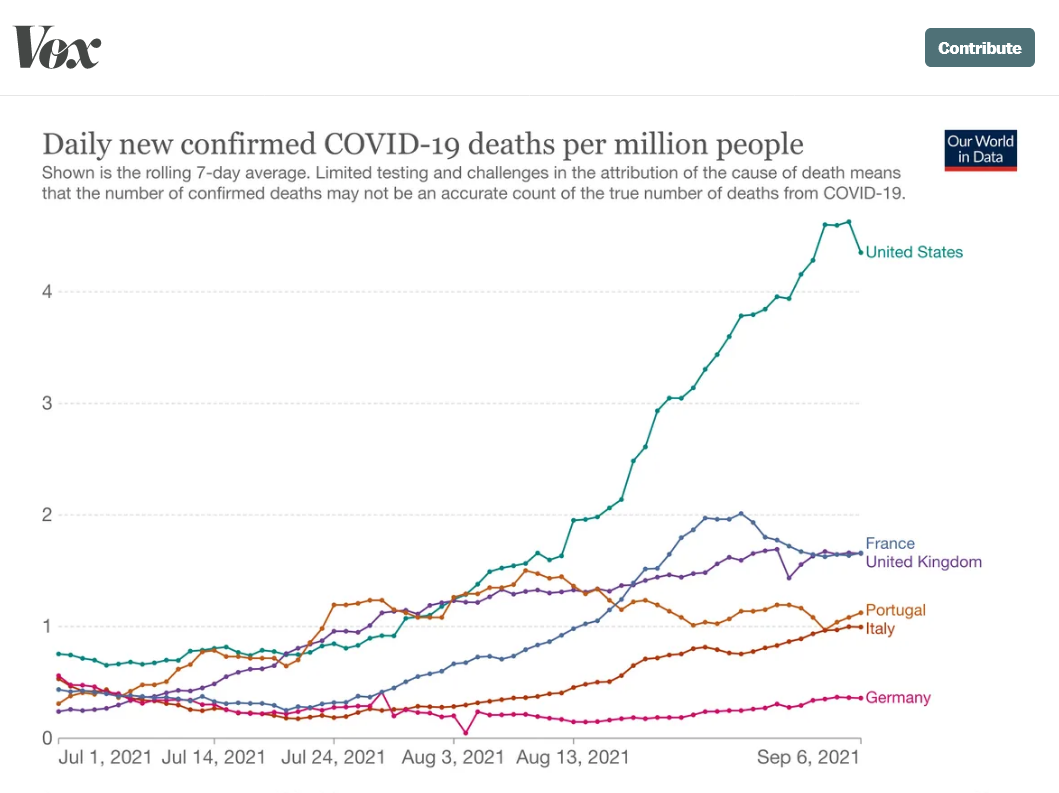
that is not exactly a surging death rate.
or... if you compare arizona, and new mexico... one is conservative, and one is liberal, different policies, but almost identical health outcomes. the rates of inflection and death rates, per 100k, is about the same.
the infection rate, and death rate, are both more closely corelated to geography, and not so much to policy.
How most of Europe caught up to — and then surpassed — the US in their Covid-19 vaccine drives.
"The speed of the rollout, combined with the United States’ role in developing and producing the vaccines, seemed to make vaccination a latter-day example of American exceptionalism, one that delivered a decisive blow against the virus that had upended life around the world for the past year.
But over the summer, America’s Covid-19 vaccine success story morphed into a tale of mediocrity and missed opportunities — while countries in Western Europe and Scandinavia caught up with, then surpassed, the United States in their vaccination campaigns."
"Another big difference that explains that divergence is one of culture and politics. Covid vaccinations have become, like so much of America’s pandemic response, polarized along political lines. As of July, 86 percent of Democrats said they were vaccinated, according to a Kaiser Family Foundation survey, while only 54 percent of Republicans said the same. One in five Republicans said they would “definitely not” get the vaccine."
metmike: So sad to see a disinformation campaign based on politics causing the death of thousands of Americans needlessly.
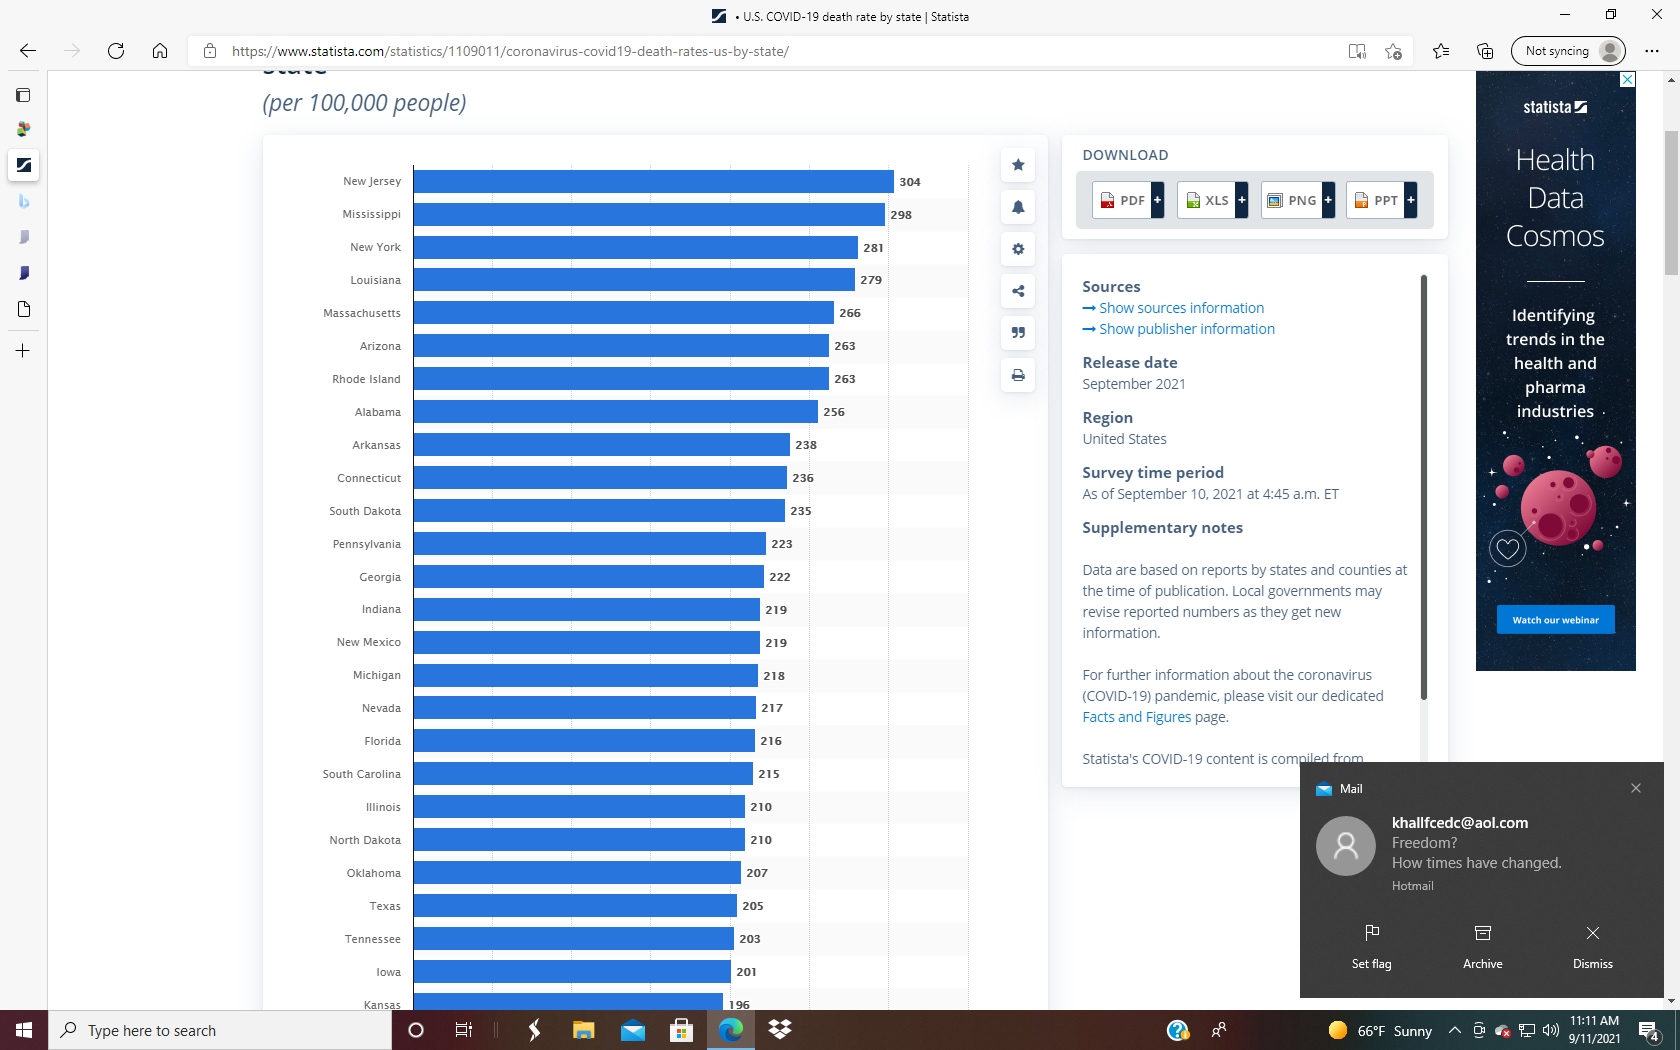
If we were to discuss Death rates (People getting killed)it would be better to use death rate data not # of cases
• U.S. COVID-19 death rate by state | Statista
The Spanish flue had at least 4 waves affecting different locations differently.
The pandemic is conventionally marked as having begun on 4 March 1918 with the recording of the case of Albert Gitchell, an army cook at Camp Funston in Kansas, United States, despite there having been cases before him.[92] The disease had already been observed in Haskell County as early as January 1918, prompting local doctor Loring Miner to warn the editors of the US Public Health Service's academic journal Public Health Reports.[10] Within days of the March 4 first case at Camp Funston, 522 men at the camp had reported sick.[93] By 11 March 1918, the virus had reached Queens, New York.[94] Failure to take preventive measures in March/April was later criticized.[95]
As the US had entered World War I, the disease quickly spread from Camp Funston, a major training ground for troops of the American Expeditionary Forces, to other US Army camps and Europe, becoming an epidemic in the Midwest, East Coast, and French ports by April 1918, and reaching the Western Front by the middle of the month.[92] It then quickly spread to the rest of France, Great Britain, Italy, and Spain and in May reached Breslau and Odessa.[92] After the signing of the Treaty of Brest-Litovsk (March 1918), Germany started releasing Russian prisoners of war, who then brought the disease to their country.[96] It reached North Africa, India, and Japan in May, and soon after had likely gone around the world as there had been recorded cases in Southeast Asia in April.[97] In June an outbreak was reported in China.[98] After reaching Australia in July, the wave started to recede.[97]
The first wave of the flu lasted from the first quarter of 1918 and was relatively mild.[99] Mortality rates were not appreciably above normal;[2] in the United States ~75,000 flu-related deaths were reported in the first six months of 1918, compared to ~63,000 deaths during the same time period in 1915.[100] In Madrid, Spain, fewer than 1,000 people died from influenza between May and June 1918.[101] There were no reported quarantines during the first quarter of 1918. However, the first wave caused a significant disruption in the military operations of World War I, with three-quarters of French troops, half the British forces, and over 900,000 German soldiers sick.[102]
.jpg)
Seattle police officers wearing white cloth face masks during the Spanish flu pandemic, December 1918
The second wave began in the second half of August 1918, probably spreading to Boston and Freetown, Sierra Leone, by ships from Brest, where it had likely arrived with American troops or French recruits for naval training.[102] From the Boston Navy Yard and Camp Devens (later renamed Fort Devens), about 30 miles west of Boston, other U.S. military sites were soon afflicted, as were troops being transported to Europe.[103] Helped by troop movements, it spread over the next two months to all of North America, and then to Central and South America, also reaching Brazil and the Caribbean on ships.[104] In July 1918, the Ottoman Empire saw its first cases in some soldiers.[105] From Freetown, the pandemic continued to spread through West Africa along the coast, rivers, and the colonial railways, and from railheads to more remote communities, while South Africa received it in September on ships bringing back members of the South African Native Labour Corps returning from France.[104] From there it spread around southern Africa and beyond the Zambezi, reaching Ethiopia in November.[106] On September 15, New York City saw its first fatality from influenza.[107] The Philadelphia Liberty Loans Parade, held in Philadelphia, Pennsylvania, on 28 September 1918 to promote government bonds for World War I, resulted in 12,000 deaths after a major outbreak of the illness spread among people who had attended the parade.[108]
From Europe, the second wave swept through Russia in a southwest–northeast diagonal front, as well as being brought to Arkhangelsk by the North Russia intervention, and then spread throughout Asia following the Russian Civil War and the Trans-Siberian railway, reaching Iran (where it spread through the holy city of Mashhad), and then later India in September, as well as China and Japan in October.[109] The celebrations of the Armistice of 11 November 1918 also caused outbreaks in Lima and Nairobi, but by December the wave was mostly over.[110]

American Expeditionary Force victims of the Spanish flu at U.S. Army Camp Hospital no. 45 in Aix-les-Bains, France, in 1918
The second wave of the 1918 pandemic was much more deadly than the first. The first wave had resembled typical flu epidemics; those most at risk were the sick and elderly, while younger, healthier people recovered easily. October 1918 was the month with the highest fatality rate of the whole pandemic.[111] In the United States, ~292,000 deaths were reported between September–December 1918, compared to ~26,000 during the same time period in 1915.[100] The Netherlands reported 40,000+ deaths from influenza and acute respiratory disease. Bombay reported ~15,000 deaths in a population of 1.1 million.[112] The 1918 flu pandemic in India was especially deadly, with an estimated 12.5–20 million deaths in the last quarter of 1918 alone.[99][page needed]
In January 1919, a third wave of the Spanish Flu hit Australia, where it killed around 12,000 people following the lifting of a maritime quarantine, and then spread quickly through Europe and the United States, where it lingered through the spring and until June 1919.[113][114][110] It primarily affected Spain, Serbia, Mexico and Great Britain, resulting in hundreds of thousands of deaths.[115] It was less severe than the second wave but still much more deadly than the initial first wave. In the United States, isolated outbreaks occurred in some cities including Los Angeles,[116] New York City,[1] Memphis, Nashville, San Francisco and St. Louis.[117] Overall American mortality rates were in the tens of thousands during the first six months of 1919.[118]
In spring 1920, a fourth wave occurred in isolated areas including New York City,[1] Switzerland, Scandinavia,[119] and some South American islands.[120] New York City alone reported 6,374 deaths between December 1919 and April 1920, almost twice the number of the first wave in spring 1918.[1] Other US cities including Detroit, Milwaukee, Kansas City, Minneapolis and St. Louis were hit particularly hard, with death rates higher than all of 1918.[121] Peru experienced a late wave in early 1920, and Japan had one from late 1919 to 1920, with the last cases in March.[122] In Europe, five countries (Spain, Denmark, Finland, Germany and Switzerland) recorded a late peak between January–April 1920.[119]
Thanks cutworm,
On the death rates for the entire pandemic, didn't you just correct me on using that data for the entire pandemic from that site?
Which includes before and after the vaccine? Or am I missing something?
https://www.marketforum.com/forum/topic/74423/#74737
Before the vaccine, some of the big cities had HUGE outbreaks. After the vaccine, not so much because city slickers are getting vaccinated.
Thanks for the details on the Spanish Flu.
Imagine how much worst than this and that we would be without the vaccination?