Mike
You have a GREAT way of summarizing weather data and what the 'market' had built in with forecasts.
Was not this weekend rains 'meager' compared to forecasts? Grains will be higher tonight?
Here in North Central Illinois, we received -0- with a 60% chance and most of us somewhat needing/wanting rain.
If time permits, a summary and look ahead?
TIA
our forecasts have not changed in weeks. Days out we have 60 to 70% and when that day gets here its 10 to 20%.....been this way and today is another prime example. Now we have 105 heat index coming for many days ahead
tjc,
Thanks for the compliment.
I actually was not watching close enough and the market was getting hammered from some non weather items so I don't want to pretend I know more than I do but I will share that in the next few hours.
We will have the grand kids for a couple more hours here.
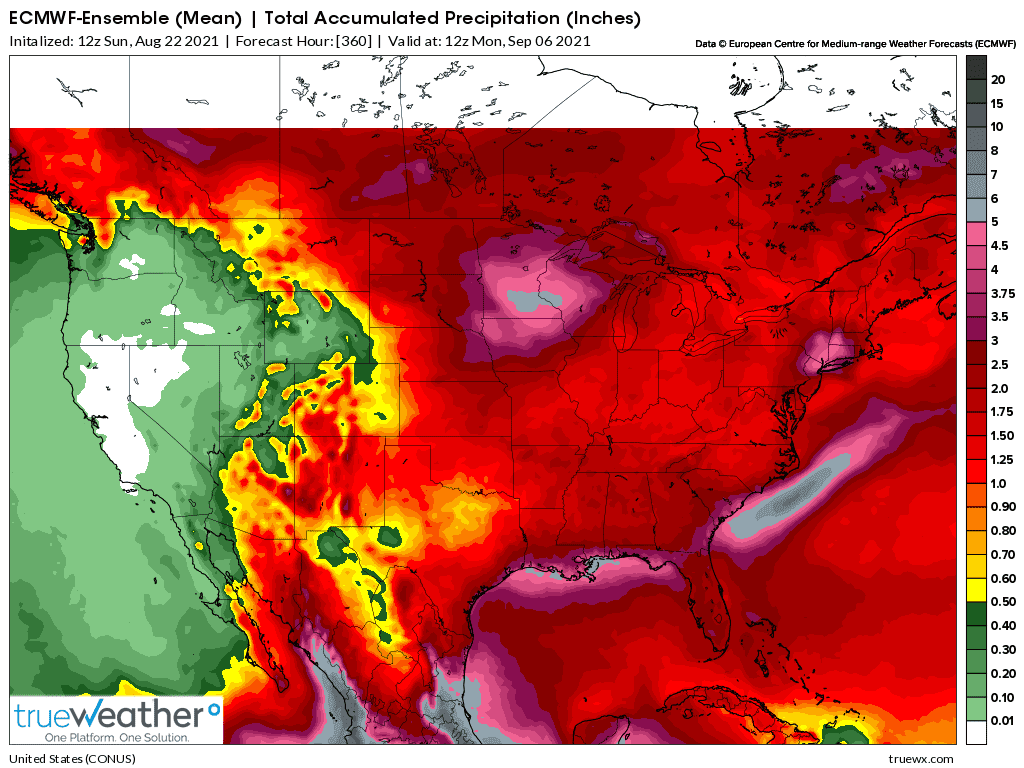
Rainfall did miss most of the cornbelt over the weekend(although we got 2 inches in the sw corner of IN(sure wouldn't have guessed it looking at the 7 day rain map below).
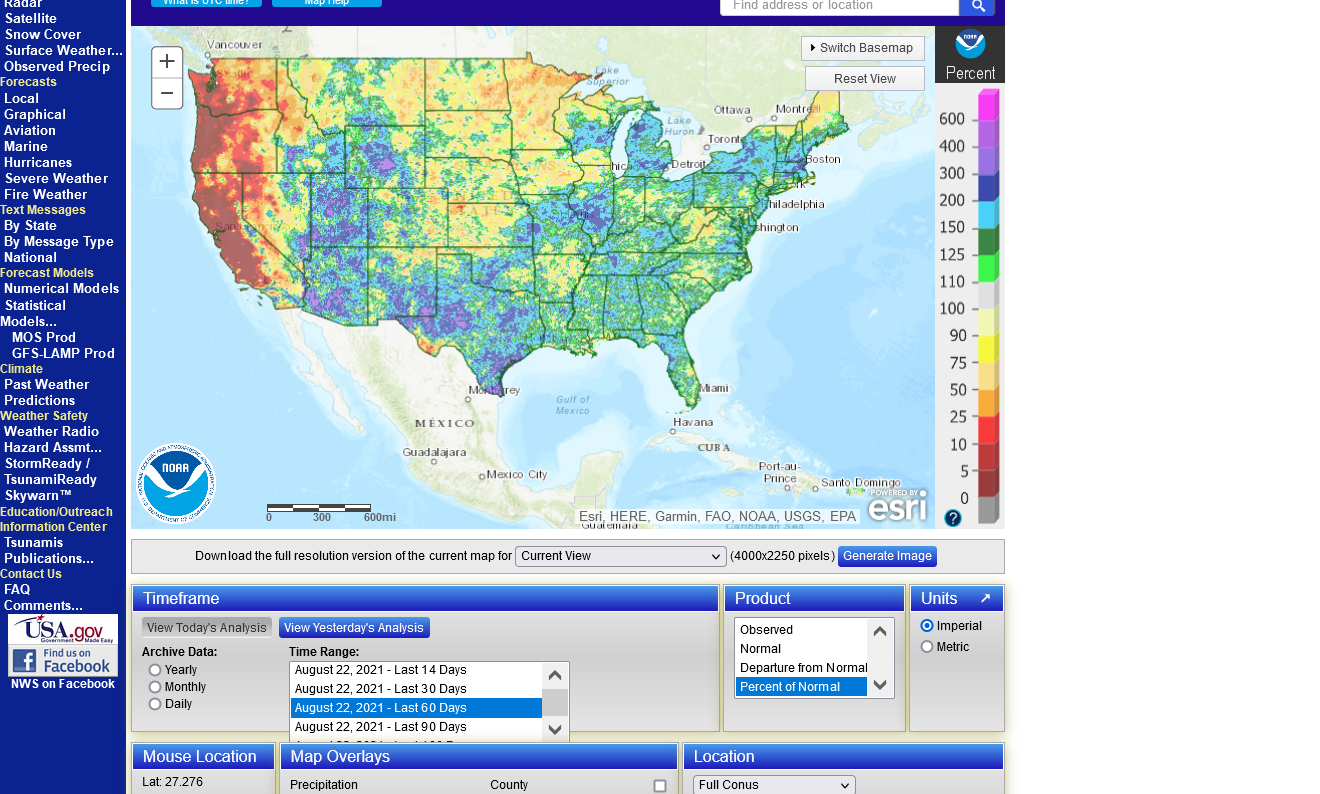
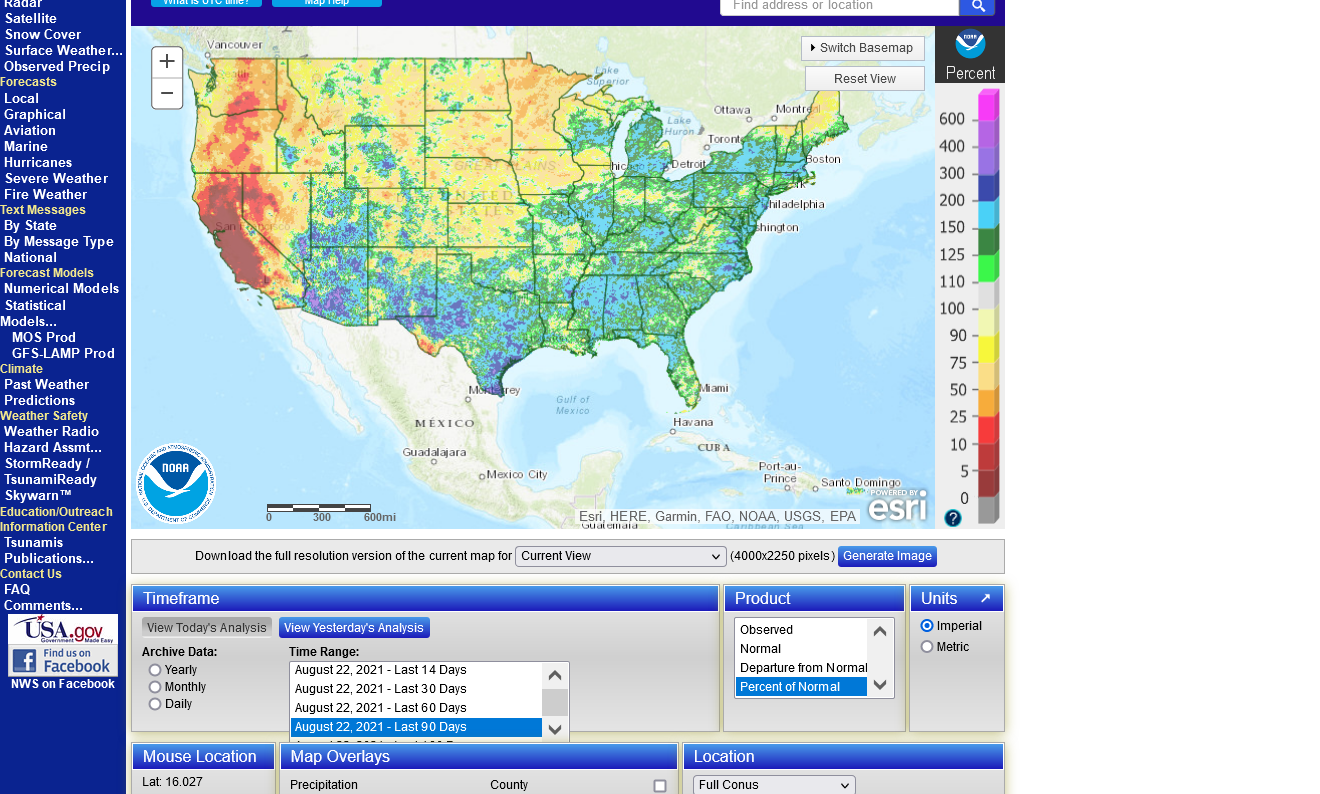
The maps below are for 7 days, 30, 60, 90 days.
I would say that the areas on the map that got short changed on the 30 day precip.........2nd map will see crop ratings fall again.
I think that corn dropped -2% and beans were -3% last Monday for the gd/ex.
The 7 day total rains are also a good indicator where crop ratings will fall the most. It's actually normal for crop ratings to drop 1-2% at this time of year because evapotranspiration usually exceeds rainfall in August and the crop is getting pretty mature.
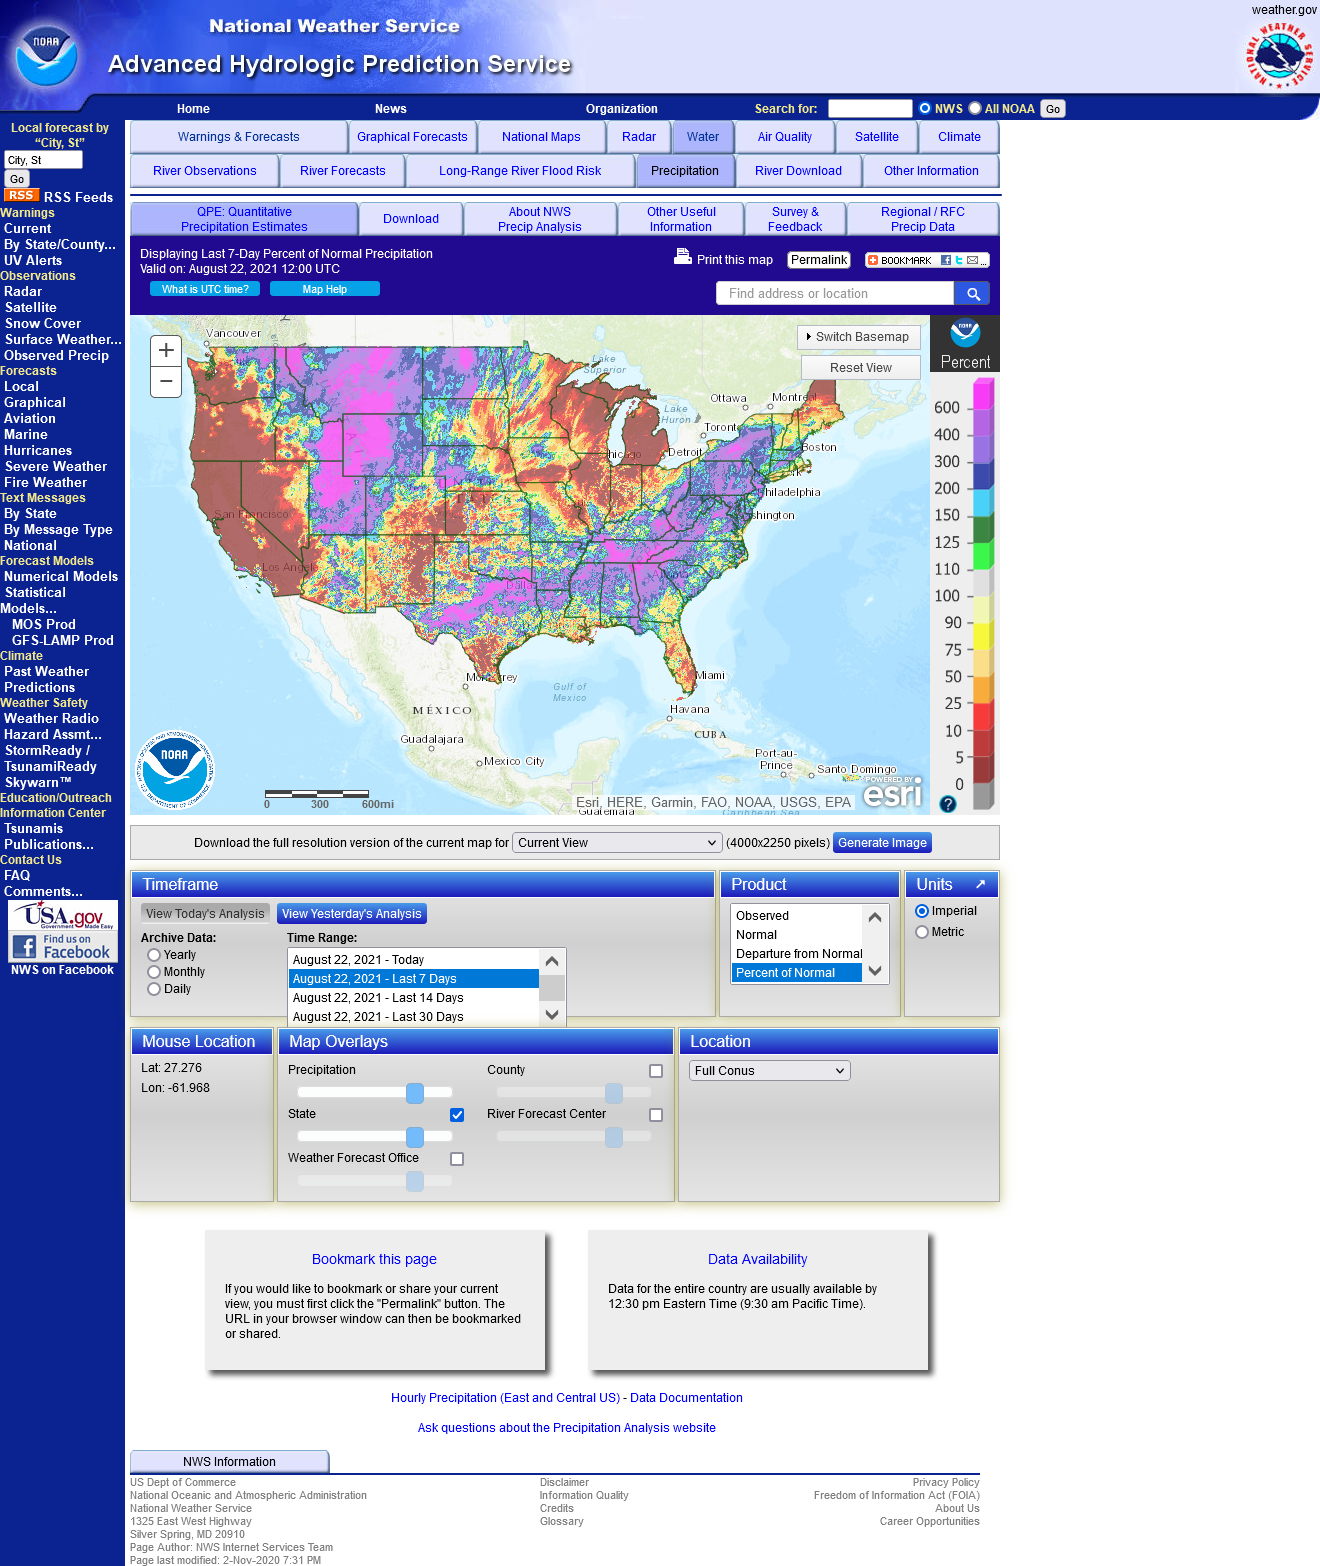

mcfarm and cutworm are telling us they are hurting, so this map must be deceptive but its usually a good indicator for how much the moisture the crop has.
I was very surprised at how well the pro farmer reports came in for the Upper Midwest considering the map below. Early planting helped and people continue to estimate how beneficial CO2 is to crops under drought stress(they don't have to open their stomata as wide to get CO2 and lose LESS moisture from transpiration).
Regardless, the areas in orange and red that didn't get rain recently will have another drop in crop ratings.
I see the narrow strip in northern Ill of yellow/orange. Is that you tjc?
![]()
If we didn't have any rain in the forecast, it could be pretty bullish, even though its getting late, especially for corn.
But the forecasts do have rain.
The latest rain forecasts are below.
Day 1 below:
http://www.wpc.ncep.noaa.gov/qpf/fill_94qwbg.gif?1526306199054

Day 2 below:
http://www.wpc.ncep.noaa.gov/qpf/fill_98qwbg.gif?1528293750112

Day 3 below:
http://www.wpc.ncep.noaa.gov/qpf/fill_99qwbg.gif?1528293842764

Days 4-5 below:
http://www.wpc.ncep.noaa.gov/qpf/95ep48iwbg_fill.gif?1526306162

Days 6-7 below:
http://www.wpc.ncep.noaa.gov/qpf/97ep48iwbg_fill.gif?1526306162

7 Day Total precipitation below:
http://www.wpc.ncep.noaa.govcdx /qpf/p168i.gif?1530796126

Extended weather.
https://www.cpc.ncep.noaa.gov/products/predictions/610day/ | |||||||||
| 6 to 10 day outlooks | |||||||||
| Click below for information about how to read 6-10 day outlook maps Temperature Precipitation | |||||||||
| Click below for archives of past outlooks (data & graphics), historical analogs to todays forecast, and other formats of the 6-10 day outlooks ArchivesAnalogsLines-Only FormatGIS Data | |||||||||
Temperature Probability | |||||||||
Precipitation Probability | |||||||||
+++++++++++++++++++++++++++++++++++++++++++++++++++++++++++
Highs for days 3-7:
https://www.wpc.ncep.noaa.gov/medr/medr_max.shtml


+++++++++++++++++++++++++++
Lows days 3-7 below:
https://www.wpc.ncep.noaa.gov/medr/medr_min.shtml
The corn is just about made in some places but heat for late filling will take a few bushels off the yield.
This sultry forecast is actually bullish for corn and beans because water needs will be even greater.
Dry areas that get hit with this heat and no rain will deteriorate and like cutworm said(I think it was him) this will be very bad for pod filling in the stressed areas and could take more than 10 bpa off of yields in the stressed spots(my WAG).
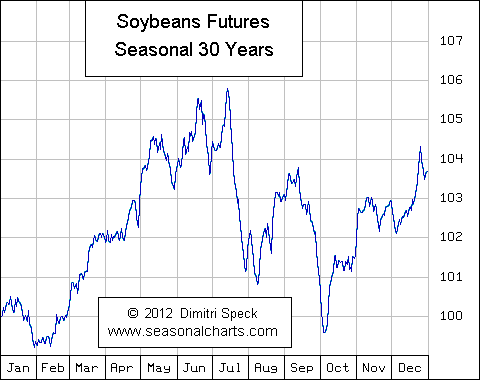
Seasonals, after the August crop report are often positive until we get early harvest going. COVID and outside markets are a huge wild card here though.
The liquid energies were collapsing lower last week. As long as COVID continues higher and there is concern about global demand dropping or potential shut downs, the weather in late August can take a back seat.
I've seen the beans rally as late as early September on hot/dry before but that might also have been in a late planted year.
There's no denying the calendar page though.
I would say this with some confidence. If the market thinks that the crop ratings will drop another 2-4 points on Monday, which seems reasonable, then it SHOULD BE pretty bullish.
Interesting that total rains the next 2 weeks are targeting some extremely dry places and there is a potential for them to repeat enough in those locations to get a bit excessive!\
This is the European model thats the wettest. 5+ inches in the gray shade.
It's so dry that this would not hurt anything in late August but is something to watch.
Not much rain though in IL/IN/OH.
What do you guys think?
I can only hope that last map you put up is as wrong as most of the predictions since July....otherwise its big trouble for this area
mcfarm,
I'm not super optimistic about your rain chances.
There will be heat fill for the corn this week also.
Highs at 90+ and above and night time lows at 70+.
I am in the light green area, just below the white.
Just now wanting another drink for pod filling. This week heat with 30% chances has most around here worried.
Bought bean oil too early Friday, but pretty nice bounce tonight.
If you look at this you will see that Mcfarm and I are in a dry pocket
Thanks cutworm, I see you!
That stinks.

