
Rains continue to increase for the 4th day in a row!
Forecast for rains below:
Day 1:
http://www.wpc.ncep.noaa.gov/qpf/fill_94qwbg.gif?1526306199054

Day 2:
http://www.wpc.ncep.noaa.gov/qpf/fill_98qwbg.gif?1528293750112

Day 3:
http://www.wpc.ncep.noaa.gov/qpf/fill_99qwbg.gif?1528293842764

Days 4-5:
http://www.wpc.ncep.noaa.gov/qpf/95ep48iwbg_fill.gif?1526306162

Days 6-7:
http://www.wpc.ncep.noaa.gov/qpf/97ep48iwbg_fill.gif?1526306162

7 Day Total precip:
http://www.wpc.ncep.noaa.govcdx /qpf/p168i.gif?1530796126

Severe Storm Risk. Upper Midwest. Press your cursor on the map for full screen.
https://www.spc.noaa.gov/products/outlook/
Excessive Rainfall threat returning!
Current Day 1 Forecast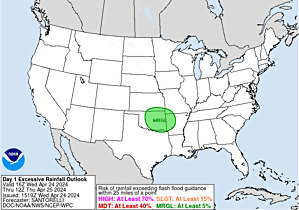 Valid 12Z 07/05/18 - 12Z 07/06/18 |
Day 1 Threat Area in Text Format
| Day 2 and Day 3 Forecasts |
Current Day 2 Forecast |
All Current Hazards Map:
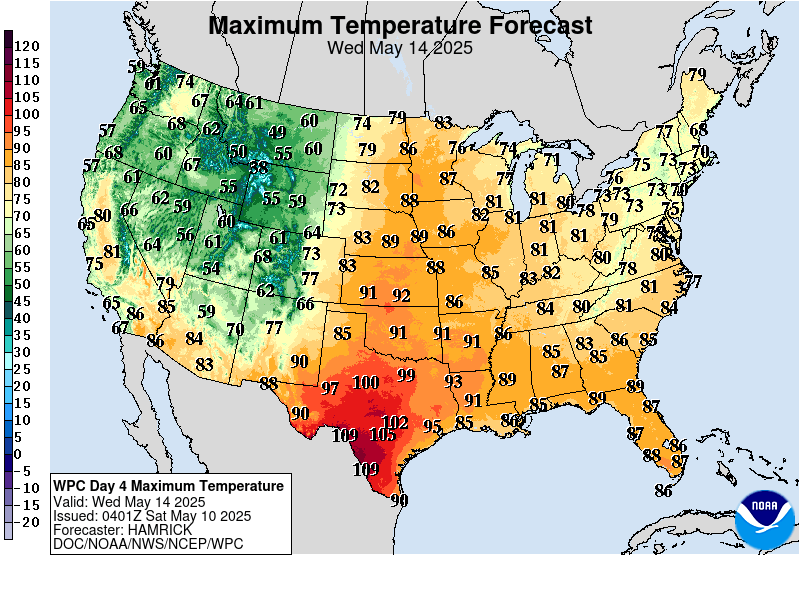
High Temperatures today and Thursday.......hot in the center to Southeast.


Dew points increasing northward.

Heat and high humidity .....feels like temperature!

Highs days 3-7 shows Hot then............cooling N.Plains Upper Midwest.



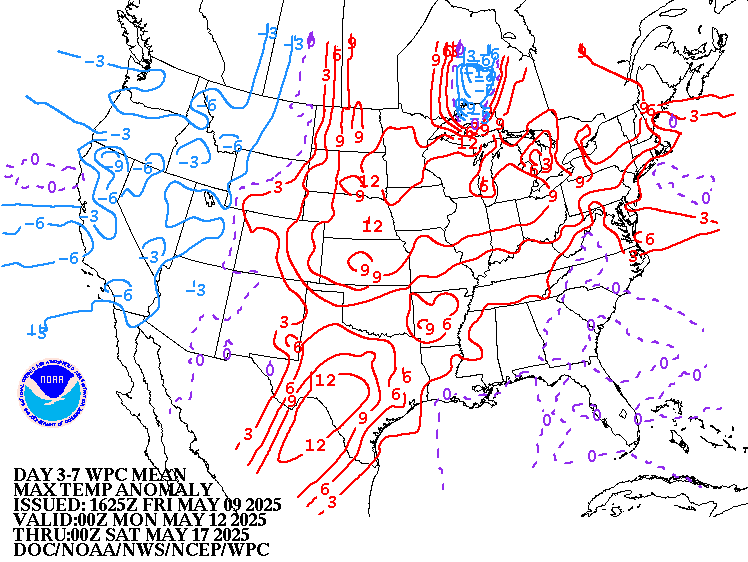
How do these temperatures compare to average at this time of year. Above average in the hottest time of year!:
High temperature departures:
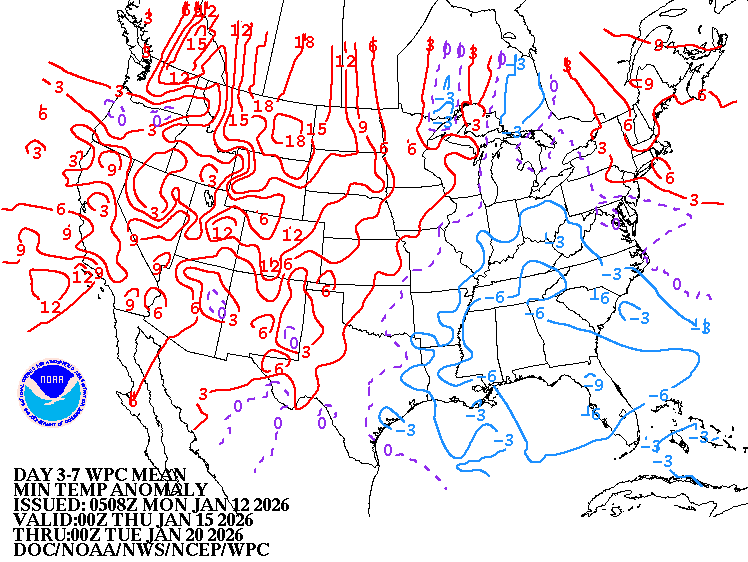
Low Temperature Departures:
Satellite picture.

Rains the past 24 hours. Not much.
![]()
You can go to this link to see rain totals from recent time periods:
https://water.weather.gov/precip/
Go to precipitation, then scroll down to pick a time frame. Hit states to get the borders to see locations better. Under products, you can hit "observed" or "Percent of normal"
Missouri/Arkansas to S.Plains in bad shape


Drought Monitor

Canadian ensembles back up the heat ridge in week 2 with a deepening trough in the Northeast. This has been a consistent theme for numerous days for this model, except late on the 12z run Tuesday with fewer and fewer members having the heat ridge farther east.
384h GZ 500 forecast valid on Jul 25, 2018 00 UTC
GFS ensembles have the same idea........Strong heat ridge Southwest, upper level trough East.
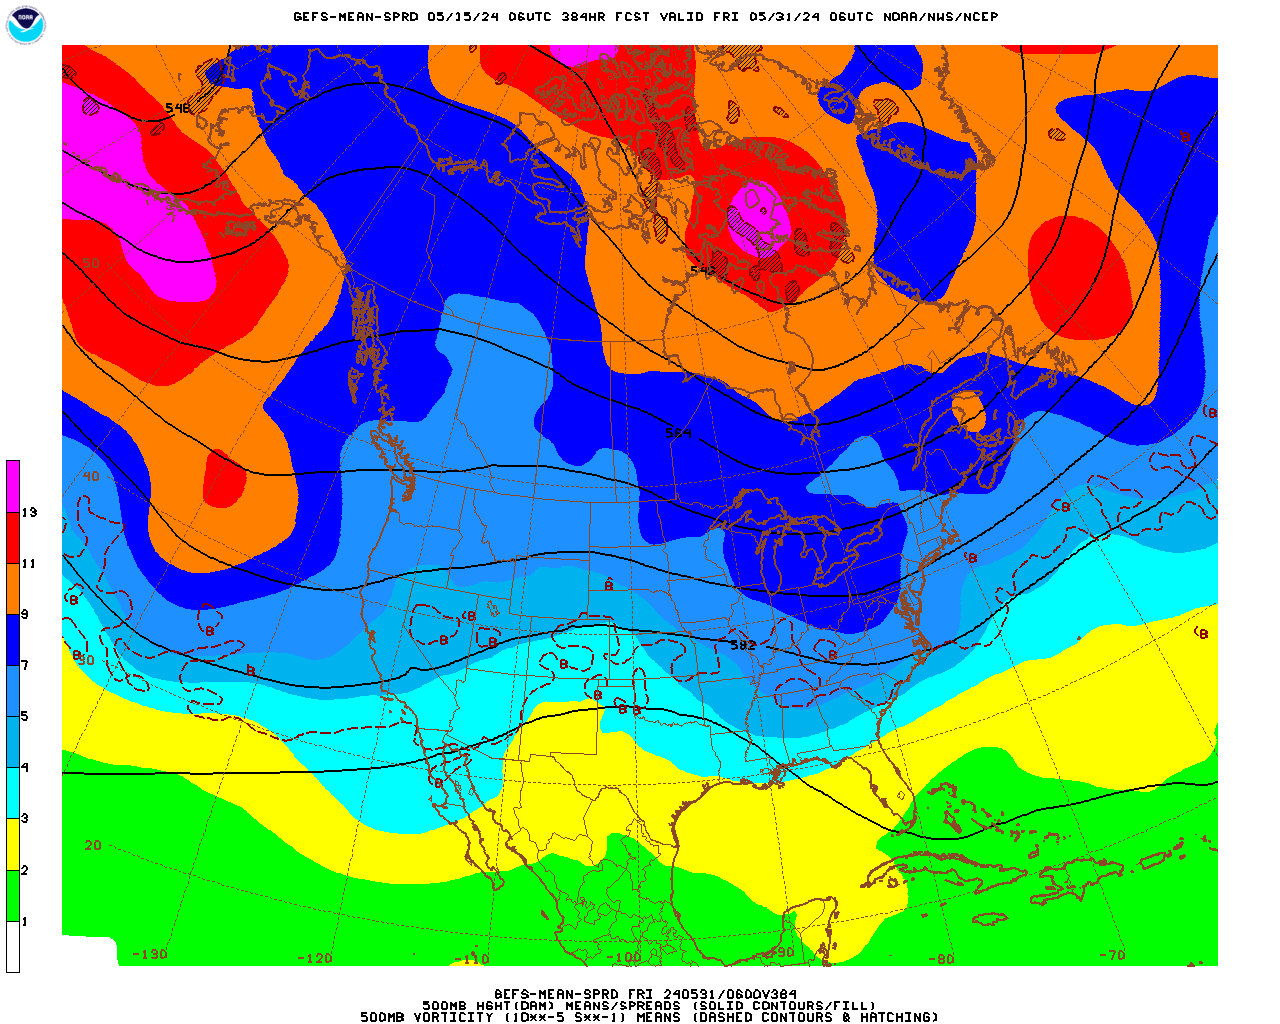
The longer range, week 3 and week 4 forecast still shows cool...and wet in many places.

Precip below:

The NWS extended forecasts are below.
This extended period obviously displays less skill than the week 1 period but right now, the confidence is even lower, especially with regards to precip.
A strong cold front is likely to be pushing thru at the very start of this period.
Temperature Probability 6-10 day |
Precipitation Probability |
Temperature Probability 8-14 day | |
Precipitation Probability | |
Extreme weather days 3-7:

Last 12z Canadian model ensembles all over the place on where the heat ridge might be in 2 weeks. Alot of them think that there will be a trough in the Northeast to Upper Midwest.
360h GZ 500 forecast valid on Jul 26, 2018 12 UTC
Forecasts for the control (GEM 0) and the 20 ensemble members (global model not available)
GFS ensembles from the 12Z run are similar, slightly stronger with the trough at this 2 week time frame.

Your maps show increasing dry sub soil in our area
At least "here" the map is correct
However, the map shows high chances of rain in our area
Local maps show very small chances
I hope your maps are the correct ones
Seems CBOT has yield at 180 and 50 plus if the recent plunge in price is any indication