Post away!
Geesh!! What a rebound! Wasn't expecting it on the open though.
Thanks Mark,
Yes, the evening traders have been way more bullish ng than the traders earlier today.
Thanks for getting an overdue new thread started Larry!
Here's the link to the previous one:
NG 5/20/21-6/10/21
60 responses |
Started by WxFollower - May 20, 2021, 2:09 a.m.
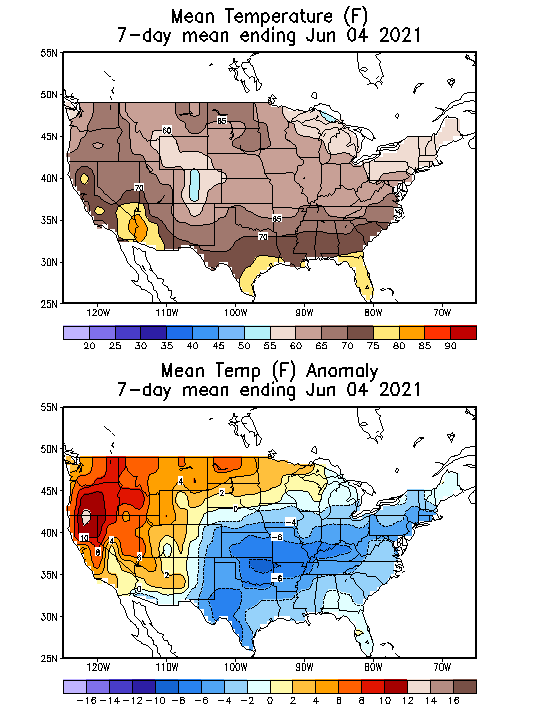
Some key items to carry over to this thread. Temps from this last report:
July natural gas futures touched $3.200/MMBtu early Thursday, but government storage data confirming a continuation of loose balances quickly drained momentum. The July Nymex contract ultimately settled at $3.149, up only 2.0 cents day/day. August climbed 2.2 cents to $3.166. Spot gas prices continued to weaken in some areas of the United States, with the
Natural gas may have woken up to what Larry was saying on the NON loose EIA report yesteray(more bullish in his view than the market traded the rest of the day)
Of course we still have alot of heat coming later this month and exports should be record to help Europe and China restock after a cold Winter.
Today's massive move higher is very, VERY impressive.
It might explain why, earlier this week, every time the GFS Ensemble would come out cooler, we might sell of briefly but then buying would kick to support prices within an hour......we tried to drop but couldn't....and a couple of hours later, we were higher than when the cooler solution came out.
This was a market that couldn't go lower on bearish news.
Yesterdays reaction to the EIA report was apparently a big fake out.
After a week of only modest changes along the Nymex futures curve, price action on Friday was anything but, as a major natural gas pipeline warned that restrictions it has in place could last through the end of September. The July Nymex gas futures contract started climbing overnight and continued to surge throughout the day,…
metmike: OK, OK...........now it makes more sense. I wondered why the market suddenly took off like there was no tomorrow shortly after the open on Thursday evening.....and never looked back. This was the exact type of move that we often see when new fresh, very bullish news is released that the market didn't expect and dials it in quickly over the next day.
I still say that the EIA was in reality reflective of a solidly bullish supply/demand balance. I’ll try to post an updated table of Memorial Day weeks when I get the chance.
Thanks Larry, we look forward to it.
Here's the latest weather......which is overdue for starting a new thread. Will try to do that on Sunday.
Mike,
Here is the update adding the solidly bullish 2021 Memorial Day week:
CDD EIA Year
60 +92 2018
57 +77 2006
55 +62 2012
55 +80 2011
52 +65 2016
51 +99 2010
45 +119 2019
42 +102 2020
38 +110 2007
37 +119 2014
36 +102 2004
32 +132 2015
31 +111 2013
30 +106 2017
30 +124 2009
30 +105 2008
26 +105 2005
26 +98 2021
25 +114 2003
Look at how 2021 sticks out like a bullish thumb. Based on this, the only other years back to 2003 that are more bullish are 2012 and 2016 (by ~7 bcf). I see none that are about comparable. The next most bullish appears to be 2005, but it is 7 bcf more bearish than 2021.
So, I have most bullish to be 2012/2016 followed by 2021 being 7 bcf back followed by 2005 being another 7 bcf back.
Also, as mentioned, this +98 was quite bullish vs the prior week which had no holiday and 16 more CDD/18 fewer HDD. Keep in mind that I've found CDD to have more impact in late May than HDD. So, this latest week having had 16 fewer CDD, 18 more HDD, and a holiday and having the same +98 EIA tells me quite bullish vs prior week.
I love how the market saw that bullish pipeline issue and never looked back until very late (due to cooler models/profit-taking imo) as if the prior day's EIA's supposed "looseness" <G> was totally forgotten.
Aside: 12Z GEFS Sun vs 12Z GEFS Fri -6 CDD
12Z EPS Sun vs 12Z EPS Fri -2 CDD
So, only slightly less hot/slightly bearish fwiw.
You make an extremely convincing case that I believe in Larry!
Also agree that we are a tad less hot.
We are in the seasonal top area for natural gas.............historically speaking. From now thru July, the price often drops, even with some modest heat.
https://www.marketforum.com/forum/topic/69687/#70746
But each year is different.
This one has some really bullish ammo, including what you just showed.
Pretty decent, widespread heat means lower than average injections in early July. Exports are at record levels.
Storage is much less than a year ago and slightly less than the 5 year average...........we need big injections.
All Energy prices look like they're headed higher along with inflation.
So I am leery of shorting this market based on the seasonal unless it would turn much cooler.
Natural gas futures were virtually unchanged in early trading Monday, holding onto recent gains as updated forecasts eased off somewhat on expected heat over the next two weeks. The July Nymex contract was up 0.8 cents to $3.304/MMBtu at around 8:45 a.m. ET. The July contract is coming off a roaring 14.7-cent rally in Friday’s…
metmike: Some less hot weather models at times but overall, the pattern is likely to result in above average CDD's this Summer. These next 10 days will not feature much heat in the Midwest/East(after the current heat wave dies the next couple of days). But the pattern seems at risk for bouncing back into a dominant heat ridge spreading back eastward beyond that........and including the south next time, which gives a higher potential of accumulating huge CDD's.
Interesting quote from the linked NGI article:
Also of note, Pacific Gas and Electric Co. (PG&E) announced it would adjust how it reports storage inventory to reflect a reclassification of 51,098 MMcf from working gas to cushion gas. The adjustment will affect the storage inventory level PG&E reports to the EIA beginning with the week ended June 18.
This means the EIA storage report covering that period “should show a ‘net change’ number which is 51 Bcf lower than the ‘implied flow’ number for that week,” said Wood Mackenzie analyst Eric McGuire.
The change has the impact of reducing inventory in the winter and withdrawal capacity in the summer, a “potentially bullish” development for high demand periods, McGuire said.
Thanks for pointing that out Larry.
Am not sure what this means.
Is the EIA report next Thursday going to show 51 BCF of gas vanishing from stocks in the Pacific region?
Thats pretty crazy for it to be such a large number.
metmike: Natural gas plunged right after the hurricane center update this morning..........so much of this has been about the threat of a hurricane in the Gulf of Mexico. WOW!
Mike said:
"Thanks for pointing that out Larry.
Am not sure what this means.
Is the EIA report next Thursday going to show 51 BCF of gas vanishing from stocks in the Pacific region?"
-------------------------------------------------------
Mike,
1. Next Thursday's EIA report will show a shift of 51 bcf from working gas, which is what is tracked each week, to base gas. So, that portion of the EIA will look like a 51 bcf withdrawal. Offsetting probably more than all of it will be the normal injection of working gas. The net effect would be a small injection. But the implied would be a regular injection size.
2. The effect of this potential TC is likely going to be rather small overall on a net basis. So, IF there are really big swings just on this (nobody really knows for sure but the market does some really strange things often like last Thursday from my perspective), it appears you agree that it is way overblown.
Thanks for clarifying and confirming.
I've seen small changes in the past featuring this process but 51 BCF? That's like 10 times more than usual.
Of course the market will know and anticipate this. When did news of this first come out? Maybe thats part of the recently rally.
Did you see that plunge in NG when the NHC update came out?
We also have a forecast that is losing heat/CDD's.
Mike,
You're welcome. I agree with most everything you just said. I ddin't see it plunge on the NHC update (I was sleeping though I could go back and look at time and sales), but I trust what you say.
I suspect that there were many who knew about this 51 bcf before NGI and others knew thus causing some of them to buy. Maybe this is the real main reason the price rise so sharply Friday morning instead of that pipeline issue? Could it be? The news sources are often fooled.
Indeed, the 51 would be far higher than most any other per my memory. I may look back at the actuals of the past if I get some time.
Not only would the 51 reclass for the week ending 6/18/21 be far higher than the usual as Mike noted, it is being announced in advance, which I don't recall ever seeing before.
25 prior reclassifications: (working to base or base to working:
05/07/21: 4 w to b
04/05/19: 4 w to b
01/04/19: 4 w to b
03/30/18: 9 w to b
05/26/17: 4 w to b
03/02/17: 4 w to b
02/03/17: 5 w to b
06/24/16: 5 w to b
01/01/16: 4 b to w
08/28/15: 7 b to w
07/17/15: 7 w to b
05/09/14: 8 b to w
08/02/13: 14 b to w
03/15/13: 4 b to w
11/16/12: 7 w to b
04/06/12: 10 w to b
01/21/11: 10 w to b
03/27/09: 9 w to b
07/20/07: 7 b to w
07/06/07: 10 b to w
04/14/06: 10 or less b to w
11/04/05: 10 b to w
11/05/04: 7 b to w
10/08/04: 7 w to b
06/06/03: 11 b to w
AVERAGE: 7
HIGHEST: 14
-----------------------------------------------------------------------
Aside that I bet Mike remembers well:
An erroneously very low AGA injection of 3 was released on 8/15/01 for the week ending 8/10/01 (private AGA before the govt's EIA too over) causing nearby to zoom up from $3.03 to a high of $3.49 and a close of $3.47! Looking back at my records, my guess for that week was +59 and average industry guesses were near +64. Rumors started about an upcoming big revision for an error despite AGA denying it. The next week's report (for week ending 8/17/01), it was revised from +3 to +50 meaning a +47 revision, which caused a plunge from $3.20 to $2.80! One week later (on 8/29/01, it fell to as low as $2.25 on expiration day!
Man, Larry, your data archives and analysis, especially on natural gas are better than anybody that I’ve known in my life!
That’s not just an ultimate compliment, it’s a stone cold authentic fact.
I think that, yes it’s this factor that could be responsible for the unexplained strength in ng that was relentless and unexplainable from Thursday evening until this morning around 10am.
I may be totally wrong about the tropical update but the price movement strongly suggests it was related to some sort of new news......and this one is the much stronger candidate.
Especially considering the reaction 2 decades ago that you showed the stats for.
Can you imagine how many people lost their shirts......and blew out their accounts from that fiasco?
Like I said earlier. Who has detailed data from that event that they can show in a post on a forum?
Nobody does.
Except one person.
WxFollower at MarketForum!
Thanks
Mike
metmike: Technical factors might explain it or maybe the dynamic that Larry showed regarding storage is hanging over the market. Considering the potential for an extreme price spike from this, there is enormous risk and uncertainty at the moment and especially with the EIA report on Thursday. Any guesses on how ng will act following the release tomorrow? Is it possible that some traders don't know about this change and could be shocked by the initial release that takes off 51BCF of gas out of storage? Or will the market sell the release, sort of like buy the rumor, sell the news type market action which is typical for one time events like this?
Mike,
Thanks for the nice words!
Regarding the expected 51 reclassification, that is supposedly for the report to be released NEXT week, not tomorrow, even if it is real.
That's right. Thanks for correcting me.
That actually makes a slight difference for me in considering any sort of trade but it appears that this is not a very good weather market at the moment anyway.
Natural gas futures tumbled early Wednesday, threatening a second day of losses, but prices rebounded in afternoon trading as new data showed production declined, exports climbed and weather forecasts pointed to strong cooling demand in the weeks ahead. The July Nymex contract settled at $3.251/MMBtu, up 1.1 cents day/day. It marked the sixth day of
metmike: No mention of the Tropical Storm/system headed to the GOM with 90% certainty? Guess it will just be too weak?
Well, that 6/14/21 NGI report that I quoted said it wouldn‘t be reported til the report for the week ending 6/18/21, but they were a week too late:
“Note: Reclassifications from working gas to base gas resulted in decreased working gas stocks of 51 Bcf in the Pacific region for the week ending June 11, 2021. The implied flow for the week is an increase of 67 Bcf to working gas stocks.”
The NGI report had said this:
“Also of note, Pacific Gas and Electric Co. (PG&E) announced it would adjust how it reports storage inventory to reflect a reclassification of 51,098 MMcf from working gas to cushion gas. The adjustment will affect the storage inventory level PG&E reports to the EIA beginning with the week ended June 18.
This means the EIA storage report covering that period ’’should show a ‘net change’ number which is 51 Bcf lower than the ‘implied flow’ number for that week,‘ said Wood Mackenzie analyst Eric McGuire.”
Glad we got that out of the way Larry! Now we can go on to weather.
https://www.investing.com/economic-calendar/natural-gas-storage-386
Latest Release Jun 17, 2021 Actual16B Forecast72B Previous98B
| Release Date | Time | Actual | Forecast | Previous | |
|---|---|---|---|---|---|
| Jun 17, 2021 | 10:30 | 16B | 72B | 98B | |
| Jun 10, 2021 | 10:30 | 98B | 98B | 98B | |
| Jun 03, 2021 | 10:30 | 98B | 95B | 115B | |
| May 27, 2021 | 10:30 | 115B | 104B | 71B | |
| May 20, 2021 | 10:30 | 71B | 60B | 71B | |
| May 13, 2021 | 10:30 | 71B | 76B | 60B |
for week ending June 11, 2021 | Released: June 17, 2021 at 10:30 a.m. | Next Release: June 24, 2021
+16 BCF but implied flow +67 BCF ......tricky/unprecedented .......see the explanations above
https://www.marketforum.com/forum/topic/70798/#71037
| Working gas in underground storage, Lower 48 states Summary text CSV JSN | |||||||||||||||||||||||||
|---|---|---|---|---|---|---|---|---|---|---|---|---|---|---|---|---|---|---|---|---|---|---|---|---|---|
| Historical Comparisons | |||||||||||||||||||||||||
| Stocks billion cubic feet (Bcf) | Year ago (06/11/20) | 5-year average (2016-20) | |||||||||||||||||||||||
| Region | 06/11/21 | 06/04/21 | net change | implied flow | Bcf | % change | Bcf | % change | |||||||||||||||||
| East | 461 | 445 | 16 | 16 | 583 | -20.9 | 503 | -8.3 | |||||||||||||||||
| Midwest | 570 | 547 | 23 | 23 | 684 | -16.7 | 581 | -1.9 | |||||||||||||||||
| Mountain | 165 | 160 | 5 | 5 | 155 | 6.5 | 153 | 7.8 | |||||||||||||||||
| Pacific | 236 | C | 276 | -40 | 11 | C | 289 | -18.3 | 270 | -12.6 | |||||||||||||||
| South Central | 995 | 983 | 12 | 12 | 1,170 | -15.0 | 1,046 | -4.9 | |||||||||||||||||
| Salt | 299 | 302 | -3 | -3 | 358 | -16.5 | 317 | -5.7 | |||||||||||||||||
| Nonsalt | 696 | 681 | 15 | 15 | 812 | -14.3 | 729 | -4.5 | |||||||||||||||||
| Total | 2,427 | C | 2,411 | 16 | 67 | C | 2,880 | -15.7 | 2,553 | -4.9 | |||||||||||||||
Note: Reclassifications from working gas to base gas resulted in decreased working gas stocks of 51 Bcf in the Pacific region for the week ending June 11, 2021. The implied flow for the week is an increase of 67 Bcf to working gas stocks. (See Notes and Definitions for more information on "implied flow.") Totals may not equal sum of components because of independent rounding. C=Reclassification. | |||||||||||||||||||||||||
Working gas in storage was 2,427 Bcf as of Friday, June 11, 2021, according to EIA estimates. This represents a net increase of 16 Bcf from the previous week. Stocks were 453 Bcf less than last year at this time and 126 Bcf below the five-year average of 2,553 Bcf. At 2,427 Bcf, total working gas is within the five-year historical range.
For information on sampling error in this report, see Estimated Measures of Sampling Variability table below.

Note: The shaded area indicates the range between the historical minimum and maximum values for the weekly series from 2016 through 2020. The dashed vertical lines indicate current and year-ago weekly periods.
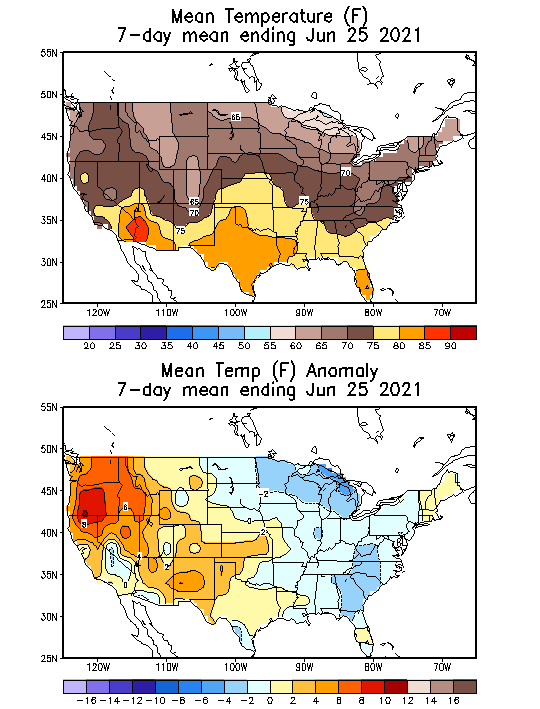
These were the 7 day temperatures for the EIA report. High heat w.TX to Midwest/very warm southeast. Cool West and far northeast.
20 Rigs running and I have 1.
| Directors Cut | 6/15/2021 | ||||||||
| NDIC | |||||||||
| Oil | M over M | M over M | Gas | M over M | M over M | ||||
| Mth | Mthly cum | Bbls/ D | Mthly cum | Mcf/ D | |||||
| 2021 | April | 33,646,529 | -2% | 1,121,551 | 1% | 88,898,778 | 0% | 2,963,293 | 3% |
| March | 34,361,668 | 13% | 1,108,441 | 2% | 89,236,535 | 18% | 2,878,598 | 6% | |
| Feb | 30,324,555 | -15% | 1,083,020 | -6% | 75,710,555 | -14% | 2,703,943 | -5% | |
| Jan | 35,568,679 | -4% | 1,147,377 | -4% | 88,327,784 | -2% | 2,849,283 | -2% | |
| 2020 | Dec | 36,956,504 | 1% | 1,192,145 | -3% | 89,680,150 | 4% | 2,892,908 | 0% |
| Nov | 36,736,201 | -3% | 1,224,240 | 0% | 86,323,059 | -3% | 2,887,402 | 0% | |
| Oct | 37,909,008 | 3% | 1,223,107 | 0% | 89,083,281 | 5% | 2,873,654 | 2% | |
| Sept | 36,649,997 | 1% | 1,221,667 | 5% | 84,453,374 | 3% | 2,815,112 | 7% | |
| Aug | 36,126,492 | 12% | 1,165,371 | 12% | 81,692,742 | 14% | 2,635,250 | 14% | |
| July | 32,304,503 | 21% | 1,042,081 | 17% | 71,375,125 | 21% | 2,302,356 | 17% | |
| June | 26,703,268 | 0% | 890,109 | 4% | 59,198,681 | -1% | 1,973,289 | 2% | |
| May | 26,640,218 | -27% | 859,362 | -30% | 59,771,779 | -27% | 1,928,122 | -29% | |
| April | 36,572,571 | -17% | 1,219,086 | -15% | 81,365,042 | -16% | 2,712,168 | -13% | |
| March | 44,276,463 | 1,428,273 | 96,902,755 | 3,125,895 | |||||
| All time highs | |||||||||
| Oil | 1,519,037 | Bbls/D | 11/30/19 | ||||||
| Gas | 3,145,172 | Mcf/D | 11/30/19 | ||||||
| Rig count | 218 | 5/29/2012 | |||||||
Thanks Joe!
Looks like very little change over the last month.
Joelund natural gas compilation for the Bakken the past year:
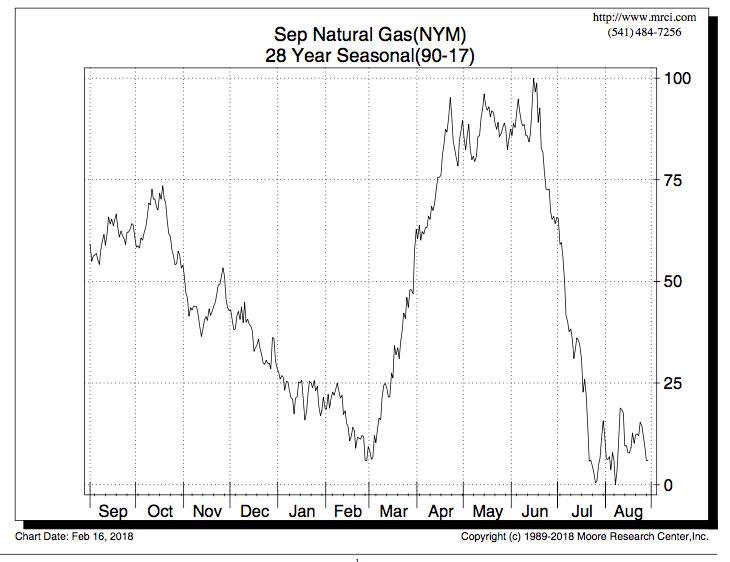
metmike: That pretty much sums it up. We are now at the time of year, seasonally, which often results in ng prices sliding. Sometimes even with temperatures a bit above average.............but each year is different.
I'm not sure what all goes into a chart like this, certainly some things that don't add up in the real world to the price going from the highest of the year in mid June to the lowest price of the year a month later.............that almost never happens in the real market in any year.
However, a chart like this is useful because it shows the strong seasonal/historical tendencies.
Usually, you wouldn't want to be long in July unless the forecast has MAJOR heat or something else is extraordinarily bullish that would not be the case in previous July's.
Just like you wouldn't want to be short in March/April without a dang good reason and the weather reason to be short at that time of year is not compelling enough.............even though the weather in March and April can ADD to the bullish seasonals and give you MORE reason to be long.
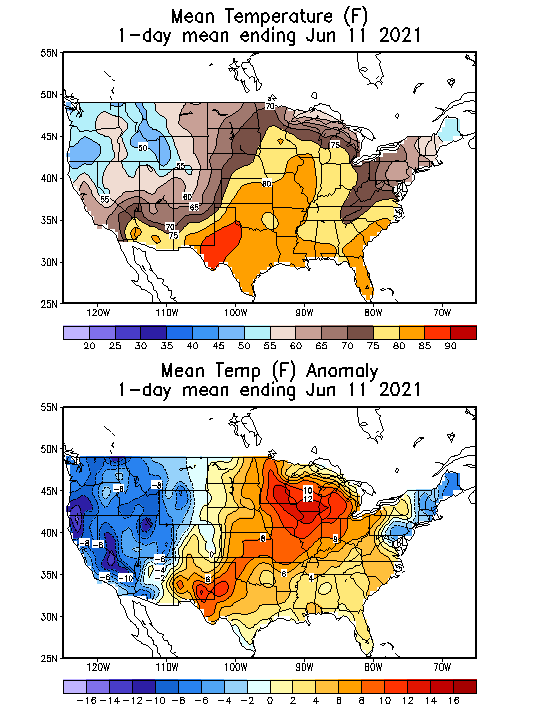
7 day temps for this Thursdays EIA number: Extreme heat in the Southwest to Plains to Western Midwest. A bit cool Northeast to Mid Atlantic(where alot of people live)
metmike: Big heat ridge coming in early July...BULLISH
Natural gas futures continued higher in early trading Wednesday as analysts pointed to data showing lagging production and recovering export volumes. The July Nymex contract was up 5.7 cents to $3.315/MMBtu at around 8:50 a.m. ET. Heading into Wednesday’s session there was “very little change” in the temperature outlook compared to 24 hours prior, according…
metmike: The explanations for the price spike higher are non weather. Some of the models look very impressive with a heat ridge in the center of the country in early July.
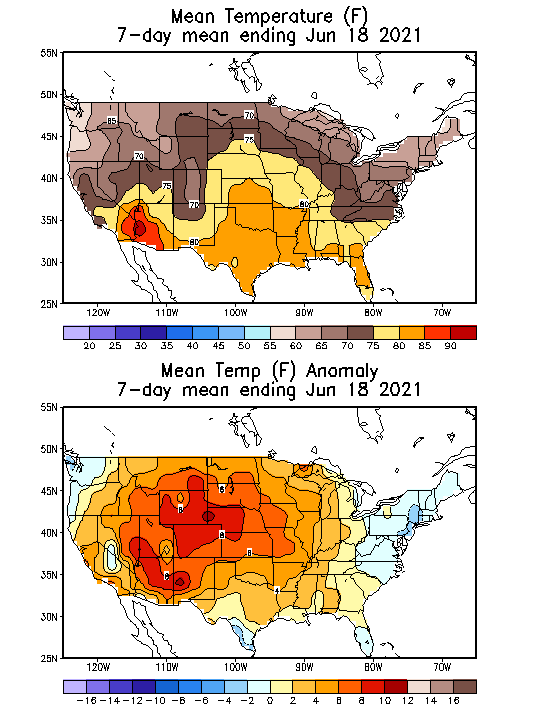
The greatest temp anomalies would first be out west, then track east to the northern parts of the country, similar to the previous extreme heat, with the Southeast not participating in the extreme part of the heat.
![]()
‹ See All Natural Gas Reports https://ir.eia.gov/ngs/ngs.html
for week ending June 18, 2021 | Released: June 24, 2021 at 10:30 a.m. | Next Release: July 1, 2021
+55 BCF BULLISH!
| Working gas in underground storage, Lower 48 states Summary text CSV JSN | |||||||||||||||||||||||||
|---|---|---|---|---|---|---|---|---|---|---|---|---|---|---|---|---|---|---|---|---|---|---|---|---|---|
| Historical Comparisons | |||||||||||||||||||||||||
| Stocks billion cubic feet (Bcf) | Year ago (06/18/20) | 5-year average (2016-20) | |||||||||||||||||||||||
| Region | 06/18/21 | 06/11/21 | net change | implied flow | Bcf | % change | Bcf | % change | |||||||||||||||||
| East | 488 | 461 | 27 | 27 | 614 | -20.5 | 530 | -7.9 | |||||||||||||||||
| Midwest | 595 | 570 | 25 | 25 | 712 | -16.4 | 607 | -2.0 | |||||||||||||||||
| Mountain | 169 | 165 | 4 | 4 | 164 | 3.0 | 159 | 6.3 | |||||||||||||||||
| Pacific | 239 | 236 | 3 | 3 | 298 | -19.8 | 277 | -13.7 | |||||||||||||||||
| South Central | 991 | 995 | -4 | -4 | 1,206 | -17.8 | 1,063 | -6.8 | |||||||||||||||||
| Salt | 295 | 299 | -4 | -4 | 370 | -20.3 | 319 | -7.5 | |||||||||||||||||
| Nonsalt | 697 | 696 | 1 | 1 | 836 | -16.6 | 744 | -6.3 | |||||||||||||||||
| Total | 2,482 | 2,427 | 55 | 55 | 2,995 | -17.1 | 2,636 | -5.8 | |||||||||||||||||
Totals may not equal sum of components because of independent rounding. | |||||||||||||||||||||||||
Working gas in storage was 2,482 Bcf as of Friday, June 18, 2021, according to EIA estimates. This represents a net increase of 55 Bcf from the previous week. Stocks were 513 Bcf less than last year at this time and 154 Bcf below the five-year average of 2,636 Bcf. At 2,482 Bcf, total working gas is within the five-year historical range.
For information on sampling error in this report, see Estimated Measures of Sampling Variability table below.
Note: The shaded area indicates the range between the historical minimum and maximum values for the weekly series from 2016 through 2020. The dashed vertical lines indicate current and year-ago weekly periods.
https://www.investing.com/economic-calendar/natural-gas-storage-386
Latest Release Jun 24, 2021 Actual55B Forecast66B Previous16B
| Release Date | Time | Actual | Forecast | Previous | |
|---|---|---|---|---|---|
| Jun 24, 2021 | 10:30 | 55B | 66B | 16B | |
| Jun 17, 2021 | 10:30 | 16B | 72B | 98B | |
| Jun 10, 2021 | 10:30 | 98B | 98B | 98B | |
| Jun 03, 2021 | 10:30 | 98B | 95B | 115B | |
| May 27, 2021 | 10:30 | 115B | 104B | 71B | |
| May 20, 2021 | 10:30 | 71B | 60B | 71B | |
| May 13, 2021 | 10:30 | 71B | 76B | 60B | |
| May 06, 2021 | 10:30 | 60B | 64B | 15B | |
| Apr 29, 2021 | 10:30 | 15B | 11B | 38B | |
| Apr 22, 2021 | 10:30 | 38B | 49B | 61B | |
| Apr 15, 2021 | 10:30 | 61B | 67B | 20B | |
| Apr 08, 2021 | 10:30 | 20B | 21B | 14B |
+++++++++++++++
What do you think Larry....others?
Solidly bullish vs expectations as it missed WSJ by -12! The last time it missed that much or more to the bullish side was way back in January.
Now, based on my own perspective, I still have the Memorial Day +98 as even more bullish than today's +55.
Thanks Larry.
I think that I have noticed that when we have extreme heat and cold during the 7 day reporting period, there are more bullish surprises than what the rate is during other reporting weeks.
Do your stats support this?
Mike,
I haven't compiled anything like that to be able to tell. So, I don't know if that's true or false.
Front month July expires today.
July natural gas futures charged like a lion Monday, surging 12.1 cents from Friday’s levels as a historic heat wave continued to smother the Pacific Northwest, leading to pipeline issues and amplified demand. Notable heat also blanketed the East Coast, and with forecasts pointing to more hot weather ahead, the July Nymex contract extended its…
Down almost 20 cents from the high today and lucky to close in the green. That's a crazy turn around.
metmike: Prices have been MUCH stronger the last week than I would have guessed. The weather has been bullish out West but bearish in the Midwest/East where temperatures count the most.
7 day temps, ending last Friday for Thursday mornings EIA report released at 9:30am.
Bullish out west but a bit bearish/coolish for the season from the Upper Midwest to Southeast that typically counts more(because more people live there):. Recent EIA reports have been bullish( injections on the small side)
EIA report.................BEARISH!
https://www.investing.com/economic-calendar/natural-gas-storage-386
Latest Release Jul 01, 2021 Actual 76B Forecast 68B Previous 55B
| Release Date | Time | Actual | Forecast | Previous | |
|---|---|---|---|---|---|
| Jul 01, 2021 | 10:30 | 76B | 68B | 55B | |
| Jun 24, 2021 | 10:30 | 55B | 66B | 16B | |
| Jun 17, 2021 | 10:30 | 16B | 72B | 98B | |
| Jun 10, 2021 | 10:30 | 98B | 98B | 98B | |
| Jun 03, 2021 | 10:30 | 98B | 95B | 115B | |
| May 27, 2021 | 10:30 | 115B | 104B | 71B |
![]()
‹ See All Natural Gas Reports https://ir.eia.gov/ngs/ngs.html
for week ending June 25, 2021 | Released: July 1, 2021 at 10:30 a.m. | Next Release: July 8, 2021
+76 BCF BEARISH!!
| Working gas in underground storage, Lower 48 states Summary text CSV JSN | |||||||||||||||||||||||||
|---|---|---|---|---|---|---|---|---|---|---|---|---|---|---|---|---|---|---|---|---|---|---|---|---|---|
| Historical Comparisons | |||||||||||||||||||||||||
| Stocks billion cubic feet (Bcf) | Year ago (06/25/20) | 5-year average (2016-20) | |||||||||||||||||||||||
| Region | 06/25/21 | 06/18/21 | net change | implied flow | Bcf | % change | Bcf | % change | |||||||||||||||||
| East | 513 | 488 | 25 | 25 | 636 | -19.3 | 555 | -7.6 | |||||||||||||||||
| Midwest | 623 | 595 | 28 | 28 | 737 | -15.5 | 631 | -1.3 | |||||||||||||||||
| Mountain | 173 | 169 | 4 | 4 | 172 | 0.6 | 164 | 5.5 | |||||||||||||||||
| Pacific | 244 | 239 | 5 | 5 | 303 | -19.5 | 281 | -13.2 | |||||||||||||||||
| South Central | 1,005 | 991 | 14 | 14 | 1,221 | -17.7 | 1,070 | -6.1 | |||||||||||||||||
| Salt | 296 | 295 | 1 | 1 | 369 | -19.8 | 315 | -6.0 | |||||||||||||||||
| Nonsalt | 709 | 697 | 12 | 12 | 852 | -16.8 | 755 | -6.1 | |||||||||||||||||
| Total | 2,558 | 2,482 | 76 | 76 | 3,068 | -16.6 | 2,701 | -5.3 | |||||||||||||||||
Totals may not equal sum of components because of independent rounding. | |||||||||||||||||||||||||
Working gas in storage was 2,558 Bcf as of Friday, June 25, 2021, according to EIA estimates. This represents a net increase of 76 Bcf from the previous week. Stocks were 510 Bcf less than last year at this time and 143 Bcf below the five-year average of 2,701 Bcf. At 2,558 Bcf, total working gas is within the five-year historical range.
For information on sampling error in this report, see Estimated Measures of Sampling Variability table below.
Note: The shaded area indicates the range between the historical minimum and maximum values for the weekly series from 2016 through 2020. The dashed vertical lines indicate current and year-ago weekly periods.
The Energy Information Administration (EIA) launched a “bear bomb” on the natural gas market Thursday, reporting a much larger-than-expected 76 Bcf injection into storage for the week ending June 25. The EIA figure was slightly outside the range of expectations in major surveys and 3 Bcf above last year’s build for the similar period. The…
metmike: Even after this, natural gas is back to higher. It's been relentless! Pretty impressive heat across the Northern 1/3rd of the country coming up but the south does not participate in the heat waves.........which is usually needed to maximize the bullishness in July.
Friday AM, metmike: Weather models all got COOLER overnight. This put severe pressure on ng overnight to early am and we hit a bottom just below 3.6 after 7am................but here we are higher again at Noon! Relentlessly upward in recent weeks.