From Natural Gas Intelligence:
August Natural Gas Called Higher as Forecasts Trend Hotter for Mid-July
8:57 AM
August natural gas futures were set to open Thursday about a penny higher at around $2.880/MMBtu as forecasters over the Independence Day holiday noted warmer changes to the outlook for mid-July.
For the weather effecting natural gas(temperatures that determine AC use) see here:
https://www.marketforum.com/forum/topic/6893/
for week ending June 22, 2018 | Released: June 28, 2018 at 10:30 a.m. | Next Release: July 6, 2018
| Working gas in underground storage, Lower 48 states Summary textCSVJSN | |||||||||||||||||||||||||
|---|---|---|---|---|---|---|---|---|---|---|---|---|---|---|---|---|---|---|---|---|---|---|---|---|---|
| Historical Comparisons | |||||||||||||||||||||||||
| Stocks billion cubic feet (Bcf) | Year ago (06/22/17) | 5-year average (2013-17) | |||||||||||||||||||||||
| Region | 06/22/18 | 06/15/18 | net change | implied flow | Bcf | % change | Bcf | % change | |||||||||||||||||
| East | 430 | 406 | 24 | 24 | 533 | -19.3 | 543 | -20.8 | |||||||||||||||||
| Midwest | 425 | 401 | 24 | 24 | 673 | -36.8 | 586 | -27.5 | |||||||||||||||||
| Mountain | 133 | 127 | 6 | 6 | 184 | -27.7 | 159 | -16.4 | |||||||||||||||||
| Pacific | 251 | 246 | 5 | 5 | 280 | -10.4 | 299 | -16.1 | |||||||||||||||||
| South Central | 835 | 828 | R | 7 | 7 | 1,140 | -26.8 | 988 | -15.5 | ||||||||||||||||
| Salt | 252 | 258 | -6 | -6 | 341 | -26.1 | 289 | -12.8 | |||||||||||||||||
| Nonsalt | 583 | 570 | R | 13 | 13 | 798 | -26.9 | 699 | -16.6 | ||||||||||||||||
| Total | 2,074 | 2,008 | R | 66 | 66 | 2,809 | -26.2 | 2,575 | -19.5 | ||||||||||||||||
| R=Revised. | |||||||||||||||||||||||||
****The reported revision caused the stocks for June 15, 2018, to change from 2,004 Bcf to 2,008 Bcf. As a result, the implied net change between the weeks ending June 08 and June 15 changed from 91 Bcf to 95 Bcf.
The period below and temperatures was used for the weekly EIA number released last Thursday at 9:30am CDT:
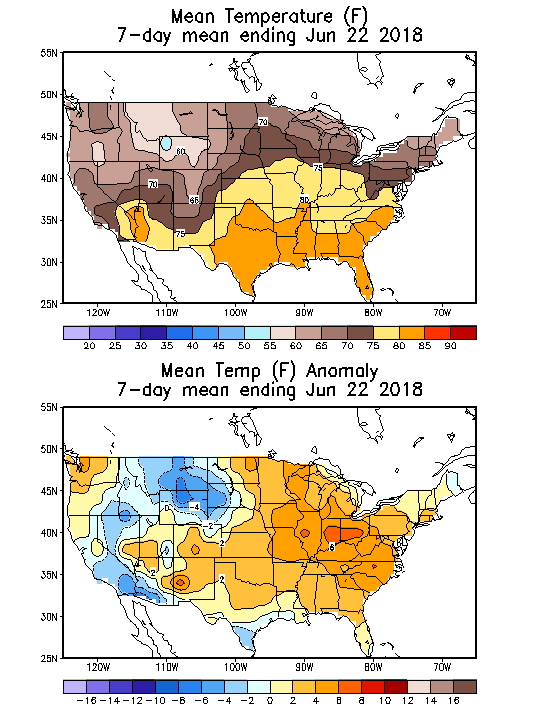
These are the temperatures that occurred during the 7 day period that will be used for the upcoming EIA report released tomorrow:
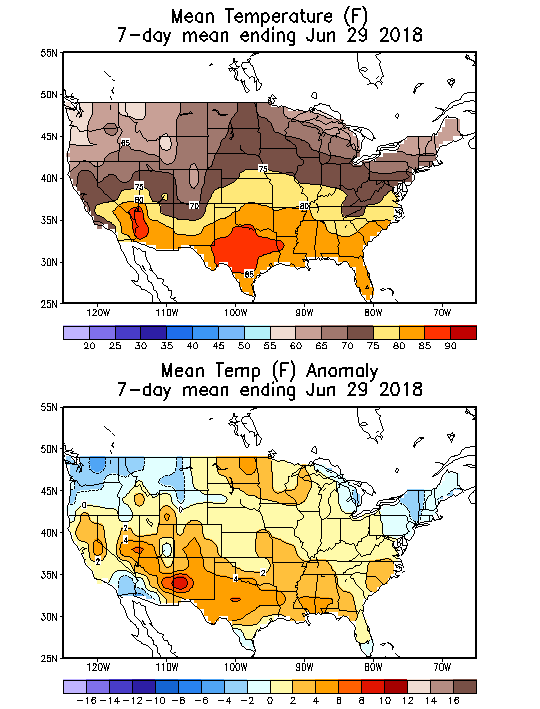
Looking ahead to the 7 day period used for next Thursdays(7-12) report. The temp period runs thru tomorrow(7-7).
We only have part of it below......but its been a HOT one, so the injection will be a SMALL one next week.
Below, its broken down to the highs/lows.
Mike,
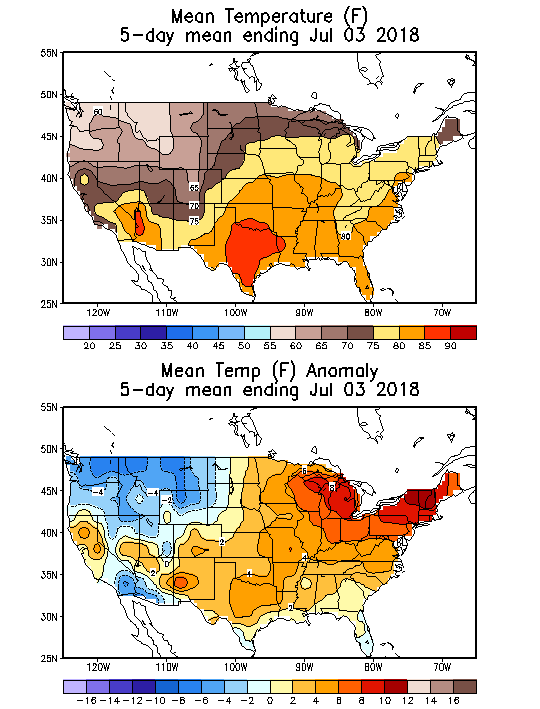
The 7 days ending today will be about the same as the 5 day map ending 7/3 that you posted. That means NYC/Boston/Phil corridor will end up being about 10 F warmer than the prior week. The Cincinnati/Chicago/MinnSP area and much of the Midwest will end up 5-6 F warmer. The weighted US average CDD should come out in the vicinity of 25-30 higher this EIA week vs the prior EIA week. That could easily amount to a 40ish lower injection vs tomorrow’s report.
Edit: However, I almost forgot to adjust demand downward due to the holiday week. When that is taken into account, it would probably mean more like a 25 bcf lower injection rather than 40 bcf lower. So, perhaps +50ish?
Mike,
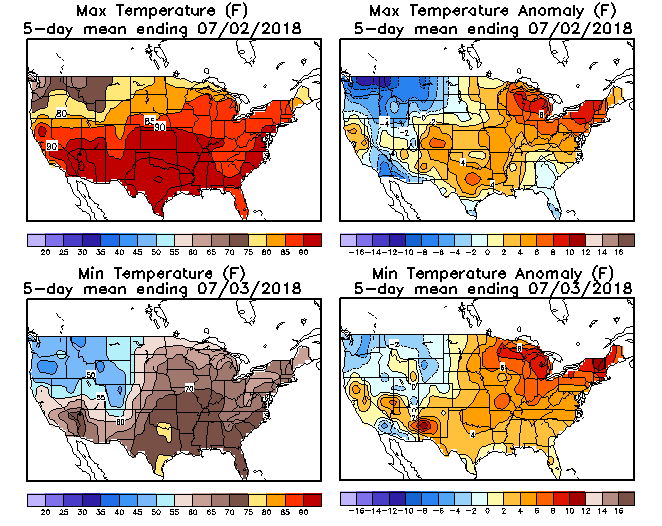
I just noticed something funky about those 5 day average maps ending 7/3/18. That has Chicago with a mean cooler than 80, an average max under 90, and an average min below 70. The actual data is warmer as it has a mean of 82, an average max of 92, and an average min of 72. The map also has an average anomaly of +7 vs it actually having been +9. I didn’t have a chance to check other cities at least yet. I did also check the 7 day’s ending 6/29, however. The map suggests low 70s vs the actual of 75. So, it looks as if there may be a cool bias with the data going into those maps at least at Chicago. But the data is still useful as it allows the trends to be identified.
That's strange. I wonder what's going on Larry.
This is the source of the maps:
http://www.cpc.ncep.noaa.gov/products/tanal/temp_analyses.php
Is it possible that the data is displaced by 1 day?
From Natural Gas Intelligence:
Natural Gas Futures Slide Despite Heat as SoCal Citygate Spot Prices Soar
5:20 PM
"Natural gas futures slid Thursday as production concerns and some anticipated cooling in the Northeast sent prices lower, despite a generally bullish forecast for the next two weeks. In the spot market, projected triple-digit heat sent SoCal Citygate prices spiking, while East Coast points fell on cooler temperatures ahead; the NGI National Spot Gas Averageadded 2 cents to $2.72/MMBtu. "
Is the market possibly expecting a bearish EIA number tomorrow?
Seasonally/historically, late June thru mid July is often very weak for ng prices.

Larry,
I know that you will disagree with this as a reason but the week 3 and 4 temperature forecast today was the coolest its been in a couple of months.

One other item. We just had record smashing heat in the Northeast.......extremely bullish. Is it possible that upcoming heat, of a not as extreme brand is LESS bullish?
Mike,
We’ll obviously never know for sure but I do know that the 2 week models were mixed this morning and that the holiday being in the middle of the week likely added to extra volatility and unpredictability. The forecast I saw for this morning wasn’t warmer than it was on Tuesday but rather it was about unchanged for the two weeks overall. So, based on that, the 2 weeks of heat should have already been dialed in. What’s interesting is that NG still rose about 4.5 cents this morning to daily highs near 2.885. Why did it do this? Maybe this was short covering driven after recent drops? The starting point this morning was near 2.840 (i.e., already down as it had fallen in thin trading on 7/4). Then it came back down those same 4.5 cents later in the morning.
So, NG was back to its early morning starting point. (I will note that the 6Z GFS was quite a bit cooler fwiw though who knows if that was a factor). Then the 12Z GFS was also a cooler run similar to the 6Z. Also, the 12Z Euro was cooler. NG ended up near 2.830, which is only about 1 cent lower than its early AM starting point on a day with not much change in the AM forecast and with cooler 12Z GFS/Euro to boot. My point is that I think it is a coincidence that both the CFS was cooler and NG was down for the reasons I just gave and because the CFS isn’t reliable at all (the overall market knows that). IF wx is going to be a major factor during any part of any one day, it almost always will be changes in the 2 week forecast. If there were, say, vs the prior day good consensus of significant warmer changes in the morning runs of the somewhat reliable 2 week models, the 12Zs agreed, the CFS was cooler, and there were no nonwx factors driving the market that day such as the weekly EIA, the market will end the day higher than it started early that morning the vast majority of the time as it knows that the likelihood of a 2 week period of warmer wx will easily trump a near shot in the dark guess for the subsequent 2 weeks. For similar reasons, if the first 14 days consensus overall are significantly warmer (cooler) but just the 360 hour map is significantly cooler (warmer), the market is the strong majority of the time going to be up (down) IF wx is the main factor that morning. A day 15 map will normally not trump opposite trends for the prior 14 days. Not only are the prior 14 days overall much more reliable to forecast, but we’re talking about a long enough period (14 days) that wouldn’t make sense to ignore.
Edit: I just saw your comment about whether or not the data could be displaced one day and thus cause the data discrepancy. I considered that but still couldn’t get the maps and actual data to jibe for Chicago.