That is the main threat now to the new crop!
It will slow planting down in the north to a halt.
These graphics below are updated every day, So you can go to this page and they will all be updated automatically.
Rains in the southern and eastern belt have or will slow planting there.
Current Conditions below updated every few minutes.
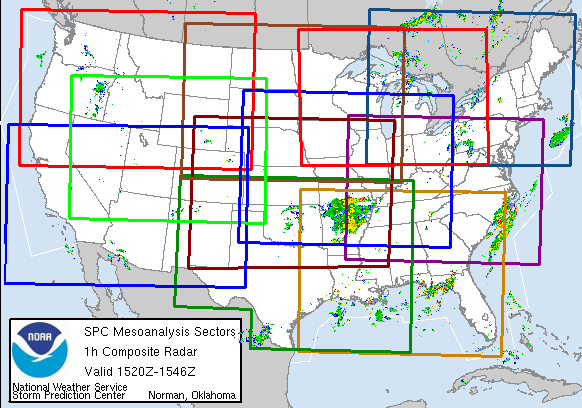
https://www.spc.noaa.gov/exper/mesoanalysis/new/viewsector.php?sector=13#


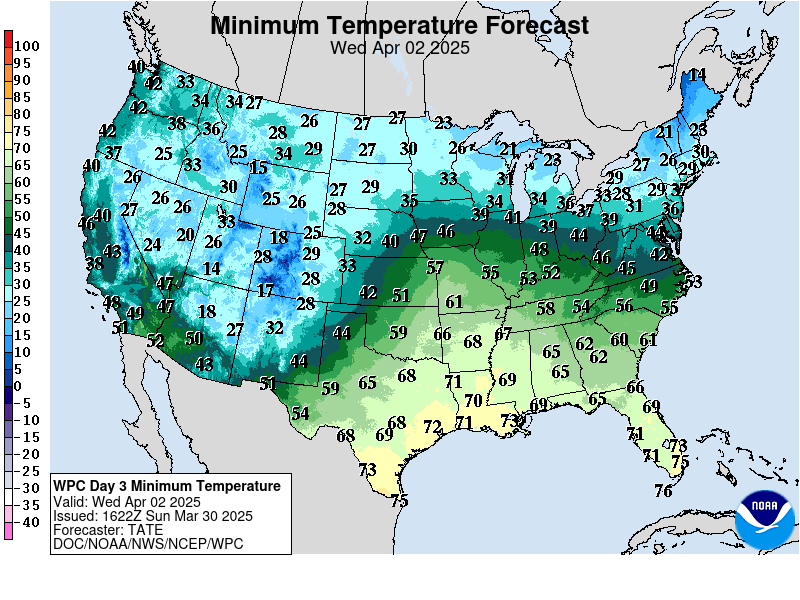
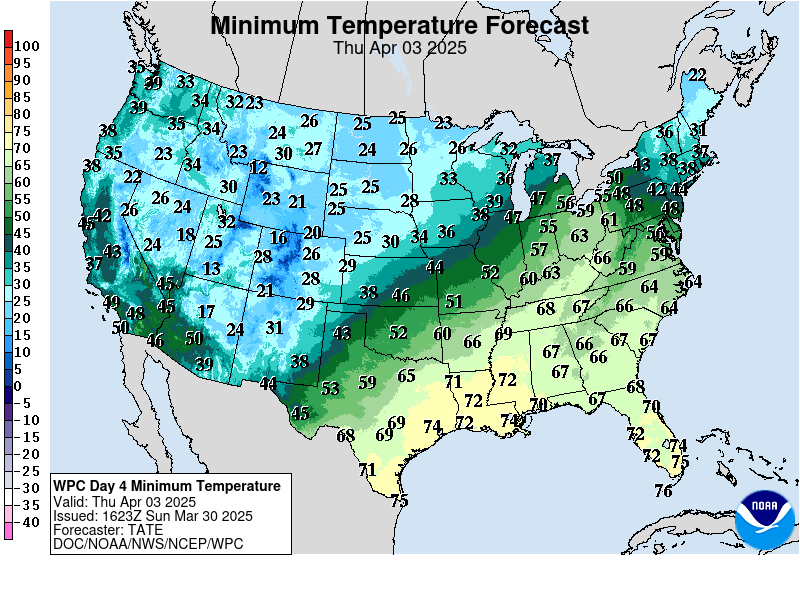
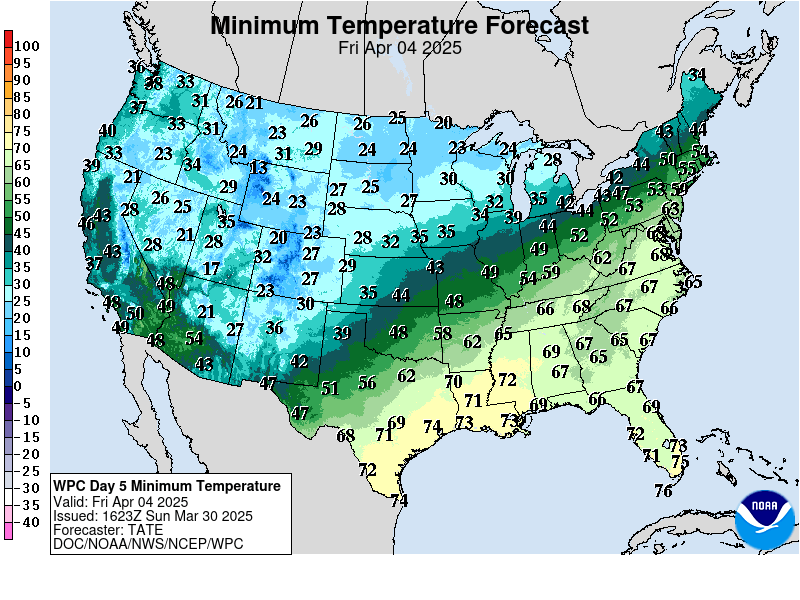
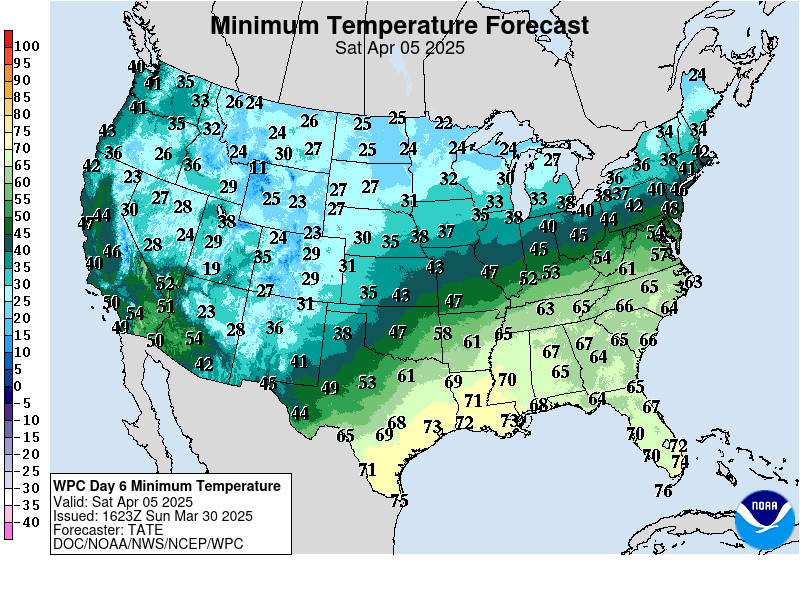
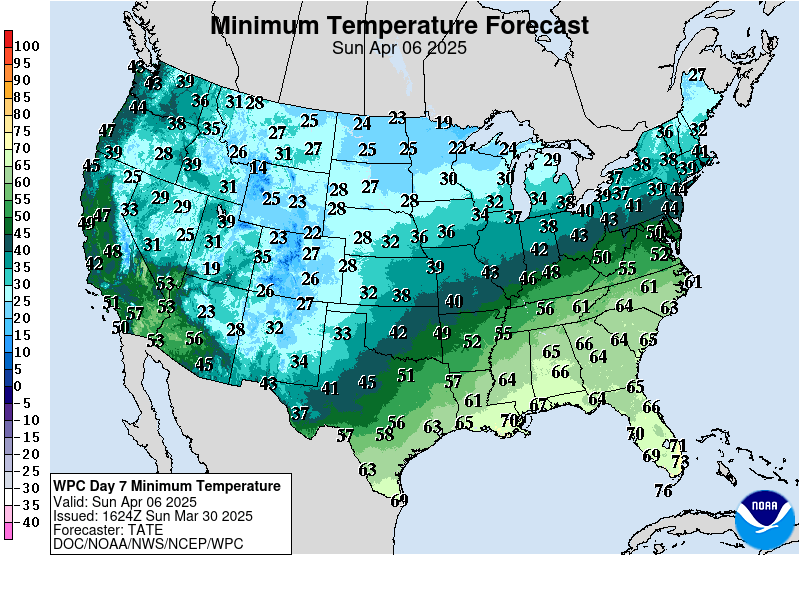
Lows days 3-7 below:
https://www.wpc.ncep.noaa.gov/medr/medr_min.shtml
The latest rain forecasts are below.
Day 1 below:
http://www.wpc.ncep.noaa.gov/qpf/fill_94qwbg.gif?1526306199054

Day 2 below:
http://www.wpc.ncep.noaa.gov/qpf/fill_98qwbg.gif?1528293750112

Day 3 below:
http://www.wpc.ncep.noaa.gov/qpf/fill_99qwbg.gif?1528293842764

Days 4-5 below:
http://www.wpc.ncep.noaa.gov/qpf/95ep48iwbg_fill.gif?1526306162

Days 6-7 below:
http://www.wpc.ncep.noaa.gov/qpf/97ep48iwbg_fill.gif?1526306162

7 Day Total precipitation below:
http://www.wpc.ncep.noaa.govcdx /qpf/p168i.gif?1530796126

+++++++++++++++++++++++++++++++++
Excessive rain threat.
Current Day 1 Forecast
Day 1 Threat Area in Text Format
Current Day 2 Forecast |

++++++++++++++++++++++++++++++++++++++++++++++++++++++++++
Severe Storm Risk.
https://www.spc.noaa.gov/products/outlook/
Current Day 1 Outlook | |
Current Day 2 Outlook | |
Current Day 3 Outlook | |
Current Day 4-8 Outlook |
Extended weather.......pretty wet in many places!
https://www.cpc.ncep.noaa.gov/products/predictions/610day/ | |||||||||
| 6 to 10 day outlooks | |||||||||
| Click below for information about how to read 6-10 day outlook maps Temperature Precipitation | |||||||||
| Click below for archives of past outlooks (data & graphics), historical analogs to todays forecast, and other formats of the 6-10 day outlooks ArchivesAnalogsLines-Only FormatGIS Data | |||||||||
Temperature Probability | |||||||||
Precipitation Probability | |||||||||
New crop corn, beans and wheat are worried about the near record cold with possible frost or freezing temps in the northern tier, where some places planted early and the crop is emerged and vulnerable.
Also some heavy rains in the southern belt.
See the latest forecasts by scrolling up.
I’ve also read in a couple places that the dryness is becoming a real problem in SA. The prices for coffee and sugar today seem to support that. Projections for the corn crop are falling daily in SA.
Thanks Jim!
South America weather May
Started by metmike - May 6, 2021, 5:09 p.m.
This product has low skill but the natural gas market is looking at potential heat in late May, which would be bullish
Week 3 and 4 below......late May/early June.


Soilmoisture anomaly:
These maps sometimes take a day to catch up to incorporate the latest data(the bottom map is only updated once a week).
https://www.cpc.ncep.noaa.gov/products/Soilmst_Monitoring/US/Soilmst/Soilmst.shtml#
![]()


Top map was this week. 2nd map was last week.
Drought got a bit worse in Iowa but with chilly temps, there wasn't much drying this week.
https://droughtmonitor.unl.edu/Maps/CompareTwoWeeks.aspx


The cool temps are a blessing when we are this dry so early. Here in NW Iowa there are beans up, I have yet to start beans.
The first of the corn is up, that was planted before the last snow, very good stands.
“Floppy corn” can be a thing if the topsoil doesn’t get some moisture soon.
The cool temps are a blessing when we are this dry so early
Thanks mcfarmer! That's exactly what I stated at the top of the drought moniter page above!
A huge thanks for giving us your take on whats actually happening in your neck of the woods.
As cutworm noted several months ago, the wonderful NWS national radar images were replaced with horrible, almost worthless products. Not sure why.
This link below provides some great data. Hit the center of the box below for the area that you want, then go to observation on the far left, then surface observations to get constantly updated surface observations. Let us know how much rain you got/get!
 |
Soil temperatures have been slowly falling in IA the last week but are still above 50 and will be warming up later next week:
https://mesonet.agron.iastate.edu/timemachine/#57.202105070000

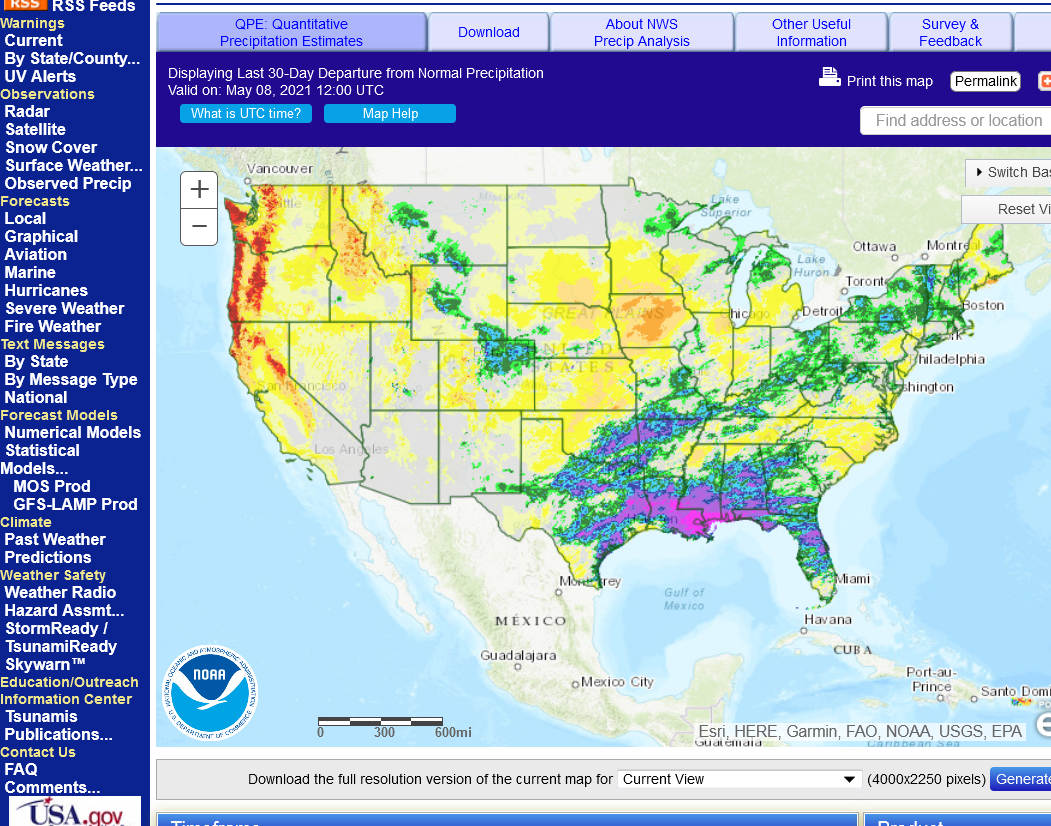
It's been very dry in IA as you mentioned. This is the % normal precip the last 30 days.
https://water.weather.gov/precip/
Mike, do they still use bare soil to measure soil temperatures ? I imagine they do, that would be the only way to be consistent.
Modern farming practices most likely subtract a few degrees off those readings I imagine. The rains we got yesterday were light and they were cold, with air temperatures in the mid forties.
mcfarmer,
Yes and at different depths. The one that I show is at 4 inches that is best for planting considerations. Use this link below. You can go back to see any previous date. Temps DROPPED as you might guess from yesterday.
https://mesonet.agron.iastate.edu/timemachine/#57.202105080000

The weather forecast has turned decidedly bearish.
Rains coming up the next 2 weeks predicted to dump on the driest areas(but maybe not much for driest, ND?).
Temps to finally warm up nicely.
Also, its getting pretty late for rains to matter that much in Brazil for their 2nd corn crop.
Heaviest rains don’t quite hit the driest areas but drought relief is on the way in less than a week with much warmer temps.
ND could get massive drought relief. This is crushing the Spring wheat today.
Potential for excessive rains in the sw belt to the S.Plains.

Welcome rains the past week:
.png)
Rain forecast for 2 weeks from the just out Euro Ensemble
https://www.marketforum.com/forum/topic/69194/#69247
Re: Re: Turn-around Tuesday or—
By metmike - May 11, 2021, 11:12 a.m.
Great call stomper on the markets turning around today! I didn't think that we would be this strong.
Several things going on today with some hefty cross currents.
1. The old crop supply running out is not going to be solved until the new crop hits the market and so the front months are still a rationing market(requiring high prices to ration out excessive demand for limited supplies).
2. There's a USDA report out tomorrow thats expected to be bullish.
3. The weather is still bearish overall and you can see that in the spreads. The new crop last week was leading from bullish weather but its a huge drag this week, especially today.
4. The specific weather model solutions are not entirely bearish now either. The pattern coming up is a bit tricky because of a zone of extreme rains that may develop in the south. Excessive rains are not good, especially falling in areas that don't need rain that much, some have been too wet this Spring. What that often does, especially with the pattern being caused by a building ridge in a location that causes the storms to weaken, headed into the building ridge is that those storms could set up a zone of excessive rains that actually blocks the moisture and rains from getting farther north. So then, too much rain falls where they don't need it and the areas farther north get short changed. I'm not saying at all that's why we are higher today but its an underlying consideration for resolving future weather interpretations by the market in deciding if this pattern is bullish or bearish for new crop prices.
++++++++++++++++++++++++++++
Re: Re: Turn-around Tuesday or—
By metmike - May 11, 2021, 11:20 a.m.
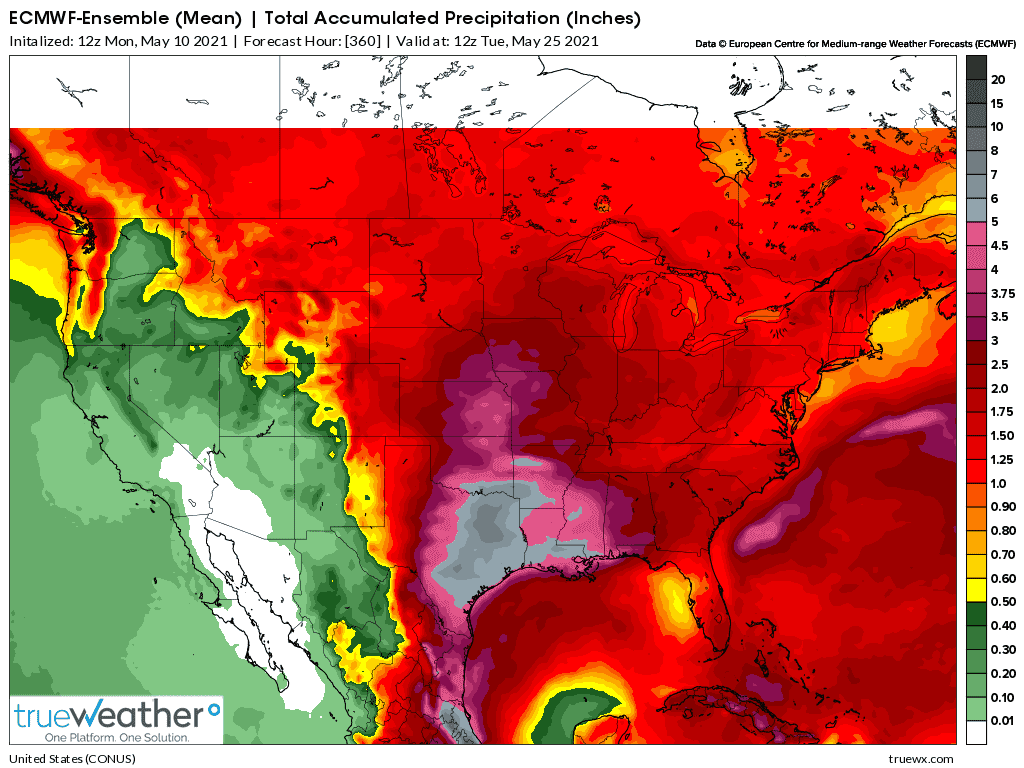
This was the early morning solution of the European Ensemble model for total rains the next 2 weeks.
Note the 5+ inches in the South/Central US............too much rain.........same place that was shown yesterday but slightly farther south. Rain amounts peter out quickly headed northeast and in fact, by the time we get to the Eastern cornbelt, amounts have really tapered off.
Farther north, in ND, where the worst drought is, they are almost completely cut off from the dynamics generating the storms(based on what some models, like this one think).
Other models, using teleconnections and analogs, suggests the Northern Plains will actually be very wet..............but they can't dial in the sort of affects that I mentioned on the previous page and here.
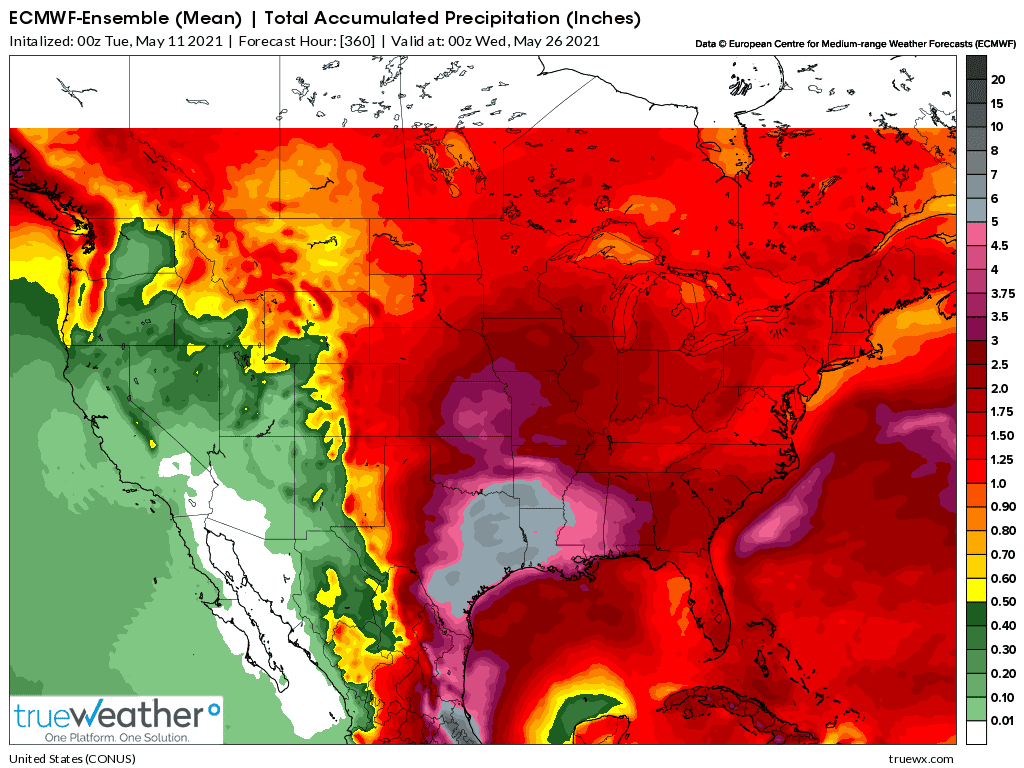
This was the latest European ensemble solution for 2 week rains. Still a boat load of rain, 5"+ in the SouthCentral US.
Ever wonder what a weather model ensemble is?
The answer is on the next page.

The ensemble average is the average of 50 different members/solutions of that model with each solution featuring just a slight change in an important parameter that we use to represent the physics of the atmosphere(represented by mathematical equations).
It would be like having 50 different doctors giving their opinion to a very puzzling/challenging condition of a patient that had tons of complicating dynamics that would quickly evolve/advance/multiply every day.
So being wrong on day 5 with this patients diagnosis, would mean that they would be dead a few days after that. Out of the 50 doctors, there will usually be several that cure the patient but you never know which ones.
Turns out, that when you average all of the opinions together, even though it might not be as good as the best of the 50, most of the time, because you can never know which one is best...........it's always a different one........ in the long run, when you average all 50 together, the product will beat any one of them when you score the accuracy over more than just a few days. This is the ensemble.
By a wide margin, its the most stable. Individual solutions can go from one extreme to another because they latch on to a piece of bad info. The 50 ensemble average always washes out the extremes and shows the strong features that the majority agree on.
Here is an example....with the 50 different ensembles that went into the European model ensemble average from the previous page.
Sometimes though, the ensemble average can mess you up if you don't look at the individual members too.
Let's say, for instance that a particular location on the map had 2.5 inches of rain forecast from the average.
Is that the most likely outcome?
Normally, but only if the majority of members had something close to that.
But what if 25 ensembles had 5 inches of rain there and 25 had no rain there?(extreme example to make a point).
None of them would have 2.5 inches. It's much more likely that this location will have closer to 5 inches or no rain than to have 2.5 inches based on what the models are saying.
The meteorologist at that point, could use pattern recognition to decide which solution/group made the most sense and lean strong in that direction...........give it the greatest weight. So it more than just the average but how many members line up with that average that matters.
Often, we might just split the difference but the best meteorologists at synoptic analysis forecasting can beat the models like a drum in certain situations.
With the incredible technology and numerical guidance/support the last 2 decades, I've noticed that we don't have many in that category any more.
They will just go with whatever numbers the guidance spits out, rather than spend a couple of hours trying to fine tune the forecast to improve it slightly using somewhat speculative but educated intuition based alot on unique skills that they know will sometimes be wrong.......and in a couple of days............it will be on to the next forecast and hundreds more like it the rest of the year.
So I'm going to apply the forecasting philosophy using the above principles to the current weather pattern.
The ensemble average has massive agreement where the really heavy rains will be. This is extremely high confidence. But in the Eastern Cornbelt, they are all over the place. A few have very heavy rains but around 18 of the 50 solutions have a decent pocket of .5 inches or less, which is very dry for 2 week totals.
The few with 5 inches for that area, bring the average up but there are enough with the lower amounts to be on the look out for signs that late May could actually dry out in the far Eastern Cornbelt, despite what much of the guidance says is going to be a wet pattern.
We must ALWAYS note that even if you have done the worlds best job at analyzing what the models are all saying and theoretically, should have the best forecast...........it's a weather model based on a chaotic, changing environment and the best foreasters are the ones that can admit when they are WRONG the fastest, so that they can adjust the forecast to dial in the latest data immediately.
Stubborn forecasters using yesterdays forecast philosophy and looking for reasons to be right and don't want to believe they are wrong, when the data is telling them they are......will have inferior forecasting products compared to a peer with similar knowledge.........but is looking for reasons to be wrong, finding them and making the right adjustments IMMEDIATELY.
This especially applies in the field of climate right now........where scientists never have to reconcile their model forecasts with reality.
The extreme forecasts going out 50+ years, for instance will happen after most of them are dead.
Less threat for excessive rains far SouthCentral area on the European model early this morning. Rains go a bit farther north as a result.
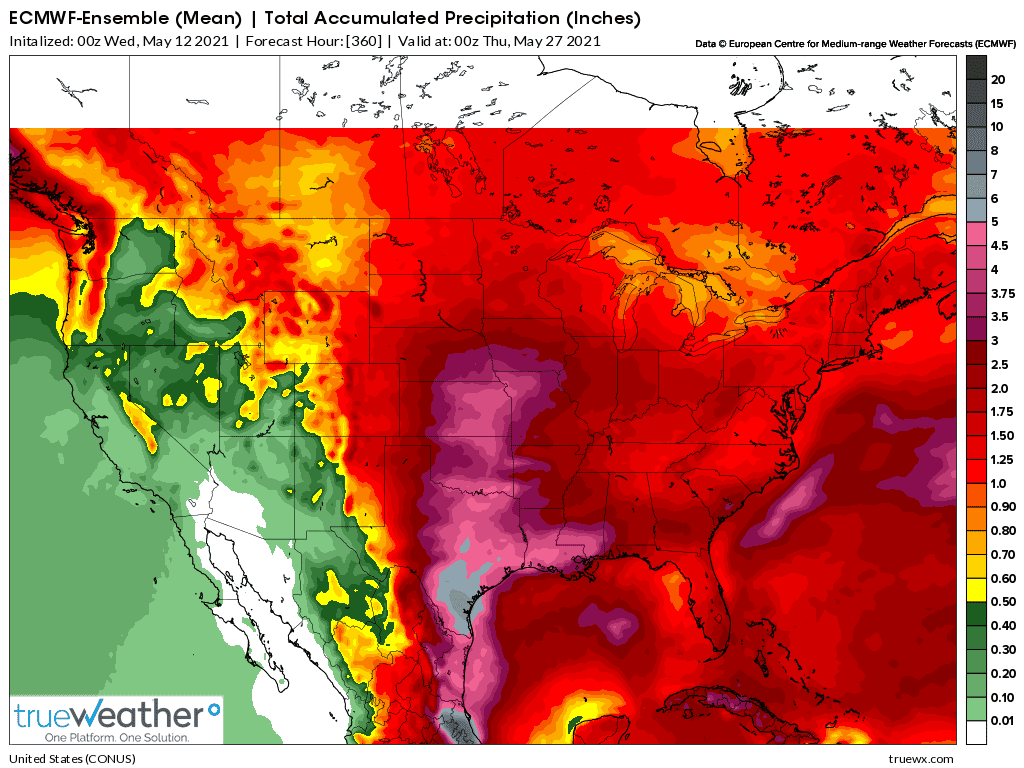
The 12z GFS ensemble was really ramping up the 2 week total rain amounts in the heaviest areas.
European model is alot different than the GFS
Weather continues to be bearish.
The EE has much less rain in the Eastern Cornbelt especially the NE Cornbelt than the GFS. The GFS has a ton of it going east. Both models have a great deal of rain overall.....except for ND, which may get short changed....
And possibly parts of the ECB on the EE.
Huge rains southern plains to southern corn belt .....they will be drying up as they head north and northeast.
GFS has tons of rain still making it to most places. European models short changes the north and northeast cornbelt.
I’ll try to start a new weather thread soon. You can scroll up to many of the maps that get updated everyday or even more frequently.


