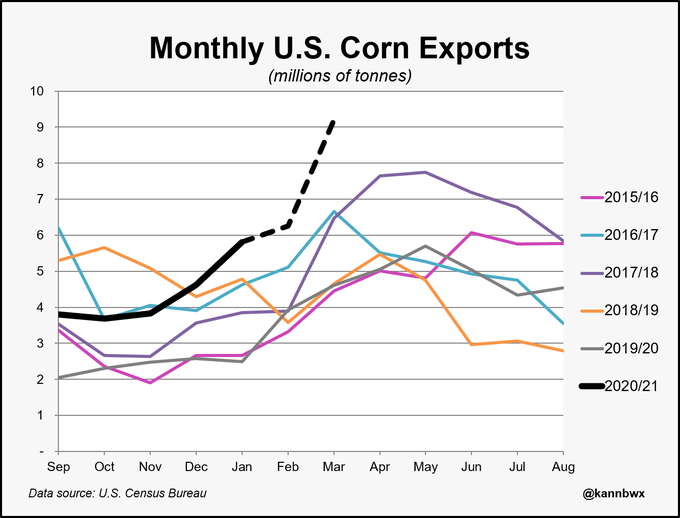
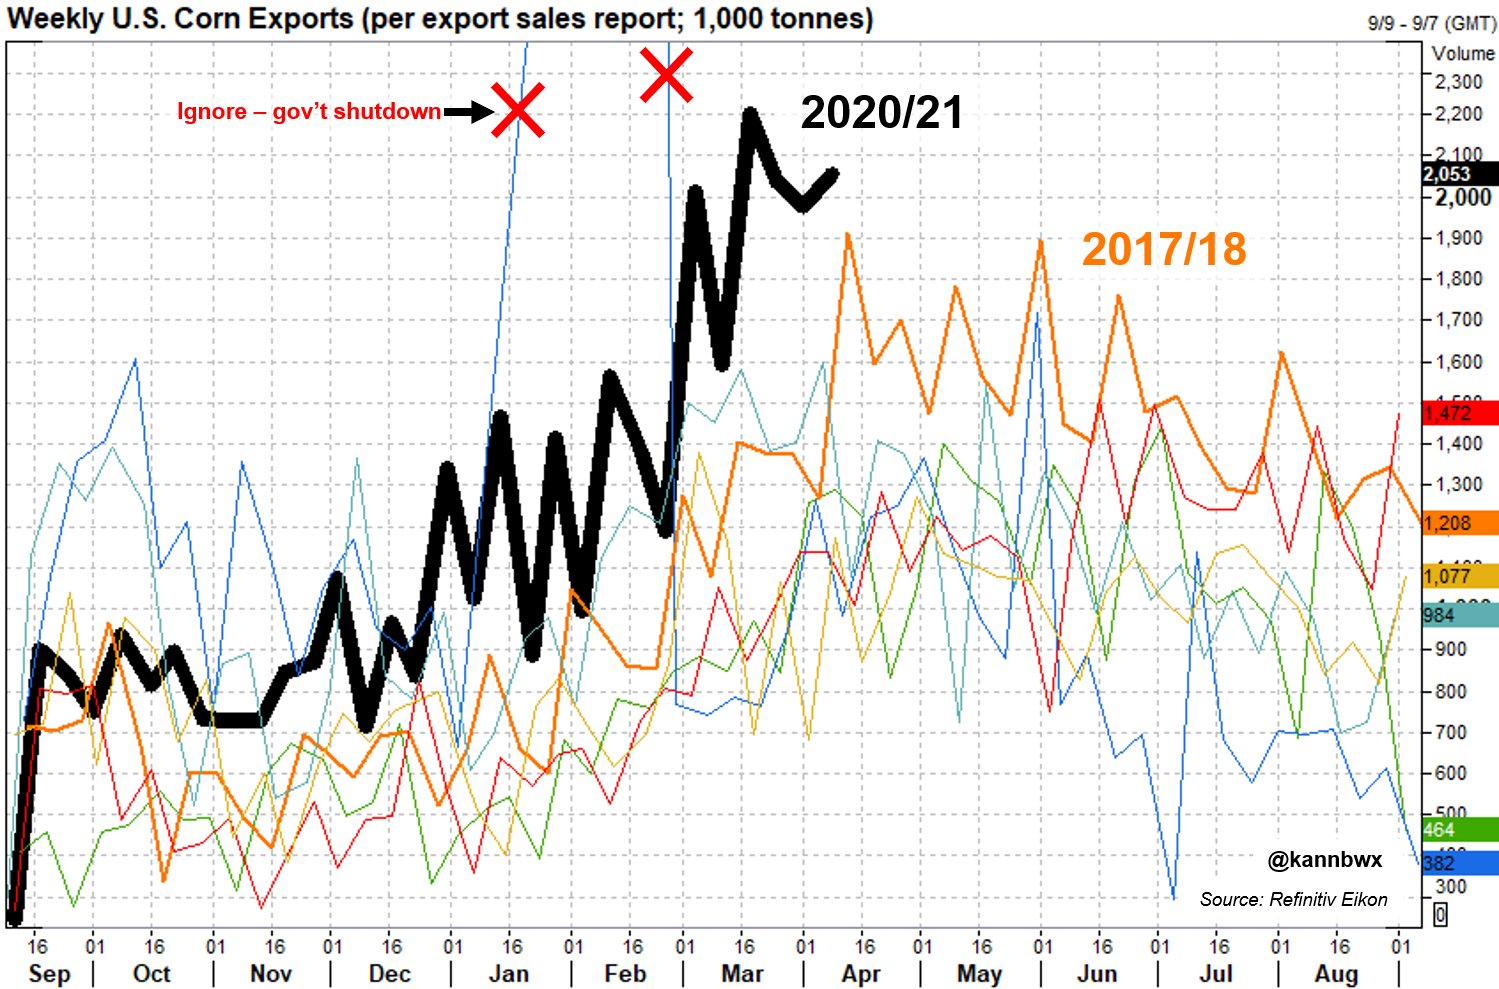
Official U.S. Census data for Feb exports will be published Wednesday, but based on inspections, this is roughly what U.S. #corn exports may have looked like during Feb-March. March record is 6.7 mmt in 2017 and all-time is 7.75 mmt in May 2018. March 2021 may have topped 9 mmt.
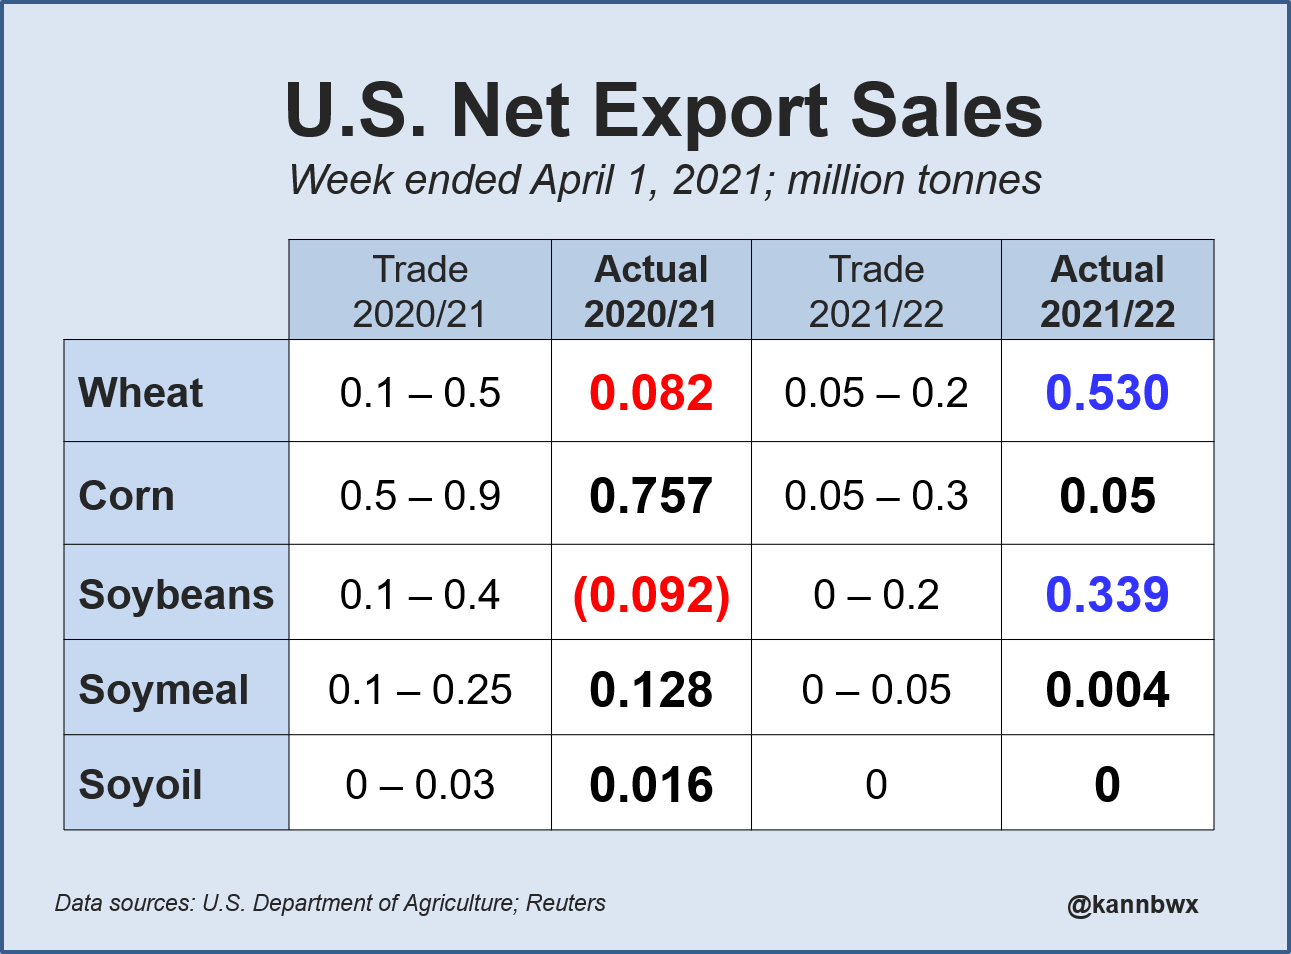
Last week #China net cancelled 216kt U.S. #soybeans for 20/21 but they bought 264kt new crop. China also bought 260kt new crop #wheat and bought net 99kt old crop #corn.
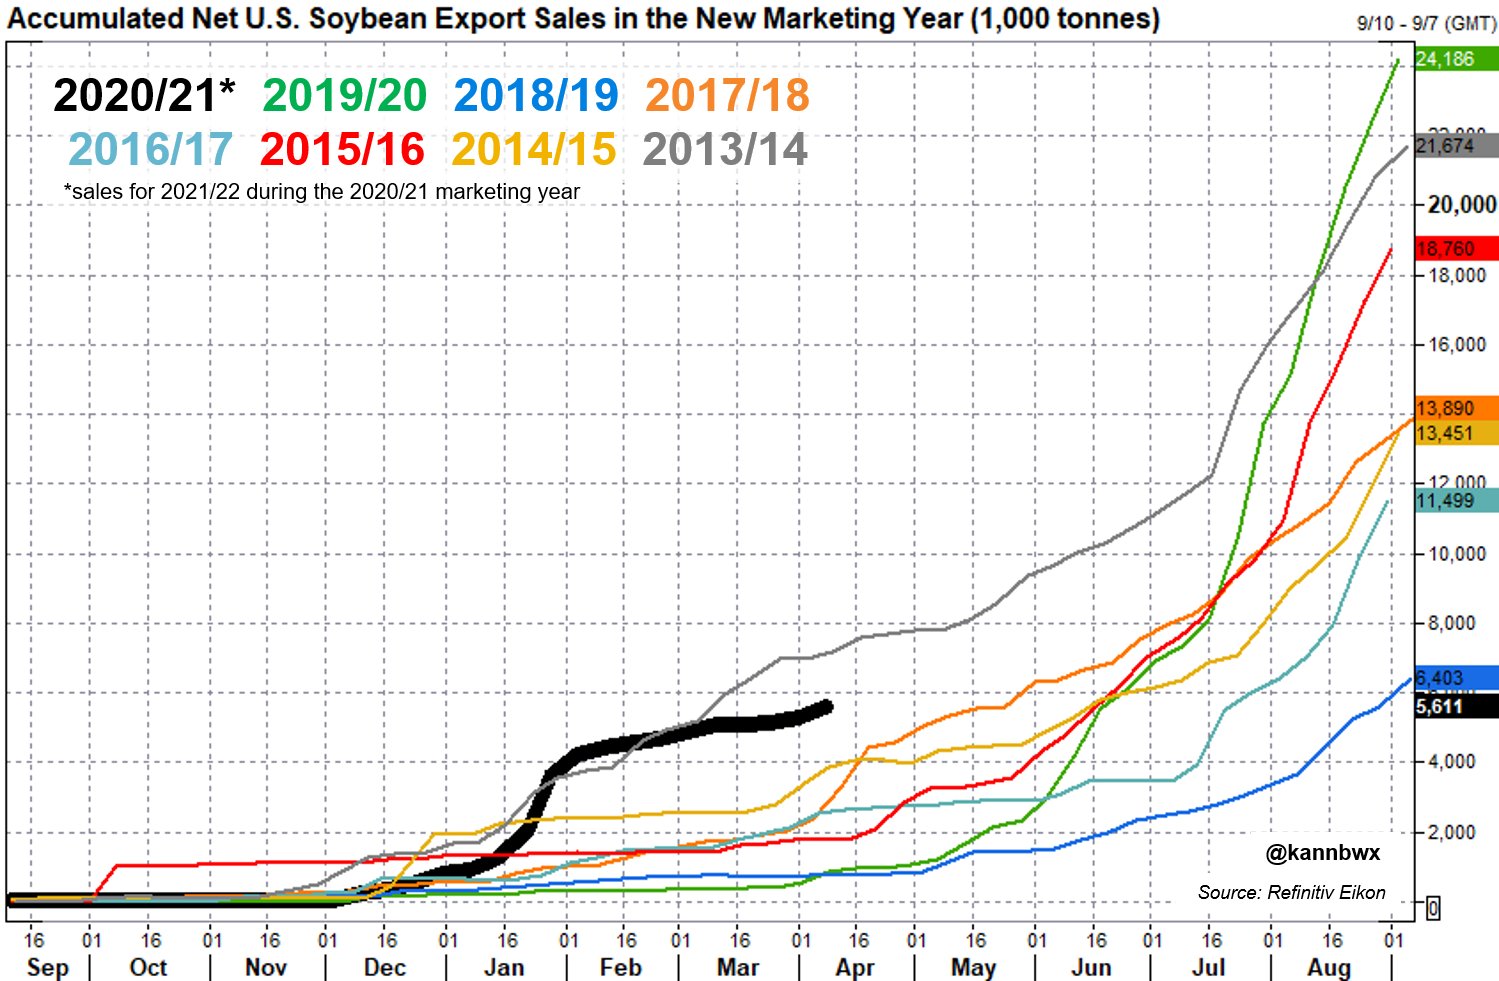
Sales of new-crop #soybeans are above average for the time of year, though there hasn't been much activity since January. April 1 total was 206 mbu (5.6 mmt). #China bought 9.7 mbu last week. Top destinations: China 46% Unknown 37% EU-27 7%
Sales of #soybeans stood at 2.232 billion bushels (60.5 mmt) as of April 1 - 99.2% of USDA's full-year forecast. Top destinations:#China 59%#Mexico 8% EU-27 7%#Egypt 4%#Japan 3%
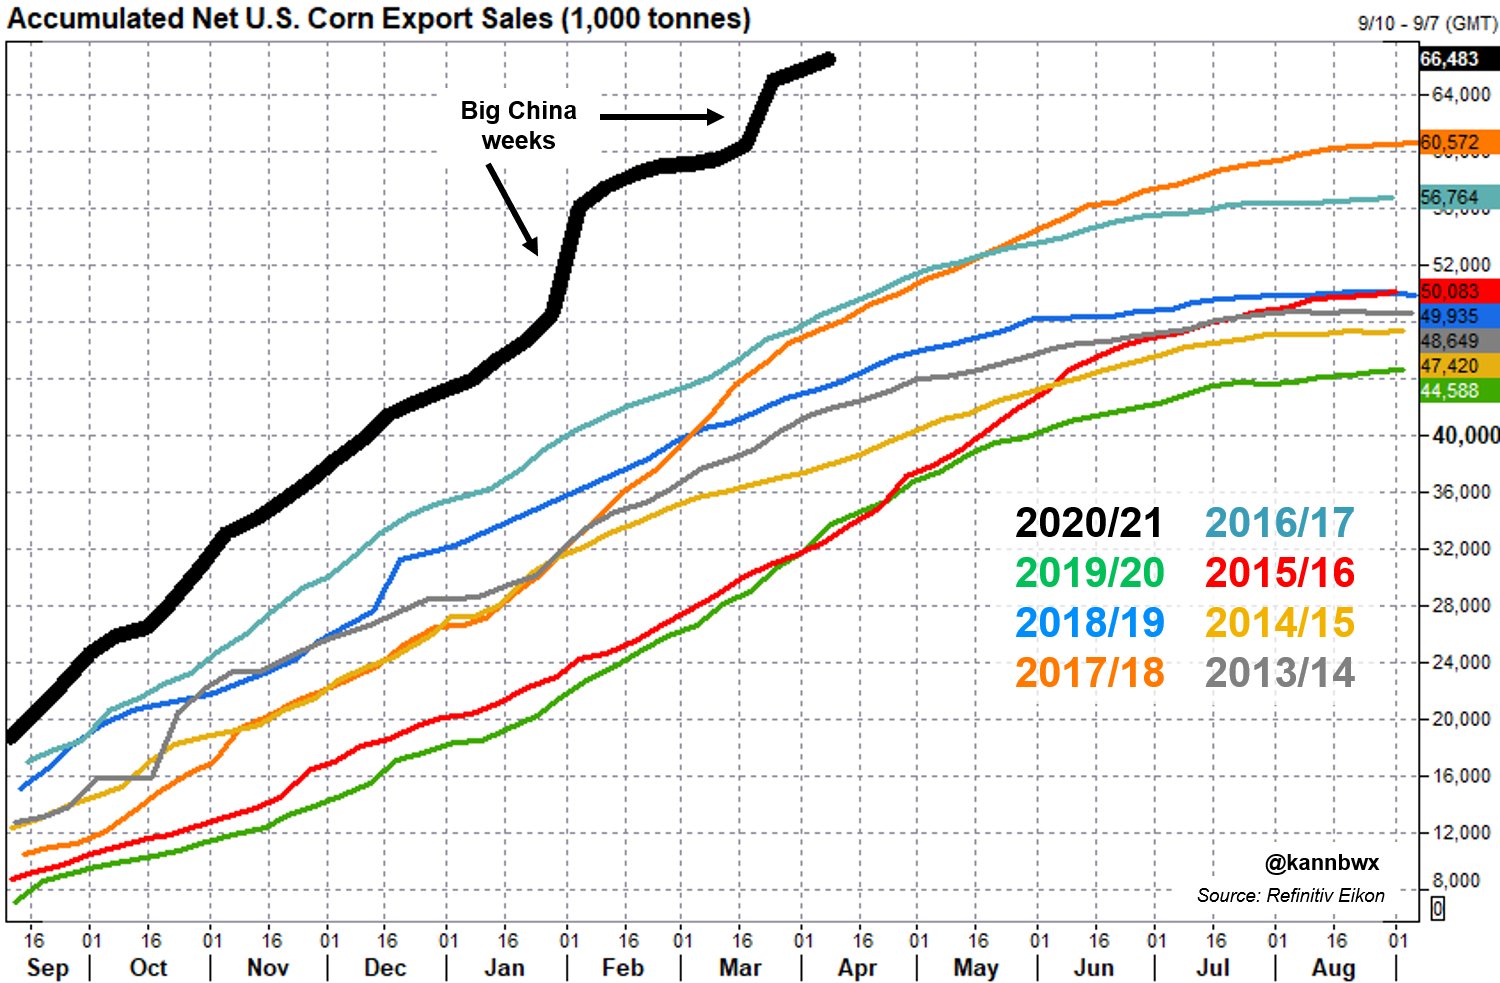
As of April 1, USA had sold 2.617 billion bushels of #corn for export in 2020/21 (66.5 mmt), slightly more than the USDA forecast of 2.6 bbu. Top destinations:#China 35%#Mexico 19%#Japan 14% Unknown 6%#Colombia 5%
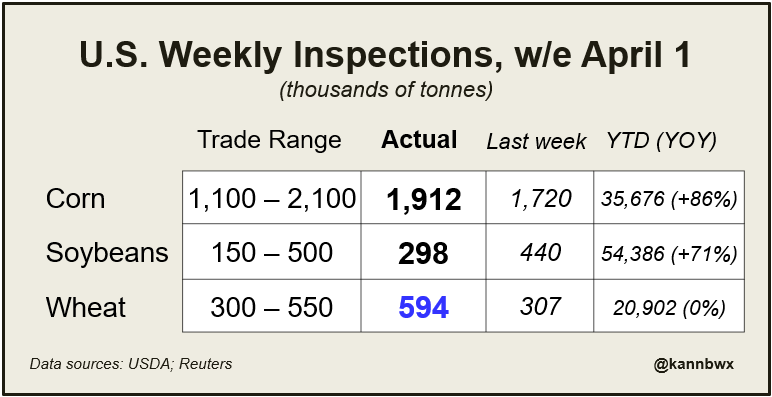
#Corn exports topped 2 million tonnes last week - among the best weeks on record. From here on out, 2018 is the high benchmark and with current sales levels, exports don't have to be as strong as in April-August 2018. They could be up to 15% lighter.
#China on Friday increased its estimate for 2020/21 #corn imports to 22 million tonnes from 10 million projected last month. USDA has already pegged imports at 24 million tonnes for 2020/21.