Starting a new thread since we're close to 50 on the last one.
The march contract OI has fallen below 50k. A little earlier than usual. Nonetheless. I am changing my concentration to the april contract, since march expires wednesday.
Weatherwise, the GFS models show warming in the second week. And the deep freeze in the middle is moving out over the weekend. Still might be some repercussions in the first of the week, but I don't expect them to last, nor be of any major consequence. I could be wrong.
Seasonals usually turn up, as heating demand in the north continues, but cooling, or lack of the need for heating, in the south comes into play. Conundrum. Exports are still rising. But as gas rigs and production facilities come back online next week, it may offer some resistance. Still, I will be looking for more opportunities to the long side for the next month. But always going with the flow of the market.
Good trades!!
Thanks for starting a new thread Mark!
Oops, sorry. Mike, as this should go here/my bad:
As of 12Z Sun vs 12 Fri, I have the main models a bit warmer day by day although the GEFS appeared to have more of a warmer change vs Fri. All fwiw.
Playing to the short side due to weather. Already ahead 20 pts. Looking for another entry.
Good trades!!
Thanks guys! March Natural Gas expires on Wednesday. Wild spikes up or down are known to happen ahead of expiration.
Natural gas futures were down sharply in early trading Monday, pressured by a warmer weather outlook and production coming back online following last week’s cold-related disruptions. The March Nymex contract was down 13.8 cents to $2.931/MMBtu at around 8:50 a.m. ET. Forecasts trended warmer over the weekend, showing a warmer than normal pattern for early…
I wanted to take some time catching up on other stuff before making this post on ng, which is actually the most interesting by far of any markets I'm following right now.
NG is clearly trading the much milder weather coming up.
We had a very weak open last night and put in the highs just after that for the NGJ contract and have been under pressure much of the time since then.
The weather for the foreseeable future is pretty bearish.........even beyond 2 weeks.
However, the EIA number this Thursday is going to be an eye popping number. Larry probably has an idea hopefully but the number will be over 300 bcf and the biggest ever for this late in the season and near the top historically.
But the market knows this, even though the bears are not likely to press things to hard ahead of the number.
Also, NGH expires in 2 days..........often a volatile time with spikes in either direction possible.
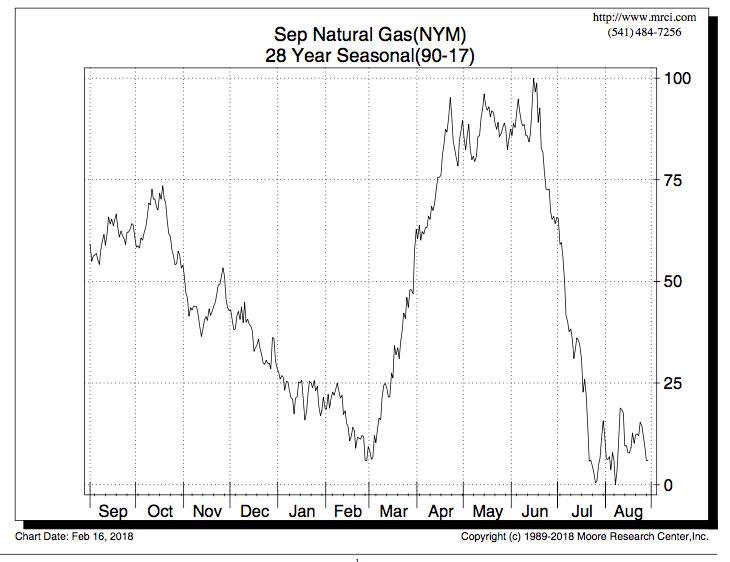
Also, seasonals very frequently bottom here. It's usually a bad idea to be short ng in March/April without a very compelling reason(COVID was the reason last year) 90% of the time, ng prices go higher during that period.
The technical picture is REAL intriguing.
NGJ opened very weak, and put in the high of 2.965 shortly after that. Not a gap lower however. The low was set early this morning at 2.865 and we are at 2.906 at the moment, down almost $1,000/contract but almost recovered to mid range.
The NGH front month is down $1,600/contract. The March contract, is usually the last one of the Winter that shows weakness without extreme cold.
The NGJ, when it traded the lows, tested an uptrend going back to the 2.475 low on 1-22-21. That uptrend has been touched several times now, including this morning. It held each time(which is what makes it an uptrend channel).
This usually means that its very strong. However, cold weather came to the rescue at all the other points when it bounced off the uptrend channel. That won't happen this time..but seasonals and other factors can pitch in to provide support here(EIA number in 3 days).
Also, last week, when we hit 3.060 in NGJ and failed, we made a double top with the 11-2-20 high of 3.052.
So we have a solid top formation from last week.....very bearish but we are holding the uptrend channel.......bullish.
The weather is very bearish but the EIA number WILL BE very bullish(but expected/dialed in when we spiked to 3.060 last week).
Seasonals turn strongly up, especially after the NGH expires in 2 days but it can spike down just before expiration.
What do you guys have?
Latest Release Feb 18, 2021 Actual-237B Forecast-252BPrevious-171B
| Release Date | Time | Actual | Forecast | Previous | |
|---|---|---|---|---|---|
| Feb 25, 2021 | 10:30 | -237B | |||
| Feb 18, 2021 | 10:30 | -237B | -252B | -171B | |
| Feb 11, 2021 | 10:30 | -171B | -181B | -192B | |
| Feb 04, 2021 | 10:30 | -192B | -192B | -128B | |
| Jan 28, 2021 | 10:30 | -128B | -136B | -187B | |
| Jan 22, 2021 | 10:30 | -187B | -174B | -134B |
![]()
for week ending February 12, 2021 | Released: February 18, 2021 at 10:30 a.m. | Next Release: February 25, 2021
-237 BCF a big number but smaller than expected
| Working gas in underground storage, Lower 48 states Summary text CSV JSN | |||||||||||||||||||||||||
|---|---|---|---|---|---|---|---|---|---|---|---|---|---|---|---|---|---|---|---|---|---|---|---|---|---|
| Historical Comparisons | |||||||||||||||||||||||||
| Stocks billion cubic feet (Bcf) | Year ago (02/12/20) | 5-year average (2016-20) | |||||||||||||||||||||||
| Region | 02/12/21 | 02/05/21 | net change | implied flow | Bcf | % change | Bcf | % change | |||||||||||||||||
| East | 485 | 529 | -44 | -44 | 539 | -10.0 | 482 | 0.6 | |||||||||||||||||
| Midwest | 589 | 666 | -77 | -77 | 655 | -10.1 | 578 | 1.9 | |||||||||||||||||
| Mountain | 137 | 150 | -13 | -13 | 120 | 14.2 | 125 | 9.6 | |||||||||||||||||
| Pacific | 244 | 257 | -13 | -13 | 199 | 22.6 | 203 | 20.2 | |||||||||||||||||
| South Central | 826 | 915 | -89 | -89 | 873 | -5.4 | 837 | -1.3 | |||||||||||||||||
| Salt | 233 | 261 | -28 | -28 | 260 | -10.4 | 258 | -9.7 | |||||||||||||||||
| Nonsalt | 593 | 654 | -61 | -61 | 613 | -3.3 | 579 | 2.4 | |||||||||||||||||
| Total | 2,281 | 2,518 | -237 | -237 | 2,386 | -4.4 | 2,224 | 2.6 | |||||||||||||||||
Totals may not equal sum of components because of independent rounding. | |||||||||||||||||||||||||
Working gas in storage was 2,281 Bcf as of Friday, February 12, 2021, according to EIA estimates. This represents a net decrease of 237 Bcf from the previous week. Stocks were 105 Bcf less than last year at this time and 57 Bcf above the five-year average of 2,224 Bcf. At 2,281 Bcf, total working gas is within the five-year historical range.
For information on sampling error in this report, see Estimated Measures of Sampling Variability table below.

7 day temps for last Thursday's -237 BCF number. Frigid NorthCentral. Anomalies go way off the Violet color on the extreme cold scale.
7 day temps ending last Friday for this Thursdays EIA report. WOW!
Violet includes 30 deg. F below average in parts of Texas.
Coldest for that week ever. Estimates are going to be -300+ BCF. What do you think Larry?
Storage is now below last year at this time(before COVID hit) and after this EIA report, will also be well below the 5 year average.
Thanks for the great analysis Mike. I agree, this week is going to be rough to trade. Except for weather, everything else is technically bullish. I don't think that March expiring on wednesday is going to have too much sway with the rest of the contracts. We shall see.
Good Trades!!!
Thanks Mark!
More warming in week 2. Florida turns on air conditioners. Probably have some chatter as March expires tomorrow. The real day will be thursday.
Mike,
The EIA week is the 3rd coldest since 1994 with only a week in Jan 1994 (coldest since 1994) and early Jan 2018 colder.
I think we're likely looking at toward the mid 300s, 2nd largest on record.
Thanks Larry!
March and April are often very, very strong months, with it tapering off in May. Some years, it lasts into early June.
This year, we will start that period with VERY bearish weather.
Wednesday closing comments:
Thursday morning comments:
for week ending February 19, 2021 | Released: February 25, 2021 at 10:30 a.m. | Next Release: March 4, 2021
-338 BCF Huge but expected
| Working gas in underground storage, Lower 48 states Summary text CSV JSN | |||||||||||||||||||||||||
|---|---|---|---|---|---|---|---|---|---|---|---|---|---|---|---|---|---|---|---|---|---|---|---|---|---|
| Historical Comparisons | |||||||||||||||||||||||||
| Stocks billion cubic feet (Bcf) | Year ago (02/19/20) | 5-year average (2016-20) | |||||||||||||||||||||||
| Region | 02/19/21 | 02/12/21 | net change | implied flow | Bcf | % change | Bcf | % change | |||||||||||||||||
| East | 424 | 485 | -61 | -61 | 496 | -14.5 | 440 | -3.6 | |||||||||||||||||
| Midwest | 508 | 589 | -81 | -81 | 605 | -16.0 | 537 | -5.4 | |||||||||||||||||
| Mountain | 123 | 137 | -14 | -14 | 111 | 10.8 | 119 | 3.4 | |||||||||||||||||
| Pacific | 218 | 244 | -26 | -26 | 197 | 10.7 | 197 | 10.7 | |||||||||||||||||
| South Central | 670 | 826 | -156 | -156 | 832 | -19.5 | 811 | -17.4 | |||||||||||||||||
| Salt | 150 | 233 | -83 | -83 | 248 | -39.5 | 249 | -39.8 | |||||||||||||||||
| Nonsalt | 520 | 593 | -73 | -73 | 586 | -11.3 | 562 | -7.5 | |||||||||||||||||
| Total | 1,943 | 2,281 | -338 | -338 | 2,241 | -13.3 | 2,104 | -7.7 | |||||||||||||||||
Totals may not equal sum of components because of independent rounding. | |||||||||||||||||||||||||
Working gas in storage was 1,943 Bcf as of Friday, February 19, 2021, according to EIA estimates. This represents a net decrease of 338 Bcf from the previous week. Stocks were 298 Bcf less than last year at this time and 161 Bcf below the five-year average of 2,104 Bcf. At 1,943 Bcf, total working gas is within the five-year historical range.
For information on sampling error in this report, see Estimated Measures of Sampling Variability table below.
Note: The shaded area indicates the range between the historical minimum and maximum values for the weekly series from 2016 through 2020. The dashed vertical lines indicate current and year-ago weekly periods.
Latest Release Feb 25, 2021 Actual-338B Forecast-333B Previous-237B https://www.investing.com/economic-calendar/natural-gas-storage-386
| Release Date | Time | Actual | Forecast | Previous | |
|---|---|---|---|---|---|
| Feb 25, 2021 | 10:30 | -338B | -333B | -237B | |
| Feb 18, 2021 | 10:30 | -237B | -252B | -171B | |
| Feb 11, 2021 | 10:30 | -171B | -181B | -192B | |
| Feb 04, 2021 | 10:30 | -192B | -192B | -128B | |
| Jan 28, 2021 | 10:30 | -128B | -136B | -187B | |
| Jan 22, 2021 | 10:30 | -187B | -174B | -134B |
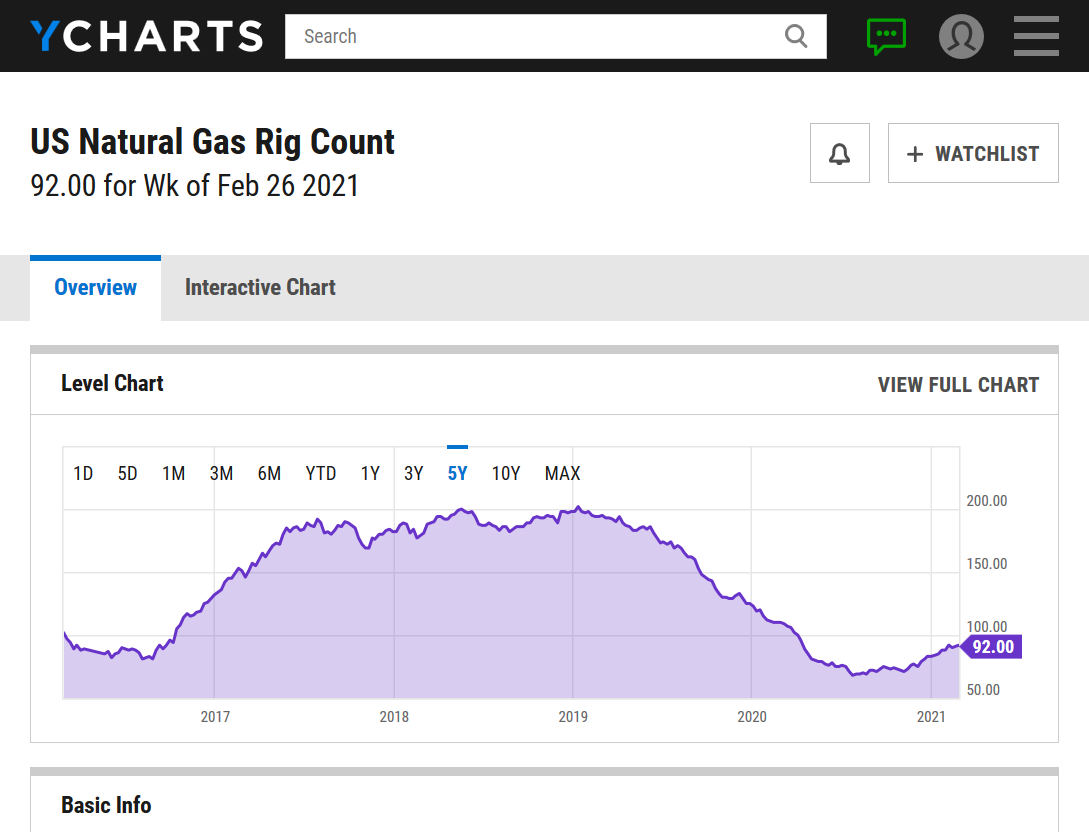
Rig count continues to climb from the lowest in history. The bottom was 69 in early August 2020.
https://ycharts.com/indicators/us_gas_rotary_rigs

metmike: How much lower can the mild wx push prices when Winter is almost over and seasonals turn strongly up and storage is now BELOW the 5 year average?
If fundamentals are even mildly bullish for 2021, then these prices could represent fair value and inspire some buying.
Since storage has dropped below the 5year avg, we might start seeing some seasonal bullish runs starting next week. A better position for it than last year. Been thinking all morning that it's at the best buying level right now. The next EIA report should show a lot less draw, but may still support a little bullish behavior. We shall see.
Early this morning the NGJ contract tested an uptrend line going back to the 12-28-20 low of 2.308.
The low then/today is 2.707.
NGJ, which is the new front month had a very small gap higher on the open from models being a bit less mild/chillier compared to Friday, mainly in week 1.
It closed the gap quickly but the top of the gap has been short term support.
If the less mild changes would be related to an actual pattern change to colder in week 2 and beyond, I could see us adding to the gains.............considering other bullish factors.
1. We tested/held a 3 month long uptrend line on Friday: https://www.marketforum.com/forum/topic/65814/#66058
2. Very strong/positive Seasonals kick in right about now.
https://www.marketforum.com/forum/topic/65814/#65970
3. Storage has gone from near the highest late in 2020 to below the 5 year average:
https://www.marketforum.com/forum/topic/65814/#65998
4. COVID is getting better and this should increase industrial demand.
Other factors.
5. The rig count has been increasing but is still low:
https://www.marketforum.com/forum/topic/65814/#66118
6. LNG exports will probably be increasing............unsure of this fundamental.
https://www.marketforum.com/forum/topic/65814/#66119
7. Inflationary pressure could be to the upside.
https://ycharts.com/indicators/us_gas_rotary_rigs
Rig count continues to climb from the lowest in history. The bottom was 69 in early August 2020. We were +1 last week.
https://www.eia.gov/todayinenergy/detail.php?id=46796

Source: U.S. Energy Information Administration, Short-Term Energy Outlook (STEO)
According to the U.S. Energy Information Administration’s (EIA) February 2021 Short-Term Energy Outlook (STEO), EIA forecasts that U.S. liquefied natural gas (LNG) exports will exceed natural gas exports by pipeline in the first and fourth quarters of 2021 and on an annual basis in 2022. Monthly U.S. LNG exports exceeded natural gas exports by pipeline by nearly 1.2 billion cubic feet per day (Bcf/d) in November 2020, according to EIA’s Natural Gas Monthly. LNG exports have only exceeded natural gas exports by pipeline once since 1998—in April 2020—by 0.01 Bcf/d.
U.S. LNG exports set consecutive monthly records of 9.4 Bcf/d in November and of 9.8 Bcf/d in both December 2020 and January 2021, according to EIA’s estimates based on the shipping data provided by Bloomberg Finance, L.P. EIA forecasts that U.S. LNG gross exports will average 9.7 Bcf/d in February 2021 before declining to seasonal lows in the shoulder months of the spring and fall seasons. EIA forecasts LNG exports to average 8.5 Bcf/d in 2021 and 9.2 Bcf/d in 2022, compared with average gross pipeline exports of 8.8 Bcf/d in 2021 and 8.9 Bcf/d in 2022.
Since November 2020, all six U.S. LNG export facilities have been operating near full design capacity. In December, the Corpus Christi LNG facility in Texas commissioned its third and final liquefaction unit six months ahead of schedule, bringing the total U.S. liquefaction capacity to 9.5 Bcf/d baseload (10.8 Bcf/d peak) across six export terminals. The November–January increase in U.S. LNG exports has been driven by rising international natural gas and LNG prices, particularly in Asia, and lower global LNG supply because of unplanned outages at several LNG export facilities worldwide.

Source: U.S. Energy Information Administration, Natural Gas Monthly
U.S. pipeline exports to Mexico increased by 6.4% in the first eleven months of 2020 compared with the same period in 2019 as a result of the completion of a new segment of the Wahalajara pipeline system in June and the Cempoala compressor station in September. The completion of Mexico’s Samalayuca-Sásabe pipeline (0.47 Bcf/d capacity) in January 2021 and the expected completion of Tula-Villa de Reyes pipeline (0.89 Bcf/d capacity) later this year are expected to further increase U.S. pipeline exports to Mexico.
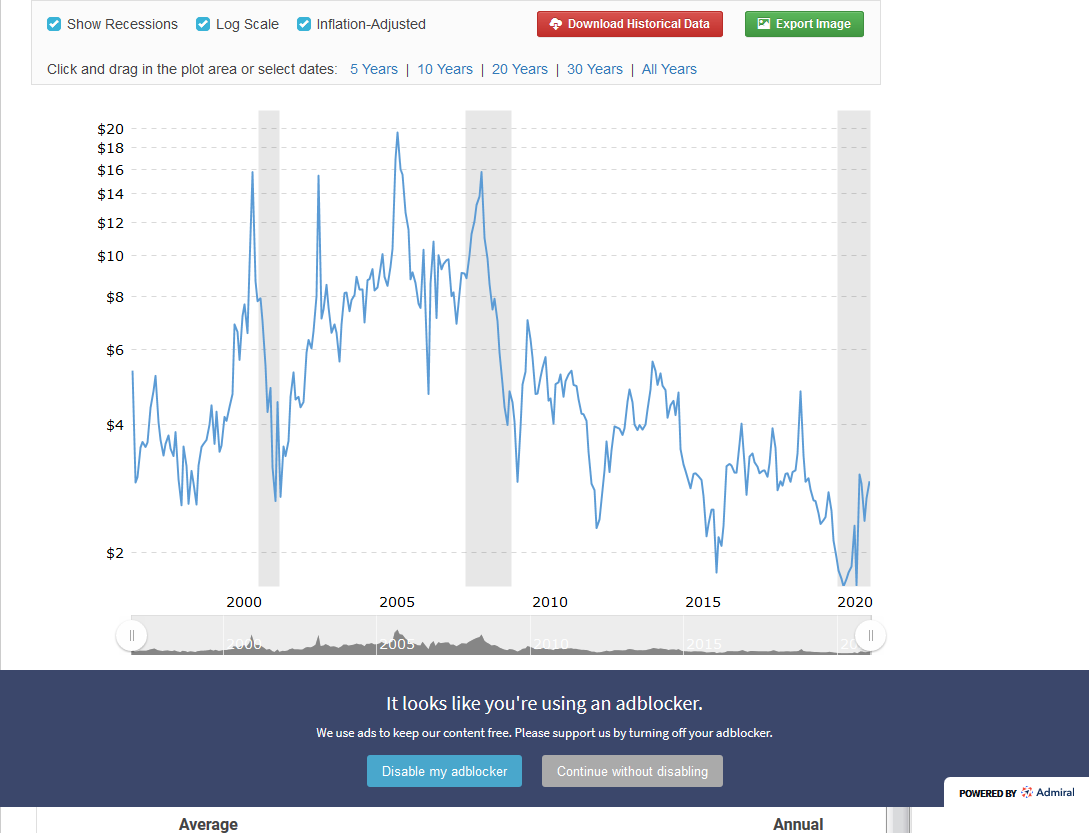
25 year price chart of natural gas:
https://www.macrotrends.net/2478/natural-gas-prices-historical-chart
Based on the forecast from the NWS for the next 2 weeks, I thought NG would be down tonight. Impressive.
YW!
Yeah, the 6-10/8-14 day forecasts are pretty mild but there are more HDD's on all the models than Friday and we are in a bullish time of year for ng.
Natural gas futures on Monday hovered in a narrow range of gains and losses as traders weighed outlooks for mild spring weather and its dampening effect on domestic demand against a recovery in liquefied natural gas (LNG) levels.
Doesn't look like serious A/C weather yet. Gonna keep the heat turned on for a while longer. Even in the south. Overnight drop of cold air at end of week 2, but warms back up fast the next day.
Was looking at the export charts above. It seems that we pretty consistantly get a drop in export, via both means, from about now til summer. That seems bearish to me, yet it happens during the spring seasonal uptrend. Weather and usage is also in transition. Is it the low storage that drives the seasonal? Because that could explain the lack of the seasonal trend last year. Along with the covid.
NGI Headline Tuesday after the close.
Continued colder trends for the mid-March time frame lent some support to natural gas futures prices in early trading Wednesday. Holding onto gains from the previous session, the April Nymex contract was up 0.5 cents to $2.844/MMBtu at around 8:45 a.m. ET. As of early Wednesday, the latest weather data again showed colder trends over…
metmike: That was earlier of course but models are milder to me, especially this last 12z run.
Is it me? Or does it seem that algorithm trading is rising in the NG market? Too many fast decisions/moves happening.
Latest Release Mar 04, 2021 Actual-98B Forecast-136B Previous-338B
MEGA Bearish
https://www.investing.com/economic-calendar/natural-gas-storage-386
| Release Date | Time | Actual | Forecast | Previous | |
|---|---|---|---|---|---|
| Mar 04, 2021 | 10:30 | -98B | -136B | -338B | |
| Feb 25, 2021 | 10:30 | -338B | -333B | -237B | |
| Feb 18, 2021 | 10:30 | -237B | -252B | -171B | |
| Feb 11, 2021 | 10:30 | -171B | -181B | -192B | |
| Feb 04, 2021 | 10:30 | -192B | -192B | -128B | |
| Jan 28, 2021 | 10:30 | -128B | -136B | -187B |
for week ending February 26, 2021 | Released: March 4, 2021 at 10:30 a.m. | Next Release: March 11, 2021
-98 BCF EXTREMELY BEARISH............vs expectations
| Working gas in underground storage, Lower 48 states Summary text CSV JSN | |||||||||||||||||||||||||
|---|---|---|---|---|---|---|---|---|---|---|---|---|---|---|---|---|---|---|---|---|---|---|---|---|---|
| Historical Comparisons | |||||||||||||||||||||||||
| Stocks billion cubic feet (Bcf) | Year ago (02/26/20) | 5-year average (2016-20) | |||||||||||||||||||||||
| Region | 02/26/21 | 02/19/21 | net change | implied flow | Bcf | % change | Bcf | % change | |||||||||||||||||
| East | 383 | 424 | -41 | -41 | 460 | -16.7 | 415 | -7.7 | |||||||||||||||||
| Midwest | 465 | 508 | -43 | -43 | 567 | -18.0 | 507 | -8.3 | |||||||||||||||||
| Mountain | 117 | 123 | -6 | -6 | 103 | 13.6 | 113 | 3.5 | |||||||||||||||||
| Pacific | 210 | 218 | -8 | -8 | 197 | 6.6 | 191 | 9.9 | |||||||||||||||||
| South Central | 670 | 670 | 0 | 0 | 795 | -15.7 | 796 | -15.8 | |||||||||||||||||
| Salt | 159 | 150 | 9 | 9 | 233 | -31.8 | 245 | -35.1 | |||||||||||||||||
| Nonsalt | 511 | 520 | -9 | -9 | 562 | -9.1 | 552 | -7.4 | |||||||||||||||||
| Total | 1,845 | 1,943 | -98 | -98 | 2,122 | -13.1 | 2,023 | -8.8 | |||||||||||||||||
Totals may not equal sum of components because of independent rounding. | |||||||||||||||||||||||||
Working gas in storage was 1,845 Bcf as of Friday, February 26, 2021, according to EIA estimates. This represents a net decrease of 98 Bcf from the previous week. Stocks were 277 Bcf less than last year at this time and 178 Bcf below the five-year average of 2,023 Bcf. At 1,845 Bcf, total working gas is within the five-year historical range.
For information on sampling error in this report, see Estimated Measures of Sampling Variability table below.
Note: The shaded area indicates the range between the historical minimum and maximum values for the weekly series from 2016 through 2020. The dashed vertical lines indicate current and year-ago weekly periods.
7 day temps for the period ending last Friday used with this last EIA report.
MUCH, MUCH, MUCH milder than the previous 2 periods.
That was short lived. Anticipated by the overnight market. Bearish weather outlook to finish the day.
Thanks tallpine
EXTREMELY bearish EIA report:
https://www.marketforum.com/forum/topic/65814/
Corn sales were not good:
https://www.marketforum.com/forum/topic/66151/
USDA coming up:

“It implies super weak supply/demand balances,” Bespoke Weather Services said.
Ahead of the EIA report, the April contract was down 5.1 cents at $2.765/MMBtu, and the prompt month dropped further to around $2.720 when the data was released. By 11 a.m. ET, the April contract had recovered some of the lost ground but remained down 6.7 cents from Wednesday’s close at $2.749.
[Want to know how global LNG demand impacts North American fundamentals? To find out, subscribe to LNG Insight.]
Ahead of the EIA print, NGI’s model estimated a 135 Bcf withdrawal for the covered week.
Bloomberg survey found withdrawal estimates ranging from 131 Bcf to 162 Bcf, with a median 140 Bcf decrease. A Reuters poll found pull estimates spanning from 93 Bcf to 150 Bcf and a median estimate for a 135 Bcf decline in stocks.
A Wall Street Journal poll, meanwhile, landed at an average withdrawal of 144 Bcf, with estimates ranging from decreases of 117 Bcf to 162 Bcf.
A week earlier, following the Arctic blast in Texas, EIA posted the steepest pull of the season and the second biggest on record — 338 Bcf. The record 359 Bcf draw was reported by EIA in January 2018.
Participants on The Desk’s online energy platform Enelyst were stunned by the low number for last week, given that chilly conditions lingered over much of the nation’s midsection and into the East during the period.
“Quite a low-side surprise,” one analyst said. Another added: “No way this is correct.”
The total tally, however, was skewed by light demand in the South Central region, where EIA reported an injection into salt facilities.
The region spurred the near-record withdrawal a week earlier amid the harsh cold snap that caught Texas off guard. But temperatures in Texas rebounded and, after gas prices soared amid the mid-February chill, Texans pulled back sharply on demand as weather improved, analysts said.
“It got pretty mild here in Texas very quickly after the freeze,” NGI’s Leticia Gonzales, price and markets editor, noted on Enelyst.
The pull for the Feb. 26 week decreased inventories to 1,845 Bcf, which compared with the year-earlier level of 2,122 Bcf and the five-year average of 2,203 Bcf.
The Midwest and East, where chilly weather lingered during the week, led all regions with withdrawals of 43 Bcf and 41 Bcf, respectively, according to EIA.
Pacific region inventories fell by 8 Bcf, while Mountain stocks declined by 6 Bcf.
The South Central, however, broke even, with a 9 Bcf pull from nonsalt facilities and an increase of 9 Bcf in salts.
Looking ahead to next week, analysts were unsure what to expect, given Thursday’s surprise. Liquefied natural gas export levels, hampered by the Texas freeze in February, this week climbed back to the lofty levels reached during the peak of winter. However, production also marched back to pre-storm levels as well.
“On the gas side of things,” Gonzales said, “it’s back to business as usual it seems.”
That, of course, leaves weather as the inevitable wildcard. Conditions so far this week have proven mixed, with some late winter conditions in parts of the country and early spring warmth in others.
A surprisingly anemic storage withdrawal caught markets off guard on Thursday, fueling bearish demand sentiment and driving natural gas futures lower despite robust liquefied natural gas (LNG) levels. The April Nymex contract dropped 7.0 cents on the day and settled at $2.746/MMBtu. May shed 6.8 cents to $2.781. Diminished near-term weather demand also dragged spot…
metmike: EIA was a bearish shocker!
The weather too. Tempted to go long through the weekend. Something is bound to mess up, and make it open gap up sunday night. Think I will at least paper trade it.
Noticed that ENGJ has crossed below the trendline and stayed. Hitting the same bottom as yesterday.
We have broken the uptrend line going back to the lows on December 28 and also violated the lows of 2-24 and yesterday but just bounced back above those lows from the just out colder 12z European model.
When we were making the lows earlier/this morning, the market was unable to find enough selling to push things more than a few ticks lower each time.........like we would see if this were January with a warm outlook.
Instead, it appeared as if we were uncovering new buying at new lows and new selling drying up...........suggesting the market sees this price as representing value.
An important item to note is that being short in March/April rarely works, other than for short term spurts down because seasonals are incredibly strong and often sustained here.
COVID last year sabotaged the seasonals and crushed prices with demand being obliterated as we hit the lowest prices in 30 years.
NG storage has gone for near the highest ever late last year to below the 5 year average right now.
Maybe yesterday's mega bearish EIA report was an anomaly? but the storage plunge over such a short period is pretty bullish if it reflects fundamentals that might continue.
"Tempted to go long through the weekend. Something is bound to mess up, and make it open gap up sunday night."
Considering the weak close......near the lows and a weeks worth of near record warmth coming up(before maybe turning colder) with the market having a bearish hangover from yesterdays shockingly low/bearish withdrawal number, the chances of a gap lower on Sunday Night seem much higher than a gap higher.
The solidly positive AO is NOT favorable for cold air movement/delivery from high latitudes to mid latitudes, so no help for the ng weather bulls there, despite the last NWS 8-14 day outlook taking out the widespread Above average temps in the Midwest to Northeast. I think that there is just very high uncertainty more than anything.
The very speculative week 3-4 maps are pretty bearish but skill level is low for that period.
Latest, updated graph/forecast for AO and NAO and PNA here, including an explanation of how to interpret them.
https://www.marketforum.com/forum/t

https://www.cpc.ncep.noaa.gov/products/predictions/814day/index.php

2nd half of March, start of April forecast below:

It has seemed like this whole week has been filled with uncertainty. Kinda dependiing on that to come into play on sunday, with those who are anticipating having a seasonal rally this year. And if the European models turn colder over the weekend, then it becomes more likely for a gap up.
I'm just paper trading it (L@2.702) just to see if what I'm thinking works out.
I will probably start a new thread sunday. Have a great weekend!