Please continue discussions from the prior NG thread here.
The prior NG thread is at: https://marketforum.com/forum/topic/61249/
In that thread, Mike said this:
"Some of the spike higher recently could have been induced from short covering ahead of the Dec expiring and we thought it was all from weather, so it could have spiked the price much higher ahead of when it would have without the expiration of the front month on Wednesday.
What do you think Larry?"
-----------------------------------------
Mike,
I'm very confident it was mostly from much colder forecasts vs the prior extreme warmth, including record warmth, of much of November. This was the near ideal long setup that you often talk about when going from very bearish wx, which caused huge price drops due to most everyone following wx being bearish, to a much colder pattern in the models (for very late Nov/early Dec with many, many more HDDs and thus much larger projected draws) and especially early in the season. The bounce was from a combo of short covering and new longs, of course.
Thanks
I'm more interested on your take about today's huge sell off.
14 Rigs running and I have 2.
From the NDIC Director's cut; NDIC.
At the wellhead: Wellhead ND light sweet $33.25 Northern Border- Watford City $1.88
Recovery has slowed. Low Rig count and the high depletion rate of shale wells.
| Directors Cut | |||||||||
| NDIC | |||||||||
| Oil | M over M | M over M | Gas | M over M | M over M | ||||
| Mth | Mthly cum | Bbls/ D | Mthly cum | Mcf/ D | |||||
| Sept | 36,649,997 | 1% | 1,221,667 | 5% | 84,409,981 | 3% | 2,813,666 | 7% | |
| Aug | 36,126,492 | 12% | 1,165,371 | 12% | 81,692,742 | 14% | 2,635,250 | 14% | |
| July | 32,304,503 | 21% | 1,042,081 | 17% | 71,375,125 | 21% | 2,302,356 | 17% | |
| June | 26,703,268 | 0% | 890,109 | 4% | 59,198,681 | -1% | 1,973,289 | 2% | |
| May | 26,640,218 | -27% | 859,362 | -30% | 59,771,779 | -27% | 1,928,122 | -29% | |
| April | 36,572,571 | -17% | 1,219,086 | -15% | 81,365,042 | -16% | 2,712,168 | -13% | |
| March | 44,276,463 | 1,428,273 | 96,902,755 | 3,125,895 | |||||
| All time highs | |||||||||
| Oil | 1,519,037 | Bbls/D | 11/30/19 | ||||||
| Gas | 3,145,172 | Mcf/D | 11/30/19 | ||||||
Mike,
Although overdone as usual. I think it is largely wx forecast/model related. Why?
I'll compare Wed AM/0Z with AM/0Z of today. Maxar's forecast lost 5.2 HDD vs Wed and the Euro ens lost ~14 HDD. The GEFS did gain ~14 HDD as of 0Z today vs 0Z of Wed, but its 0Z today did lose 12 vs the 12Z of yesterday, its 6Z today lost another 4 HDD, and the 12Z GEFS today lost another 3 HDD. So, today's 12Z GEFS lost ~19 HDD vs yesterday's 12Z GEFS. So, its most recent trend had been quite a bit warmer.
Thanks much Joe!
Your numbers do show the increase slowing down after huge increases in July/August.
Gas production looks like its within 12% of the highs from November of last year.
Oil production would have a bit more to go to reach those highs, +24% from the Sept numbers that you showed, if my calculations are right.
Do you think that will happen?
Like you said, the rig count is not coming back very fast.
+++++++++++++++++++++++++++++++++++++++++++
We are still below the previous record low rig count in natural gas from 4 years ago......81 from August 2016.
https://ycharts.com/indicators/us_gas_rotary_rigs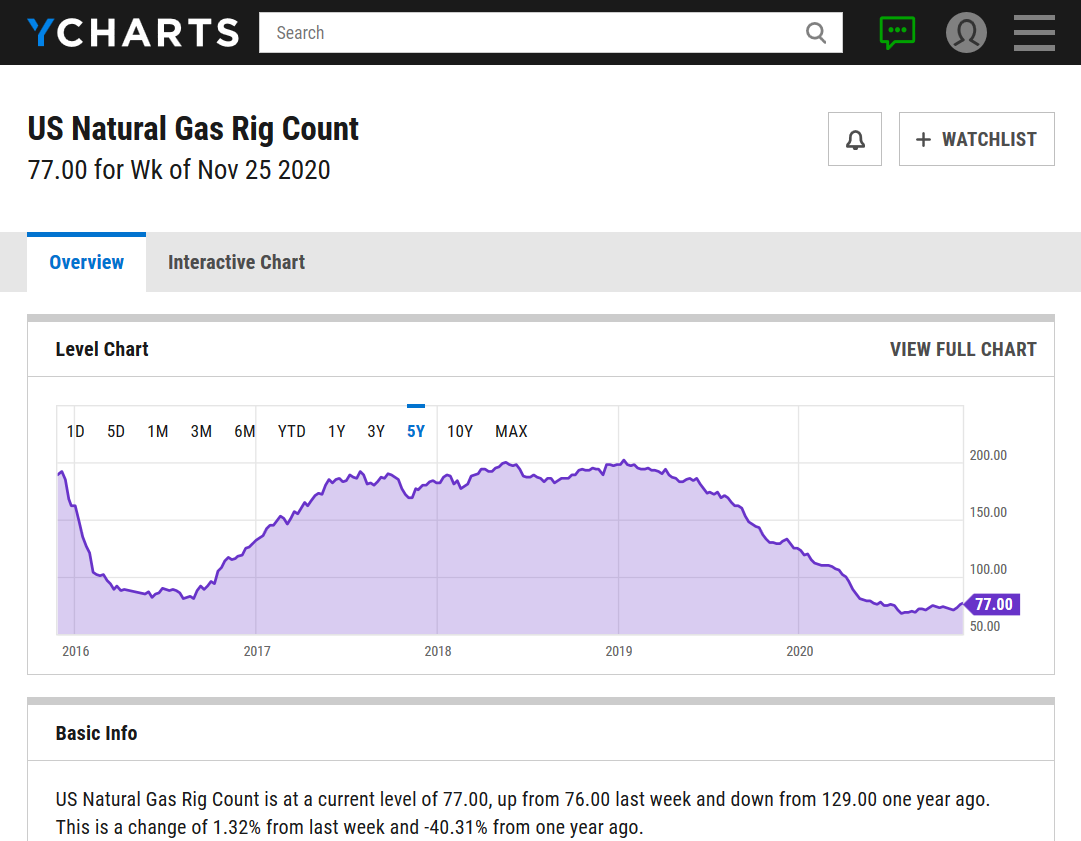
Thanks Larry,
I'm thinking that expectations for the extended forecasts to be mild for December played into it too..........though I'm not on board with that as the AO/NAO drop in week 2.
Lots of uncertainty though.

If I knew nothing about the weather today or anything else affecting natural gas right now........only could see the price chart and knew that it was natural gas and it was a Friday towards the end of November, I would predict elevated chances for a gap lower on Sunday Night.
This is what the market thinks based on its reaction today. Closing sharply lower, near the daily lows at the end of the week.
This is often the recipe for a gap lower in a market that starts off trading each week with more gaps lower or higher(outside the previous days range) then any other market that I trade.
The 18z GFS products were a bit milder, but that won't matter on Sunday.
The amount of uncertainty with this current weather pattern is extraordinarily high right now!
Some models/solutions shift us to much colder in early December, others warm it back up.
Mike:
At current rig count I don't see a way Bakken production for oil or gas gets back to the highs of Nov 2019. I doubt the current rate can be maintained. The only thing being drilled right now are those drill units where the entire infrastructure (fresh water lines, produced water lines, oil flow lines, gas flow lines, electric generation) has already been set up. Whats good for the oil business will be bad for the US consumer.
I'm not a finance guy but the shale co bust is coping with some significant problems some of which were self inflicted.
1) Painfully obvious the composite decline curves passed around wall street had inflated EURs. In the Bakken it was 1M Bbls recoveries. In the Permian it approached 2M Bbls per well. 10M #s of sand in the Frac could not push an EUR to the number they had "hoped for".
2) Couple 1) with over hyped drill unit density and you have a path to actually reduced EURs. The more wells you drill per unit does not determine the max recoveries. Down hole pressures, reservoir thickness/quality, and other factors all have to considered. For example, I am underneath (ORRs) the Temple and NW McGregor fields In Williams County ND. The best producer of 11 horizontal wells drilled 2010/2011 will cum 300K Bbls.
3) The overall demand for crude commands the headlines, however, I am seeing something deeper than just a general demand problem. The demand for different types of crude is causing chaos in commodity pricing. Light sweet crude which most of the shales produce is in huge surplus while the lower gravities are scarce. Refiners require both. Could see a huge differential (drop) for light sweet.
Goig to be difficult times for shale cos in the near future.
Thanks very much Joe!
Sometime in the last hour, they changed the map. Slightly warmer.

That's the update that they made around 2pm Central.
They only update it 1 time every day.
Maybe you still had the old one on your computer and you needed to hit the refresh button. That happens to me sometimes.
We opened a bit lower, 2.831, probably on that milder looking weather outlook, put in the low in the first minute at 2.823, then did a nice bounce to 2.896.
We actually have a few more HDD's than Friday but less than Saturday.
Lots of uncertainty on week 2 and beyond temps.
With a -AO/-NAO developing in week 2, we could end up colder than the current forecast/models.
There could be some pretty cold air developing in Central/Eastern Canada and a tight gradient to the south. So a slight change in the southern extent of the cold could mean a huge difference in temps in the US.
I have been saving copies of the maps as they have come out, although I didn't save the one from this afternoon. I should have. The one previous to this one, which was at 5pm this afternoon, had the "normal" line cutting through from the middle of New Mexico to the upper part of Illinois and into Michigan. This is the map after 8pm. They changed it.
"They changed it."
Mark,
The map you posted is the exact same one that I got just after 2pm CST earlier today.
I've been following their outlooks for decades and they have always only updated these extended maps one time/day. I've never seen it different. There have been times when it was delayed a bit.
This is how they define the release:
https://www.cpc.ncep.noaa.gov/products/predictions/610day/
"6-10 Day outlooks are issued daily between 3pm & 4pm Eastern Time. All forecasts issued on weekends are completely automated while all weekday outlooks are modified by the forecaster."
Today's update just after 2pm(3pm EASTERN) like every Sat and Sun was automated as they stated above.
When I go to the updated maps, early in the afternoon, I sometimes have to hit the refresh button for the new map to pop up because the old map will still be there.
Natural gas intelligence:
Natural gas futures were trading slightly higher early Tuesday as forecasters continued to point to a potential shift toward colder temperatures around the middle of the month. The January Nymex contract was up 1.1 cents to $2.893/MMBtu at around 8:45 a.m. ET. The European weather model trended milder overnight by showing less cold moving into…
metmike: The colder outlooks for mid-December had us sharply higher until the MUCH milder European model came out very early this Morning.
Story of the day

Tuesday marked a second day of small shifts along the natural gas futures curve, with flip-flopping in the latest weather models taking a toll on prices. Even with export demand hitting a fresh high and supply taking a hit, the January Nymex contract fell as much as 4.9 cents before going on to settle only…
metmike: Potential for -AO/-NAO along with cross polar flow in week 2 dumping frigid air into Canada, has the bulls juiced up, so that every time a model increases HDD's and shows a colder solution, we spike higher. However, we are also seeing the take back all those gains when solutions don't show much of that cold getting into the US. There will be a pretty big temp gradient with this new pattern, so small shifts north or south in the cold air count for a ton of HDD's!
I've been leaning towards the colder models for quite some time now.
Natural gas futures climbed in early trading Wednesday as models continued to tease colder temperatures arriving around the middle of the month. The January Nymex contract was up 3.3 cents to $2.913/MMBtu at around 8:40 a.m. ET. Trends in the major weather models were mixed over the previous 24 hours, Bespoke Weather Services said early…
metmike: Models overnight were actually less threatening with the mid-December cold to me, so we couldn't hold on to the gains. We have cross polar flow dumping frigid air into Canada but overnight, they keep more of it locked up to our north at the end of the period, which is when the threat for it to get into the US becomes elevated.
I still don't put extra emphasis on the day 14-6 maps vs earlier. Days 14-6 change so often due to unreliability. That's why I think analyzing the entire 14-16 day picture/the # of DD for that entire period is more relevant than just focusing on the end of the runs, which typically jump around from run to run.
Different strokes for different folks.
Thanks Larry, I agree but I really only care about what the market trades.
Today was about as powerful of evidence that you'll ever get that it mattered to traders. The 12z GFS ensemble came out much milder late in week 2 and CRUSHED natural prices after that. We can see that below, with the yellow line, being the one for Heating Days for that 12z run that flipped to milder at the end of the period. One only needs to look at this and see the response with prices after the release.
7pm: I replaced the earlier graph with the one from 6 hours later that also shows the 18z GFS ensemble HDD's in purple...even milder than the bearish, end of week 2 milder change that crashed the market during the day session. So we spiked much lower, to new lows immediately after that came out this evening. Is this what will happen? It's mostly late week 2. The market is believing it and I only want to trade what the market believes because thats the only thing that determines the price. Late week 2 clearly mattered to the market today at least.
The 2nd map, the purple line is the European Ensembles from 12z that showed the same thing a couple of hours later and the price plunge accelerated. You will note on that map, that week 1 was actually COLDER(as was the GFS in the early time frame) but the market completely shrugged that off and traded entirely on the much milder week 2 solution.
.png)
.png)
If that doesn't impress you, I can show you the actual milder weather maps that went with those lower HDD's above.
I believe you, see what you're saying about the runs you pointed out , and realize this happens sometimes, but I've also seen it pay the most attention to earlier days toward the middle on many runs. The market isn't that black and white imo. Sometimes it mainly cares about late, other times mainly middle, etc. Sometimes about equal. Sometimes it doesn't care at all or it is trading mainly on a nonwx factor. Often it overdoes moves. So, I like to carefully consider the whole run.
Me too!
I suggested a couple days ago that it would be aggressive to think we may not see $3 NG prices for the rest of the winter. Now, I'm thinking it's not so aggressive.
Thanks Jim,
The threat for mid December cold has diminished greatly the last 36 hours. Models keep the cold locked up in Canada late in week 2 as the AO and NAO come back up to 0 from - in the forecast and the PNA drops to 0 from the strongly +PNA regime.
So mid December could feature record warmth instead of frigid weather. Position of an upper low in Canada will make all the difference.
Latest Release Dec 03, 2020 Actual-1B Forecast-12B Previous-18B
https://www.investing.com/economic-calendar/natural-gas-storage-386
| Release Date | Time | Actual | Forecast | Previous | |
|---|---|---|---|---|---|
| Dec 03, 2020 | 10:30 | -1B | -12B | -18B | |
| Nov 25, 2020 | 12:00 | -18B | -18B | 31B | |
| Nov 19, 2020 | 10:30 | 31B | 15B | 8B | |
| Nov 13, 2020 | 10:30 | 8B | -3B | -36B | |
| Nov 05, 2020 | 10:30 | -36B | -26B | 29B | |
| Oct 29, 2020 | 09:30 | 29B | 37B | 49B |
![]()
for week ending November 27, 2020 | Released: December 3, 2020 at 10:30 a.m. | Next Release: December 10, 2020
-1 BCF BEARISH!
| Working gas in underground storage, Lower 48 states Summary text CSV JSN | |||||||||||||||||||||||||
|---|---|---|---|---|---|---|---|---|---|---|---|---|---|---|---|---|---|---|---|---|---|---|---|---|---|
| Historical Comparisons | |||||||||||||||||||||||||
| Stocks billion cubic feet (Bcf) | Year ago (11/27/19) | 5-year average (2015-19) | |||||||||||||||||||||||
| Region | 11/27/20 | 11/20/20 | net change | implied flow | Bcf | % change | Bcf | % change | |||||||||||||||||
| East | 934 | 934 | 0 | 0 | 892 | 4.7 | 871 | 7.2 | |||||||||||||||||
| Midwest | 1,122 | 1,133 | -11 | -11 | 1,043 | 7.6 | 1,053 | 6.6 | |||||||||||||||||
| Mountain | 240 | 242 | -2 | -2 | 201 | 19.4 | 212 | 13.2 | |||||||||||||||||
| Pacific | 318 | 320 | -2 | -2 | 288 | 10.4 | 311 | 2.3 | |||||||||||||||||
| South Central | 1,326 | 1,312 | 14 | 14 | 1,172 | 13.1 | 1,202 | 10.3 | |||||||||||||||||
| Salt | 368 | 356 | 12 | 12 | 312 | 17.9 | 342 | 7.6 | |||||||||||||||||
| Nonsalt | 958 | 956 | 2 | 2 | 859 | 11.5 | 861 | 11.3 | |||||||||||||||||
| Total | 3,939 | 3,940 | -1 | -1 | 3,596 | 9.5 | 3,649 | 7.9 | |||||||||||||||||
Totals may not equal sum of components because of independent rounding. | |||||||||||||||||||||||||
Working gas in storage was 3,939 Bcf as of Friday, November 27, 2020, according to EIA estimates. This represents a net decrease of 1 Bcf from the previous week. Stocks were 343 Bcf higher than last year at this time and 290 Bcf above the five-year average of 3,649 Bcf. At 3,939 Bcf, total working gas is within the five-year historical range.
For information on sampling error in this report, see Estimated Measures of Sampling Variability table below.

Note: The shaded area indicates the range between the historical minimum and maximum values for the weekly series from 2015 through 2019. The dashed vertical lines indicate current and year-ago weekly periods.
These were the temperatures for the period on this last EIA report. Very mild for the eastern 2/3rds of the country, especially in the South.
Story of the day Natural Gas Intelligence
“Overnight, the January/February front of the curve spread slipped to contango. Natural gas heating fuel slipping to contango before winter could even get underway,” Yawger said.
Much of the decline may be attributed to speculative traders unwinding their long positions. Several analysts have noted recent Commodity Futures Trading Commission data, which showed net longs dropping more than 20% to 65,975 contracts. This is down significantly, Yawger said, “but still large enough to do damage if everybody gets out at once, though I am guessing a significant chunk got out Thursday.”
EBW Analytics Group agreed that “machine-driven” trading played an important role in Thursday’s price collapse, but so did the bearish risks to the latest government storage data. The firm pointed out that while the consensus forecast was for a 10-15 Bcf draw, some predictions were for a small single-digit build.
The Energy Information Administration (EIA) did not report an injection into storage for the week ending Nov. 27, but said inventories fell by a scant 1 Bcf. This compares with last year’s 22 Bcf withdrawal and the five-year 41 Bcf average draw.
Bespoke Weather Services chief meteorologist Brian Lovern was looking for a pull around 18 Bcf and said “it appears there was just a good deal more holiday impact than we gave credit for.
“Balance wise, this number is very weak, even factoring in the holiday, but it is worth noting that we are seeing improvements in the data this week, suggesting that future numbers will be back tighter,” Lovern said.
Broken down by region, the Midwest reported an 11 Bcf withdrawal from storage, while the Mountain and Pacific regions each notched a 2 Bcf decline in inventories, according to EIA. The East reported no change in stocks, and the South Central added a whopping 14 Bcf. This included 12 Bcf into salt facilities and 2 Bcf into nonsalts.
Total working gas in storage as of Nov. 27 stood at 3,939 Bcf, which is 343 Bcf higher than year-ago levels and 290 Bcf above the five-year average, EIA said.
Yawger said the next big event for the market would be the March/April so-called “widow-maker” spread switching from backwardation to contango. The spread sat at 4.2 cents on Thursday “and is threatening to switch to summer over winter before the first snow even gets here.”
Last year, the 2020 version switched to contango on Dec. 31, according to Yawger, with spot prices eventually trading to a 25-year low of $1.432 on June 26. Henry Hub cash on Thursday averaged $2.450.
EBW analysts said despite the warmer trends in the latest weather data, it was important for the market not to lose track of the big picture. The milder weather expected in Week 2, which is likely to further depress natural gas cash prices, is not nearly as warm as weather was in November, it said. Furthermore, degree days in Weeks 3 and 4 still are expected to be “reasonably close” to normal, raising space heating demand to its highest point this winter.
Meanwhile, liquefied natural gas exports remain strong, and there are early signs that production is starting to weaken, albeit slightly. If these trends hold, cash prices are likely to bounce back strongly with large withdrawals in December, EBW said.
Since traders focus heavily on whether near-term weather is slightly colder or warmer than normal, it may take time for the big picture to become fully apparent, according to the firm. “As January progresses and storage continues to decline, however, the structural supply deficit in the U.S. market is likely to become increasingly apparent, driving February and the remainder of the 12-month strip higher.”
Steep Cash Losses
With chilly weather relegated to the central United States, including into North Texas, spot gas prices came crashing down across the country Thursday as milder weather set up elsewhere.
Thanks for another Thursday! Here's your latest weather:
https://www.marketforum.com/forum/topic/62185/
The threat of mid-December cold has plunged the last 36 hours which is crushing ng prices.
Machine trading. Got to admit, that there have been times when it has helped me make a tremendous amount of money. Still don't agree with it. But one must adapt. I doubt machine trading will realize that the price is too low on it's own. Got to be programmed by humans.
Trade the breaks.
NG is up pretty strongly today and it has zero to do with weather changes. Rather, it has mostly to do with it having plunged way, way too much in recent days due to the as usual overreacting to either small HDD changes and/or highly unreliable late week two model changes. Yesterday, NG was essentially saying winter was already practically over, which is absolutely asinine to assume on December 3rd, the very start of winter!!
I agree that Thursday was extremely overdone.
Looking at the price, you would think that the models went from near record cold to above temps overnight.
I think massive large spec longs recently had much to do with that. When they want out by selling and there isn't enough buying size/volume to accommodate their massive selling close to the market, they have to force the market lower and lower to get the orders filled.
I just checked volume and that was it. Previous to yesterday, the highest volume day for the NGF was 134,000. Yesterday was 250,000! Big funds liquidated/unloaded their spec longs all at the same time on Thursday.
The weather is actually very interesting.
Earlier this week, the AO/NAO was predicted to go negative and keep falling, which suggested it turning sharply colder in mid December.
Yesterday saw a pretty big change as the -AO/-NAO regime was predicted to just be very short lived and those indices were shown to get back to 0 at the end of 2 weeks and we basically took what looked like a pattern change to much colder in mid December to one that looked extremely mild. There is cross polar flow into Canada and Canada will fill up with frigid air in week 2 because of that.
So a small change in the flow pattern in Canada to the US could mean a 30-40 temperature difference in the US(between very mild and frigid).
The AO/NAO being more favorable today(negative) for transport of air from high latitudes to mid latitudes has reintroduced the risk for frigid air to shift from Canada to the US that was almost completely taken out yesterday.
The 2 week weather model maps and HDD do not show this at all. This is entirely based on the -AO/-NAO being superimposed on that pattern to cause future model updates to get colder. This is actually a rule of thumb that meteorologists can use when the indices are especially powerful to outforecast the models.
We are not in that place right now with the AO/NAO being weakly negative and not that impressive.......yet but they dropped overnight and this is just a potentially bullish item for temperatures in mid December and beyond. If temps were not going to be so frigid in Canada, the potential would not be so great.
Latest, updated graph/forecast for AO and NAO and PNA here, along with my description earlier this week that follows what was stated above.
https://www.marketforum.com/forum/topic/62185/#62200
++++++++++++++++++++++++++++++++++++++
https://www.marketforum.com/forum/t
Previous analysis, with the latest day at the bottom for late week 2 period.
Discussions, starting with the oldest below.
November 26: Some pretty extreme values recently. +++AO and ++NAO. This has been a factor in the mild weather recently. Both plunge to -AO/-NAO at the end of 2 weeks. Which is usually a COLD pattern and potentially very cold if it amplifies. A -AO/-NAO is favorable for transporting air from high latitudes to mid latitudes. Impressive ++PNA drops to +PNA. This is a HUGE factor with the upcoming cold being able to penetrate deeply south.
November 30: AO/NAO plunge from the recent strong positives to negative which favors a pattern change to colder but at the end of the period the spread is pretty wide and gives us great uncertainty. The solidly positive PNA drops close to 0 by the end of 2 weeks.
December 3: Recent +AO/+NAO that caused a mild November will drop negative but unlike the forecast from several days ago, it bounces back to zero, instead of staying negative, which will reduce chances for the frigid air in Canada to be flushed from high latitudes to the mid latitudes in mid December. The recently impressive ++PNA will drop to zero and also result in less push of cold air into the southlands.
Through 6Z as 12Z ensembles are not yet out that far: I don't see much change in the models since 24 hours ago as they still look about as mild for much of the US for midmonth as they did yesterday. But they could be wrong and change as they often do. NG us up today due to a dead cat bounce mainly and not due to weather.
The market is almost always smarter than the models.
Everybody gets the models. Interpretation of the pattern beyond what the models show and pattern recognition, especially when there is a pattern change that takes the models a few days to catch on to is what often leads natural gas prices ahead of the models. From the previous page:
"The 2 week weather model maps and HDD do not show this at all. This is entirely based on the -AO/-NAO being superimposed on that pattern to cause future model updates to get colder. This is actually a rule of thumb that meteorologists can use when the indices are especially powerful to outforecast the models.
We are not in that place right now with the AO/NAO being weakly negative and not that impressive.......yet but they dropped overnight and this is just a potentially bullish item for temperatures in mid December and beyond. If temps were not going to be so frigid in Canada, the potential would not be so great."
"Through 6Z as 12Z ensembles are not yet out that far: I don't see much change in the models since 24 hours ago as they still look about as mild for much of the US for midmonth as they did yesterday."
The jumpy 12z GFS had +13HDD's vs the previous run(almost as many as earlier this week) as it was able to tap into the southern part of that frigid air mass in Canada without a major pattern change and dump it pretty far south.
I suspect the Ensemble mean will not show anything close to this extreme. This is +20 HDD's vs the 0z run.
However, this is what happens when you have a -AO/-NAO and frigid air in Canada..........the risk of models turning much colder like this is elevated.
Mike,
The GFS operational is pretty meaningless to me past day 9. They jump around way too much after then and even before then to some extent. So, I much prefer to use the ensemble runs to get a good feel, especially in week 2. The ensembles are what I’m talking about when I talked about how it looked through 6Z today vs yesterday .
I agreed with that before you even said it ..........referring to the GFS as jumpy and with expectations that the more reliable Ensemble will not have anything like this.
However, I would not consider it useless because its as good as any individual solution in the ensemble if not better and deserves at least some weighting/consideration, especially considering "potential" outcomes with a transient pattern like this one coming up.
If/when the ensemble comes out completely different, then we should consider it an outlier.
Only if several other individual ensemble solutions have the same thing should we take it serious.
BTW, I used the term "jumpy" to describe the GFS operational model earlier because thats the verbiage I've seen you use to describe it so I was serious about agreeing with you before you said that.
NG is up 10 cents now and that has almost nothing to do with weather changes. The 12Z GEFS remains quite mild late in its run to the end and overall HDDs hardly changed. It is instead a continuation of the much overdue dead cat bounce.
Agree still that it has nothing to do with the 2 week HDD's on model runs and yesterday was way overdone!
Trading NG or any commodity is very difficult no matter what one uses as the basis on what to trade whether it be weather or something else. The reason is that one never knows how much, if any, it will pay attention to the factor being traded on as well as the timing when it moves on that factor if it ever does. Then there’s the complication of unrelated factors muddying up the waters.
Here is the last 12z run of individual members of the Canadian ensemble.
I'm using this one because it looks pretty impressive with the polar vortex in Canada. Not because this is the best model or that I believe it but to show the model with the highest threat and how big a deal this could potentially be. Not will be but is a legit threat.
edit: To clarify even more on the above and agree with Larry, the Canadian model can sometimes show a cold bias.
That very deep upper level low is the Polar Vortex. Its almost certain to be in Canada, with cross polar flow and frigid air widespread across the country to our north. Several solutions have it or a big chunk of it displaced unusually far south and close enough for some of the frigid air to plunge deeply into the US. The majority and average do NOT have that. A -AO/-NAO increases the chances a bit for the colder solutions in a situation like this to verify.
No way will I have a position over the weekend. The forecast Sunday Night for the late periods could vary by 40 degrees and it all depends on the location of the Polar Vortex below.
What do you think Larry?


Forecasts for global GEM, control (GEM 0) and the 20 ensemble members
Here is the average for all of those ensemble solutions.
A couple of things to note:
1. The 504 thru 528 dm contours in W.Canada show a streamline gradient/channel and that is strongly cross polar, so the air coming into Canada, will be from the coldest source on the planet.
2. The position of the polar vortex is around the N.Hudson Bay but streamlines underneath it, are feeding cold down to the US border. Cold dense air masses at the surface have lots of momentum and at this time of year, usually go much farther south than the upper levels or location of the jet stream is transporting air. So we have almost zonal flow across the northern tier of the US but you can bet that any frigid air mass at the surface with some push south from Canada will UNDERCUT that zonal flow and plunge many hundreds of miles south of the US border, possibly over 1,000 miles farther south but then greatly moderating, especially if there is no snow cover.
3. Which is another big element to consider........snow cover. There looks to be an increased chance for snow events in this environment, with the massive temp gradient favorable for that to set up.
4. Though much of the US has a look of zonal, west to east streamlines, the big picture shows them sagging south a bit in the US, compared to the Pacific and Atlantic heights, this drop is some upper level troughiness with weak negative anomalies and favorable for the jet stream/streamlines to lower more and deepen the trough or allow the Polar Vortex to drop farther south. The opposite would be if we had upper level ridging in the US that makes it a done deal for being mild. So with this pattern, if we end up mild, we luck out because the Polar Vortex receded farther north. Any farther south than this with the PV........even a little bit and temp forecasts in the US plunge very quickly.
384h GZ 500 forecast valid on Dec 20, 2020 12UTC

As Larry has commented on this many times, the tone of the last couple of hours of trading is often set by the Euro Ensemble model.
It's come in just a tad milder than the previous solution, especially at the end so we gave back half of the gains from less than an hour earlier.
I have no idea where we go now but would be surprised if we can sell off a great deal more.
Hey Mike,
1. Canadian ensemble: Because this has been the least accurate of the 3 and it has had a strong cold bias, it doesn’t have much statistical significance to me, especially out at day 16. Regardless, because we’re in a moderate to strong La Niña along with a very warm W Pacific and projections for the MJO to be in phases 5 or 6 then, even if the polar vortex ends up positioned far enough south to get very cold air into the US, it would be hard to get that cold air to come deeply enough down to strongly affect the high pop areas in the Mid Atlantic, lower Midwest, and SE US. The wild card would be a continued -AO/-NAO.
2. Although I maintain that wx had nothing to do with the big gains earlier, I agree with you that NG likely sold off 5 cents or so mainly due to the milder late 12Z EPS.
Sounds like we agree on almost everything. I also agree that the Canadian model has a cold bias and mentioned that this was actually why I showed it(why the cold threat is easiest to see on this model).
I just added this to make that even more clear:
edit: To clarify even more on the above and agree with Larry, the Canadian model can sometimes show a cold bias
I think the key will be the AO/NAO signal.
We could have frigid weather in Canada.
A -AO/-NAO as Larry knows, is very favorable for flushing air in the higher latitudes to the middle latitudes. Sometimes, the origin of the air masses in the higher latitudes/Canada might not be that cold and so the kind of cold that drops south into the US in a -AO/-NAO regime is just moderate cold.
In this case, there COULD BE some frigid air in place, if cross polar flow develops.
That said, the GFS Ensemble has the anomalies in the wrong places for ideal cold air delivery at 2 weeks..........and so its solution is very mild. It does have very cold air in Alaska/Western Canada which would be a source of major cold if the slight negative anomaly in the East would amplify a tad and potentially solidify a -NAO/-AO.
metmike: The jumpy 18z GFS operational model lost 24 HDD's vs the previous outlying cold run and is now the warmest GFS run of the week.
https://www.marketforum.com/forum/topic/62185/
December 5 update:
AO and NAO dropped a bit more but the spread and disparity in model solutions is massive
and the difference that it will make to temperatures later in December is stratospheric.
Canadian model is potentially very cold(with its cold bias). European model is shifting in that direction. The GFS disagrees strongly and is very mild.
December 6 update: Most models keep the frigid air locked up in Canada, which means very mild in the US. AO/NAO has an extremely wide range in solutions. As long as some hang on to the solidly negative AO/NAO(minority) there is still a chance(waning) that it could turn sharply colder. The Canadian model has turned milder, towards the the very mild GFS.
December 7: There won't be much cold with anomalies like this:
A significant warmer shift in forecasts over the weekend sent natural gas futures plunging early Monday. The January Nymex contract was down 17.9 cents to $2.396/MMBtu at around 8:45 a.m. ET. For the Dec. 17-21 time frame, days 11 to 15 of the outlook period, Maxar’s Weather Desk said its latest forecast trended warmer versus…
December 7, 2020
metmike: Colder 12z Euro Ensembles gave us a late day(after 1pm) bounce. It was +9 HDD's vs the oz solution, previous one 12 hours earlier.
My old seasonal price charts that haven't been updated in over a decade have a weak ng seasonal flipping to positive during the first half of December. The signal was strongest in the back months however.
After suffering heavy losses in the previous session, natural gas futures recovered a few cents in early trading Tuesday amid mixed trends in forecasts overnight. Coming off a 16.9-cent sell-off Monday, January Nymex futures were up 3.8 cents to $2.444/MMBtu at around 8:50 a.m. ET. Trends in the overnight guidance were mixed, with the American…
metmike: Models, especially the GFS products look very mild in week 2 with the frigid air locked up in Canada(high confidence that Canada will fill up with frigid air later this month).
HOWEVER, as long as the AO and NAO are predicted to be negative in week 2, there is a legit threat that the models are underestimating the amount of cold headed towards the US. Superimposing a -AO/-NAO on to model solutions in week 2 make them colder and increase chances of them turning colder.
metmike: Tuesday 12z update: The cold biased Canadian model has turned sharply colder because of several solutions that shift the polar vortex a couple thousand miles farther east than the other ones and where the GFS ensembles has it. This actually is possible in a -NAO/-AO regime, so I won't rule it out.
NG at least seems to have risen late quite a bit once again on a colder 12Z EE by ~ 7 HDDs. But that's just an educated guess. It certainly is again cheap enough for a bounce due to whatever reason(s).
Thanks Larry,
I noticed that too.