USDA report June 30, 2020
13 responses | 0 likes
Started by metmike - June 29, 2020, 4:43 p.m.

@kannbwx

Analysts see all U.S. #wheat acres up slightly from March intentions but down 1% from 2019. Spring wheat is seen down a hair from March and below last year, but winter and durum acres are expected to rise a bit from intentions.

Image


Comments
By metmike - June 29, 2020, 4:44 p.m.
Like Reply

@kannbwx


Analysts see cotton+small grain acres down 2% from March but up 2% from 2019 and up 4% from the 5yr avg. #Cotton acres seen down 4% from March, and the trade estimate would be the smallest cotton area in 3 years.

Image


By metmike - June 29, 2020, 4:44 p.m.
Like Reply

@kannbwx


Analysts see U.S. #corn plantings at 95.2 million acres, down 1.8% from March intentions. That would be the largest % fall from March to June since 1995. 

#Soybeans seen up 1.4% from March at 84.7 mln acres. Soy acres rose March-June every year from 2012-2018 by an avg of 1.6%.

Image


By metmike - June 29, 2020, 4:46 p.m.
Like Reply

Trade estimates for U.S. June 1, 2020 stocks would be... #Corn 4-year low down 5% YOY

 #Soybeans 2nd highest ever down 22% from 2019's record 

#Wheat4-year lowdown 9% YOYImage


By metmike - June 30, 2020, 11:54 a.m.
Like Reply

@kannbwx


A lot to take in here: summaries of June stocks & acreage report day results for #corn, #wheat & #soybeans since 2005, along with the price response. Many observations to make, incl. analysts on a 4yr streak of under-guessing corn acres. They nailed soy 15-18, but missed 19.

ImageImageImage

By metmike - June 30, 2020, 11:56 a.m.
Like Reply

Get ready for the price fireworks in 4 minutes (-:


By metmike - June 30, 2020, 12:03 p.m.
Like Reply

Easy to tell the report was pretty BULLISH!

More in a short while

By metmike - June 30, 2020, 12:17 p.m.
Like Reply

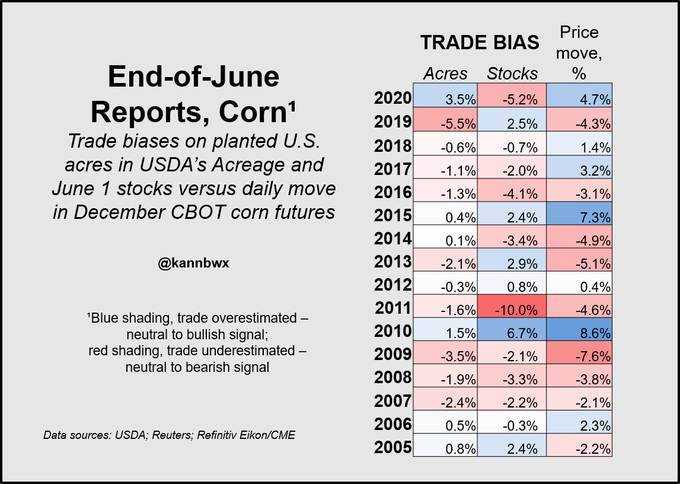
Mega bullish surprise for corn...........and with funds having a near record short. If we have a dome that parks over the cornbelt in July.......prices have tremendous upside potential.

https://release.nass.usda.gov/reports/acrg0620.txt


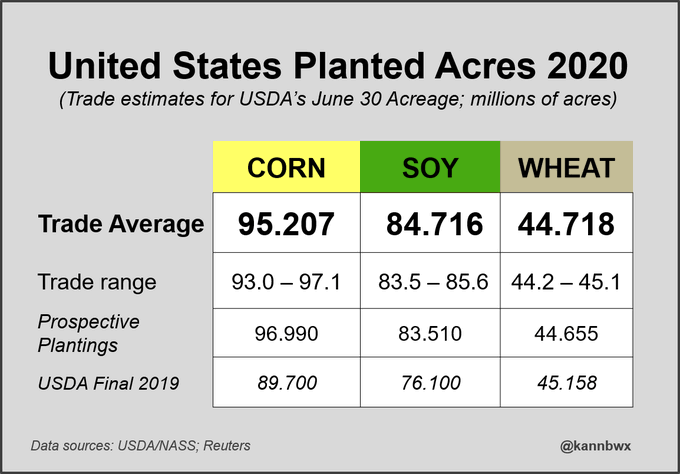
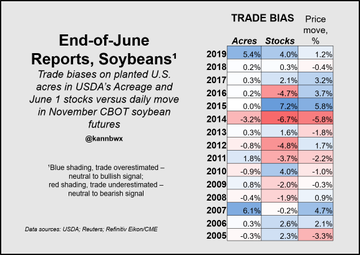
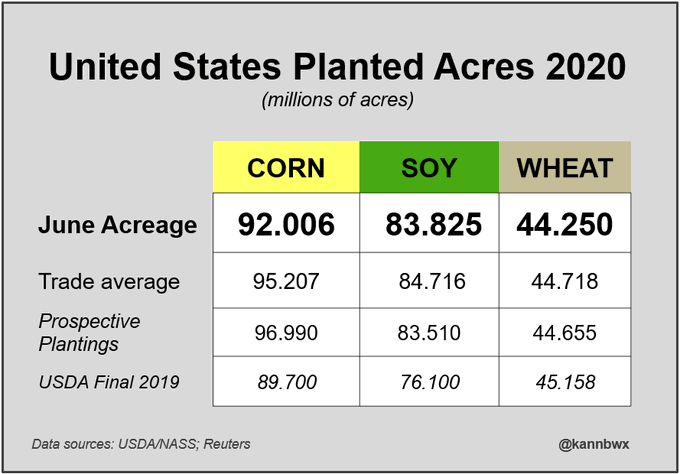
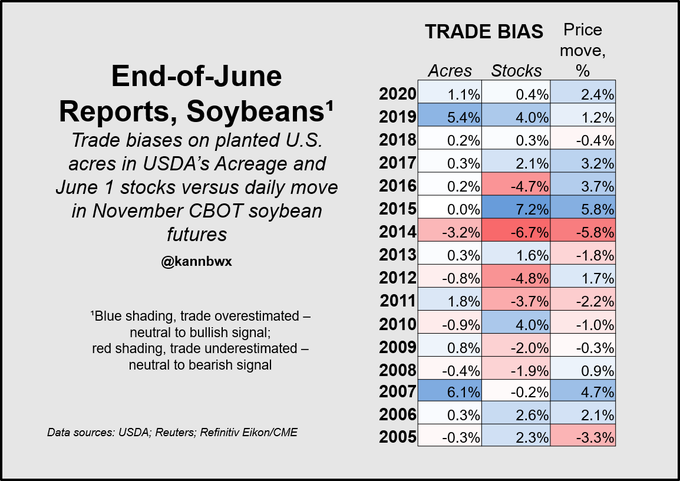
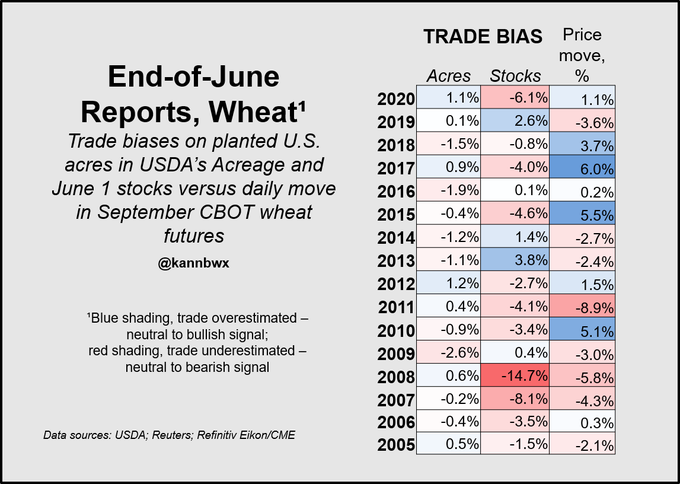
U.S. #corn acres seen at 92 mln, down 5 mln from March intentions. #Soybeans up less than expected and #wheat acres are down from March.

Image

By metmike - June 30, 2020, 1:35 p.m.
Like Reply

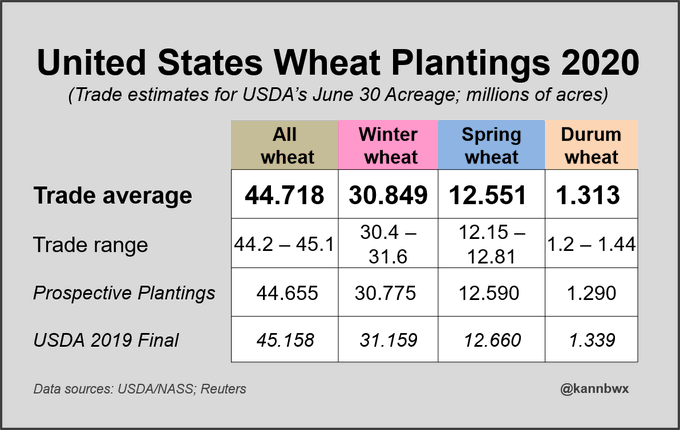
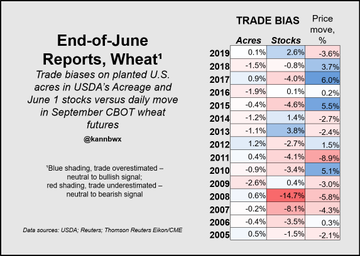
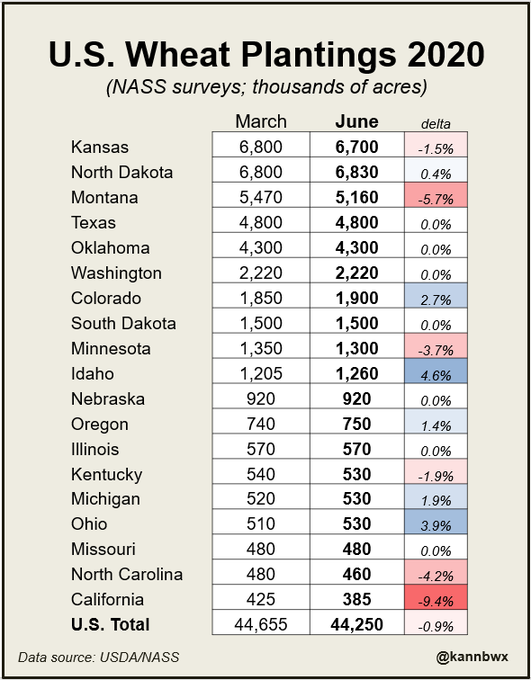
U.S. all #wheat area is down 1% from March intentions. Acres rose from March in North Dakota, making it the top wheat planter this year. Plantings were lower than in March for Kansas and Montana, the #2 and #3 states.

Image

By bowyer - June 30, 2020, 1:42 p.m.
Like Reply

Didn't see that coming !

By metmike - June 30, 2020, 1:54 p.m.
Like Reply

Your crop just increased in value by a very large amount! 

Congrats, let's hope it continues.

By metmike - July 1, 2020, 1:03 a.m.
Like Reply


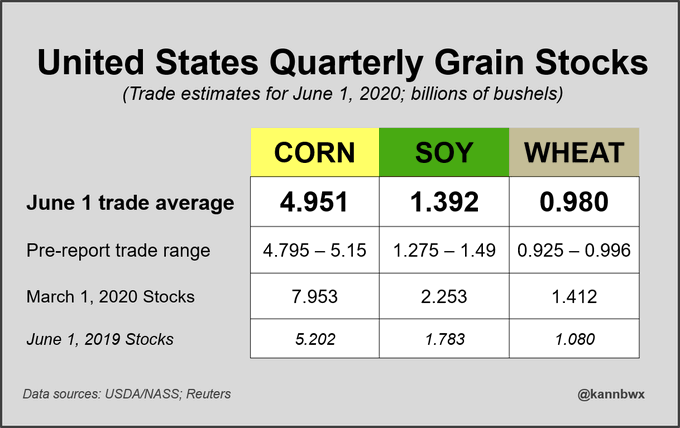
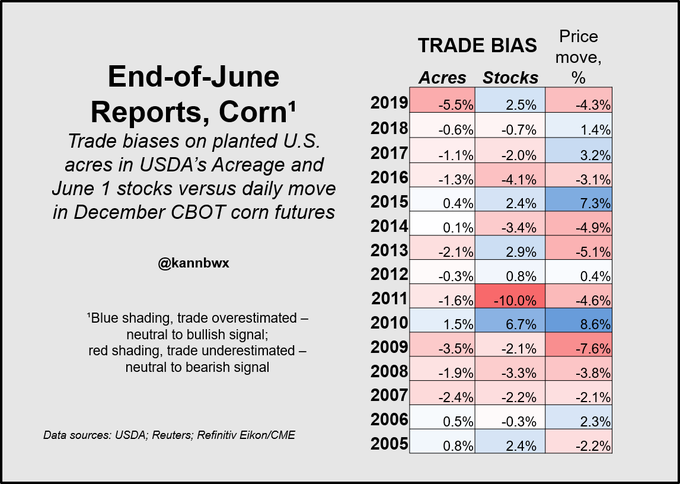
Analysts had their worst miss of June 1 #corn stocks since 2011, as they were 273 mln bushels too low heading into Tuesday's reports. But the price action followed acres, which the trade over-guessed by the largest amount since at least 2005.

Image


U.S. #corn plantings fell by 5.1% between USDA's March and June surveys. That is by far the largest move in either direction in the Freedom to Farm era (1996-present). That decline tops 1995 (-4.4%) and is the largest for March-June since 1983 (-13.6%).

Image


Interesting note about the 1983 decline in #corn acres from Prospective Plantings to the June Acreage: the June number was pretty dead on to the final. Acres rose 0.1% from the Acreage survey into the final number.
By metmike - July 1, 2020, 1:04 a.m.
Like Reply


Analysts continued their relatively bullish Acreage and June 1 stocks streak for #soybeans, but they under-guessed June 1 #wheat stocks by 6.1%, their largest miss since 2008.

ImageImage


By metmike - July 8, 2020, 1:46 p.m.
Like Reply

#Brazil's Conab slightly reduced the country's #corn crop, mostly on a smaller second harvest. #Soybeans increased about 0.5 mmt.

 Soy exports are seen at or above 80 mmt, but still no sign of a full soybean balance sheet (has been missing all year).

Image