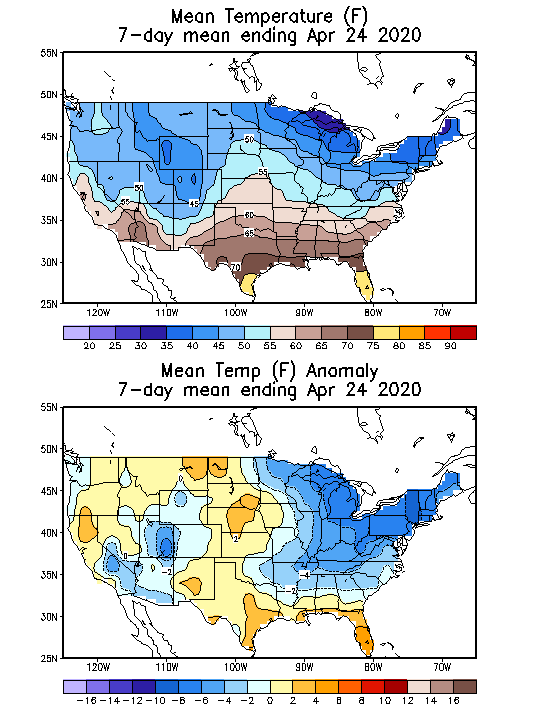
NG opened up sharply. One important reason may very well be the significantly colder model consensus at 12Z today vs 12Z Fri:
12Z Euro ens has 9 more HDD with a drop of only 1 CDD
12Z GFS ens has 10 more HDD with a drop of only 1 CDD
It isn't up due to the stock markets, which are pretty sharply down. Crude is down pretty sharply but NG's relationship with crude seems to vary a lot from day to day. On the one hand, lower crude tends to correlate to a drop in LNG exports. OTOH, lower crude tends to mean less domestic crude production, which tends to lead toward less domestic NG production since they often come out together, especially in the Permian Basin.
Thanks for getting us started with the new week/month!
I agree that the already cold forecast for this week into early............adjust that into possibly all of next week got even colder. Wouldn't be surprising to see record lows for numerous different mornings, starting later this week, going into much of next week.
However thought that HDD's would matter in May!
It looks like from eyeballing the charts, that CDD's seasonally pass up HDD's(that have been dropping since mid Jan) on around May 10th.
We actually had some decent early season CDD's from the heat out West to the Plains recently but this is going away as we type.
Chilly blasts on the way!
Here's your Sunday weather: https://www.marketforum.com/forum/topic/51586/
![]()
Last Thursday's report
for week ending April 24, 2020 | Released: April 30, 2020 at 10:30 a.m. | Next Release: May 7, 2020
+70 BCF
That's a huge injection for April with so many HDD's but it was expected.
| Working gas in underground storage, Lower 48 states Summary textCSVJSN | |||||||||||||||||||||||||
|---|---|---|---|---|---|---|---|---|---|---|---|---|---|---|---|---|---|---|---|---|---|---|---|---|---|
| Historical Comparisons | |||||||||||||||||||||||||
| Stocks billion cubic feet (Bcf) | Year ago (04/24/19) | 5-year average (2015-19) | |||||||||||||||||||||||
| Region | 04/24/20 | 04/17/20 | net change | implied flow | Bcf | % change | Bcf | % change | |||||||||||||||||
| East | 405 | 400 | 5 | 5 | 271 | 49.4 | 306 | 32.4 | |||||||||||||||||
| Midwest | 506 | 493 | 13 | 13 | 283 | 78.8 | 373 | 35.7 | |||||||||||||||||
| Mountain | 103 | 96 | 7 | 7 | 74 | 39.2 | 117 | -12.0 | |||||||||||||||||
| Pacific | 218 | 210 | 8 | 8 | 148 | 47.3 | 224 | -2.7 | |||||||||||||||||
| South Central | 979 | 941 | 38 | 38 | 652 | 50.2 | 830 | 18.0 | |||||||||||||||||
| Salt | 314 | 301 | 13 | 13 | 218 | 44.0 | 259 | 21.2 | |||||||||||||||||
| Nonsalt | 664 | 640 | 24 | 24 | 434 | 53.0 | 571 | 16.3 | |||||||||||||||||
| Total | 2,210 | 2,140 | 70 | 70 | 1,427 | 54.9 | 1,850 | 19.5 | |||||||||||||||||
Totals may not equal sum of components because of independent rounding. | |||||||||||||||||||||||||
https://www.investing.com/economic-calendar/natural-gas-storage-386
Latest Release Apr 30, 2020 Actual 70B Forecast 69B Previous 43B
| Release Date | Time | Actual | Forecast | Previous | |
|---|---|---|---|---|---|
| Apr 30, 2020 | 10:30 | 70B | 69B | 43B | |
| Apr 23, 2020 | 10:30 | 43B | 39B | 73B | |
| Apr 16, 2020 | 10:30 | 73B | 64B | 38B | |
| Apr 09, 2020 | 10:30 | 38B | 24B | -19B | |
| Apr 02, 2020 | 10:30 | -19B | -24B | -29B | |
| Mar 26, 2020 | 10:30 | -29B | -25B | -9B |
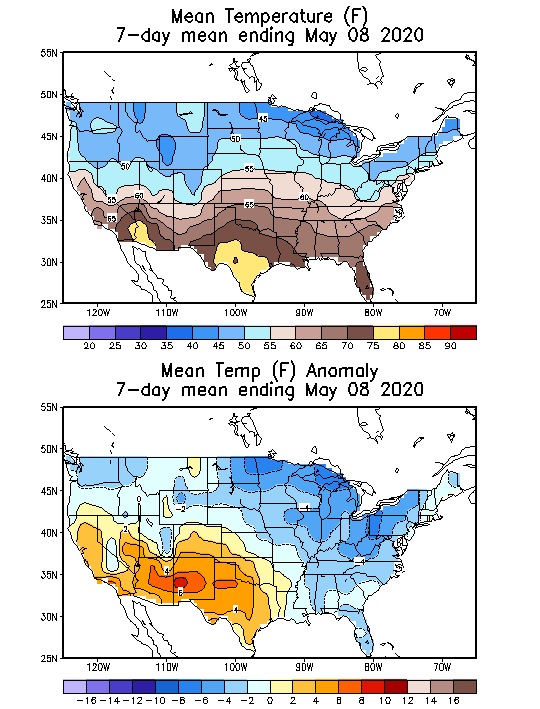
7 day temps for that report:
7 day temps for this Thursday's report:
Keen insight from an experienced veteran in the natural gas business:
By joelund - April 30, 2020, 11:12 a.m.
Since I just caught a break...thought I would give you the Bakken perspective to help answer some of your question. Down to 31 Rigs in the Bakken and I have 4 of them. My TX relief never showed. Local rig count dropping by about 5 a week.
Re your questions:
Oil and gas bs is the same business. Think of it as a well producing a single hydro carbon stream with oil, nat gas , nat gas liquids, and water all combined. Once you get to surface with the "stream" there are various processes of separation of the components. There are exceptions to this however this is the norm in the Shale. Depending on the producing reservoir it varies in ratio of the components. The Marcellus is dry for example. The extreme western section where the Utica is developed is "wetter", more oil and nat gas liquids in the stream vs WV and W PA. Permian is quite "wet", higher porpotion of Nat gas and nat gas liquids i the "stream".
As far as shutting in a productive oil well in the shale. Not a problem. Just takes money. Reservoir conditions will determine requirements. Here in the Bakken the crude has paraffins, which require fresh water injection down the well bore to "clean it up. If this is process is curtailed may require additional treatment to resume efficient production. State of ND Industrial commission estimates 40K to restart a shut in shale well.
Re the question of a low volume producer and if it will restart or is it is economic to do so. This is not a new problem. A shale well produces 80% of it UOR in its 1st three yrs. A well that IPs at ~1500 Bbls/D well be down to ~60 Bls/D at the end of year three. Again exceptions, but the profile is accurate. Producers have been wrestling with this problem for time memorial. Will just depend on the the price of oil. However, if the Fed steps in with a lending program, as the rumor goes, it may change all this.
++++++++++++++++++++++++++++++++++++++++++++++++++++
By joelund - April 30, 2020, 5:20 p.m.
Thanks Mike. Glad to contribute.
One other item I thought about after I posted. I stepped away from the actual production side and focused on drilling opeartions in 2003. However, when I was involved in production you could shut in a well and reduce most of the cost of operations. In other words, there were few if any carrying costs. Not the case in teh Shale. Most of the wells are artificial lift requiring power (electricity). With no production there is no ability to generate electricity on site (nat gas generation). The rural coops in W ND have a demand charge which continues with or w/o power usage. I have seen demand charges of 50% of the bill.
Most Operators in the Bakken have completed the well using gas lift equipment. This production technique involves gas compression equipment which more often than not is Leased from one of the large gas equipment companies. Those lease payments are not dependent on the well producing.
Most of you probably know that the wells in a drill unit are all drilled from a graded pad (maybe 10+ acres, graded graveled built up). Most of the drill units are two section N/S so you have two pads per drill unit of 1280 acres. These pads are leased from the surface owner. Payments will go on w or w/o production.
Hope my point is obvious by now. Operators are in a bind. There are significant carrying costs owning a shut in Shale well.
Also, just my opinion and I am not offering investment advice. It has not escaped me that nat gas pricing has actual improved since late 2019. My opinion, it may positioned to weather the storm and recover quicker than oil in spite its in demand destruction as well. I would like to hear the opinion of the guys/gals on here that actually crunch the #s
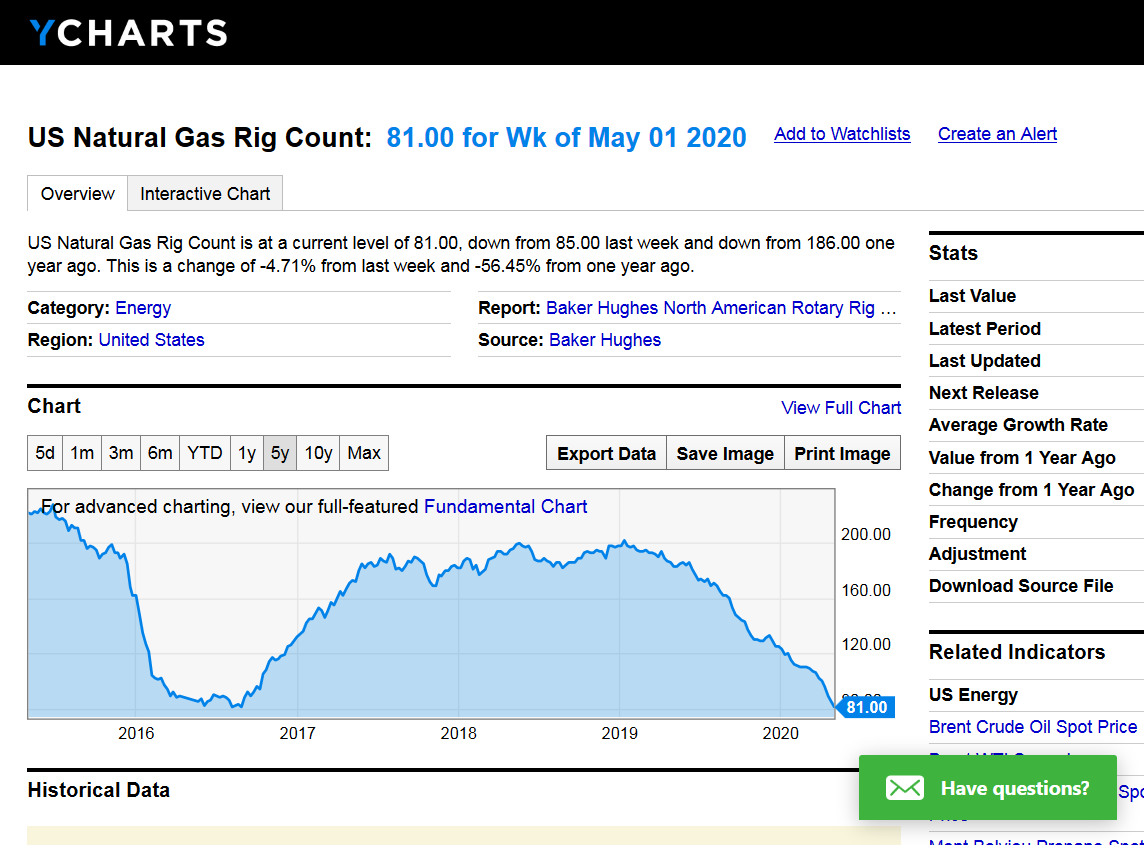
Lowest ng rig count in history at just 81. Tied with August 2016 as the lowest ever.
https://ycharts.com/indicators/us_gas_rotary_rigs
Previous discussions:
By wglassfo - April 28, 2020, 10:30 p.m.
I wonder what the shale industry will be like when oil increases in price to make shale profitable, once again.
The question is:
How much oil will be produced. I read that many wells once capped off, will not be worth opening up again as many wells were pumping minimum amounts of oil. The cost of fracking was already into the well, but the flow was down to barely covering variable costs but so long as the well could produce some profit, it kept on pumping, mind you at a very low volume. Once capped, many wells won't be worth the cost to re-open, as opening a capped well is not a cheap operation. [so I am told]
There is also a risk to re-opening a capped well as the under ground geology or oil flow may not be as much as before. There is no guarantee the flow will resume, at the same volume as when the well was capped
Maybe there is enough oil, not yet fracked to equal previous volume [I don't know]. Then the question might be, access to capital, as the majority of the industry never did turn a profit. If it wasn't for a flow of constant new capital, the majority of fracking would be un-economical. I wish I could raise new capital on an un-profitable venture. lol
Many things will change post corona and fracking oil wells may see some changes. Or maybe not, if oil goes to 300.00 [Richard]
Re: Re: Natural Gas April 14, 2020
By metmike - April 29, 2020, 1:43 p.m.
Great questions Wayne!
I found this to be a good discussion on it:
https://www.oilandgas360.com/exclusive-360-energy-expert-network-video-interview-sproule/
Key Takeaways
Natural Gas Intelligence:
Models Show ‘Quite a Jump’ in Demand as Supply Falling; Natural Gas Futures Called Higher
metmike: Not sure how much longer cold weather in May can support ng prices, if thats whats happening.
05/04 07:44a CST  DJ Natural Gas Climbs Toward $2 Level -- Market Talk

  08:44 ET - Natural gas prices climb 4.7% to $1.98/mmBtu and analysts say the
market could make a run toward the psychological $2 level that it hasn't closed
above since mid January. "Today's price boost appears to be emanating from
weekend updates to the short term temperature views calling for unusually cold
trends spread broadly across the eastern half of the US," say analysts at
Ritterbusch & Associate. But they caution investors about taking too-bullish of
a stance given mild, low-demand temperatures will likely be the norm over the
next month or two. "While we have suggested a near term bullish stance,
sustaining price rallies at this time of the year can prove arduous."
(dan.molinski@wsj.com)

  (END) Dow Jones Newswires
Chilly blasts on the way! Monday weather:
https://www.marketforum.com/forum/topic/51648/
Production Drop, Cooler Forecasts Fuel Natural Gas Futures; Cash Strong Too
5:18 PM
Coming off a mild winter, weather models that showed chilly weather lingering a bit longer aided a rebound for natural gas futures to start the week. Reinforced by a sustained drop in production that first showed up at the end of last week, the June Nymex gas futures contract climbed 10.3 cents to settle Monday at $1.993. July rose 9.6 cents to $2.230.
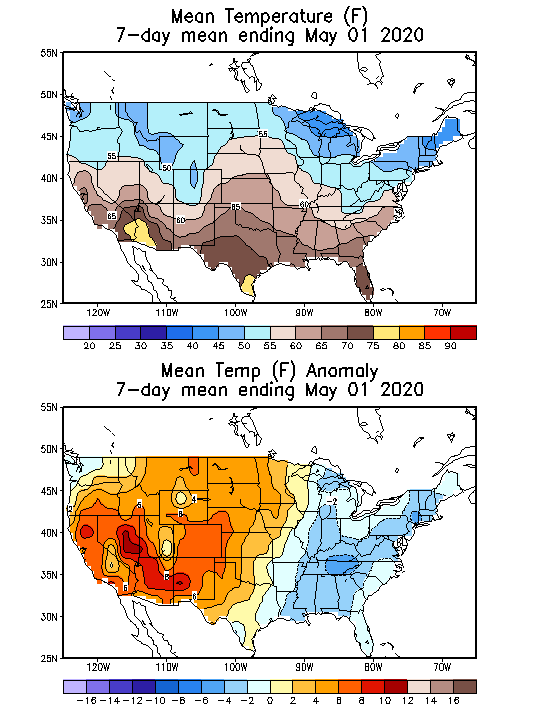
This is the 1st time I can recall NG being sharply up on colder going into mid-May! This reflects on the degree of combination of intensity, areal coverage, and duration of cold being something that has rarely been seen in recent decades this late in spring.
The coldest EIA week, 5/8-14, is projected to be near the normal for mid April and is expected to be near the 2nd coldest for that week back to 1950!
The market is obviously using this as an excuse to go up because in the big picture, having April like cold in May for a week or so with industrial demand the lowest in many decades is not worth a price spike this great.
However, they may be really shutting down supply(the rig count is the lowest in history right now) and that's behind much of it.
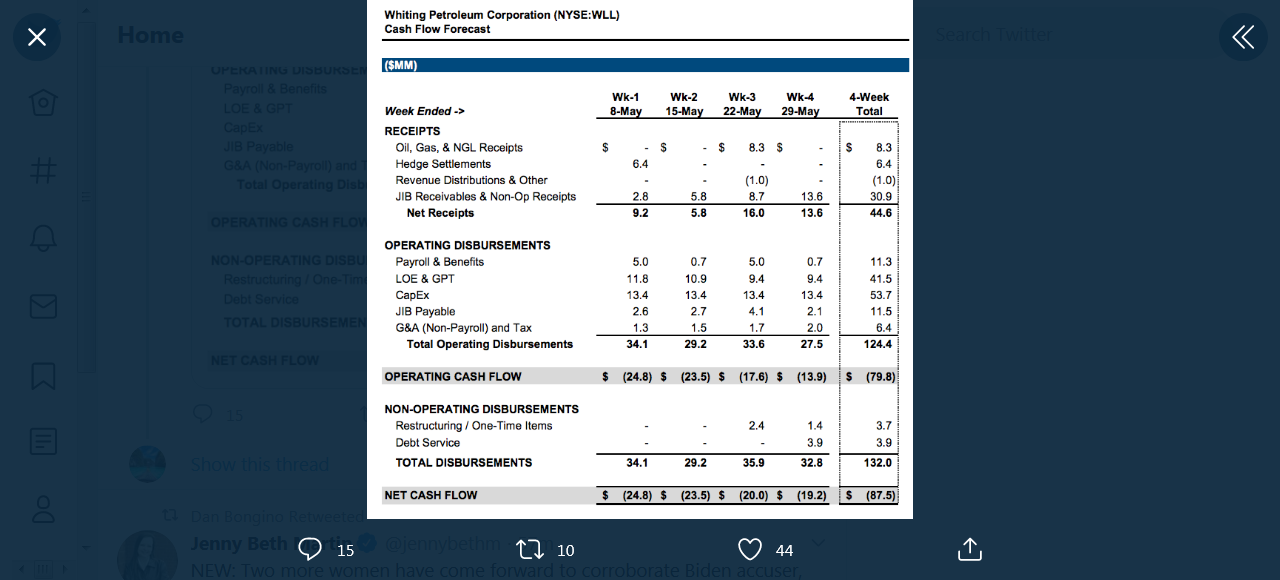
Screen shot of Whiting bankruptcy court filing. Negative cash flow for May projected at $80+M. Illustrates previous point that significant LOE in the Shale continues in spite of shut ins.
At 25 active Rigs in the Bakken and I have three. Expect 0 by the end of may. Hope I can find a ride back to Denver.
At 25 active Rigs in the Bakken and I have three. Expect 0 by the end of may. Hope I can find a ride back to Denver.
Thanks much Joe!
Are you saying 0 active Rigs in the Bakken at the end of May???
Sorry to hear this bad news for you.
Mike
The market is probably seeing this right now and reacting.
If, during the next month, prices spiked much higher, lets' say to 2.5, dialing this in, would it have any affect on decisions?
What is the bottom line on the price needed for being profitable?
Thanks
Tetco Explosion, More Production Cuts Send Natural Gas Futures Blasting Past $2/MMBtu
5:00 PM
Natural gas futures raced higher Tuesday as traders assessed overnight news of a pipeline explosion and the resulting drop in production. The June Nymex gas futures contract breezed past the $2/MMBtu mark to settle 14.1 cents higher day/day at $2.134. July jumped 8.2 cents to $2.312, while smaller gains were seen through October with modest losses beyond that.
metmike: So it was production cut news that spiked us higher yesterday.
Terrific weather on Tuesday:
https://www.marketforum.com/forum/topic/51708/
The dominant hydrocarbon in the Bakken is oil (75%). A spike in NG price to $2.50 for dry gas would have no consequence for local activity. NG has to be gathered processed and sold due to state conservation regs. It is considered more of a pain in the $ss.
"Break even" price is probably the most distorted term in the oil /gas industry. If a well is drilled and completed, development costs "sunk", the break even price is lower than the price at which an operator will drill and complete a new well. I believe most operators will restart shut in production if they can get $25-$35 at the wellhead. Your spread from WTI to the Bakken is approximately -$10. Most have large amounts of debt to service. The exception might be Continental the largest operator in the Bakken (200K Bbls/D). Mr Hamm is trying to make a point with 100% shut ins and his litigation against SA for "dumping".
I prefer the term "Full cycle price" to determine the point at which operators will resume development. Again various variables and opinions. Certain operators (see above) have broadcast UOR of 1M Bbls per well with 12 well density within the drill unit (1280 acres). This may have occurred, however not the norm. Most production curves I have seen from people I trust are in the range of 500K per well with 6 well density per drill unit. The costs of drilling and completing a well have dropped significantly since I started here in 2003. Currently we can drill and complete a Bakken/ Three Forks well in 17 days for $4.5M.
Depending on your IRR requirements once the wellhead oil price is in the $45 - $50 per Bbl I believe the rig count slowly increases.
Thanks very much Joe!
This is helping me/us to understand how these dynamics are playing out uniquely in this unprecedented situation.
I can see exactly what you mean on the "break even" price because there are too many factors that vary, depending on the location.
I thought that this article discusses how this works and explains it in a way thats easy to understand. Do you agree or have more to add?
https://www.enerdynamics.com/Energy-Insider_Blog/Are-Natural-Gas-Prices-Below-3-Sustainable.aspx
om Bloomberg New Energy Finance, breakeven economics vary widely by production basin:

Source: Bloomberg New Energy 2019 Sustainable Energy in America Factbook
Wonderful Wednesday Weather:
https://www.marketforum.com/forum/topic/51777/
NGI after the close on Wednesday
Extensive Sell-Off for Natural Gas Futures as Tetco Production Largely Rerouted; Cash Slips Too
5:26 PM
In one fell swoop, natural gas futures on Wednesday erased all of the previous day’s gains resulting from a pipeline explosion on one of the Lower 48’s oldest natural gas pipelines. With much of the impacted production on that line being rerouted, the June Nymex gas futures contract plunged 19.0 cents to settle at $1.944. July tumbled 14.1 cents to $2.171
![]()
for week ending May 1, 2020 | Released: May 7, 2020 at 10:30 a.m. | Next Release: May 14, 2020
+109 BCF Massive build!
But not a shocker, with the market dropping just a bit, then going slightly higher, now back a bit lower.
| Working gas in underground storage, Lower 48 states Summary text CSV JSN | |||||||||||||||||||||||||
|---|---|---|---|---|---|---|---|---|---|---|---|---|---|---|---|---|---|---|---|---|---|---|---|---|---|
| Historical Comparisons | |||||||||||||||||||||||||
| Stocks billion cubic feet (Bcf) | Year ago (05/01/19) | 5-year average (2015-19) | |||||||||||||||||||||||
| Region | 05/01/20 | 04/24/20 | net change | implied flow | Bcf | % change | Bcf | % change | |||||||||||||||||
| East | 424 | 405 | 19 | 19 | 293 | 44.7 | 326 | 30.1 | |||||||||||||||||
| Midwest | 530 | 506 | 24 | 24 | 304 | 74.3 | 388 | 36.6 | |||||||||||||||||
| Mountain | 111 | 103 | 8 | 8 | 77 | 44.2 | 120 | -7.5 | |||||||||||||||||
| Pacific | 228 | 218 | 10 | 10 | 159 | 43.4 | 232 | -1.7 | |||||||||||||||||
| South Central | 1,027 | 979 | 48 | 48 | 690 | 48.8 | 859 | 19.6 | |||||||||||||||||
| Salt | 331 | 314 | 17 | 17 | 231 | 43.3 | 269 | 23.0 | |||||||||||||||||
| Nonsalt | 695 | 664 | 31 | 31 | 459 | 51.4 | 589 | 18.0 | |||||||||||||||||
| Total | 2,319 | 2,210 | 109 | 109 | 1,523 | 52.3 | 1,924 | 20.5 | |||||||||||||||||
Totals may not equal sum of components because of independent rounding. | |||||||||||||||||||||||||
Working gas in storage was 2,319 Bcf as of Friday, May 1, 2020, according to EIA estimates. This represents a net increase of 109 Bcf from the previous week. Stocks were 796 Bcf higher than last year at this time and 395 Bcf above the five-year average of 1,924 Bcf. At 2,319 Bcf, total working gas is within the five-year historical range.
For information on sampling error in this report, see Estimated Measures of Sampling Variability table below.

Note: The shaded area indicates the range between the historical minimum and maximum values for the weekly series from 2015 through 2019. The dashed vertical lines indicate current and year-ago weekly periods.
https://www.investing.com/economic-calendar/natural-gas-storage-386
Latest Release May 07, 2020 Actual 109B Forecast 106B
| Release Date | Time | Actual | Forecast | Previous | |
|---|---|---|---|---|---|
| May 07, 2020 | 10:30 | 109B | 106B | 70B | |
| Apr 30, 2020 | 10:30 | 70B | 69B | 43B | |
| Apr 23, 2020 | 10:30 | 43B | 39B | 73B | |
| Apr 16, 2020 | 10:30 | 73B | 64B | 38B | |
| Apr 09, 2020 | 10:30 | 38B | 24B | -19B | |
| Apr 02, 2020 | 10:30 | -19B | -24B | -29B |
Recent business shutdowns and changes to normal routines related to mitigation efforts for the 2019 novel coronavirus disease (COVID-19) have caused daily weekday electricity demand in the central region of the United States to decrease by 9%–13% in March and April compared with expected demand, after accounting for seasonal temperature changes. This decrease is similar to declines seen in New York. In contrast, other areas of the country, such as Florida, have not experienced significant changes, which may partly be caused by regional differences in how much electricity each end-use sector consumes and the varying effects of COVID-19 mitigation efforts on the sectors.
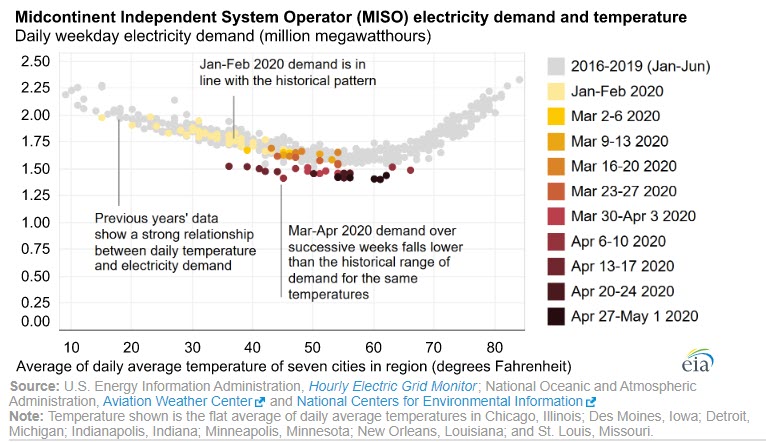
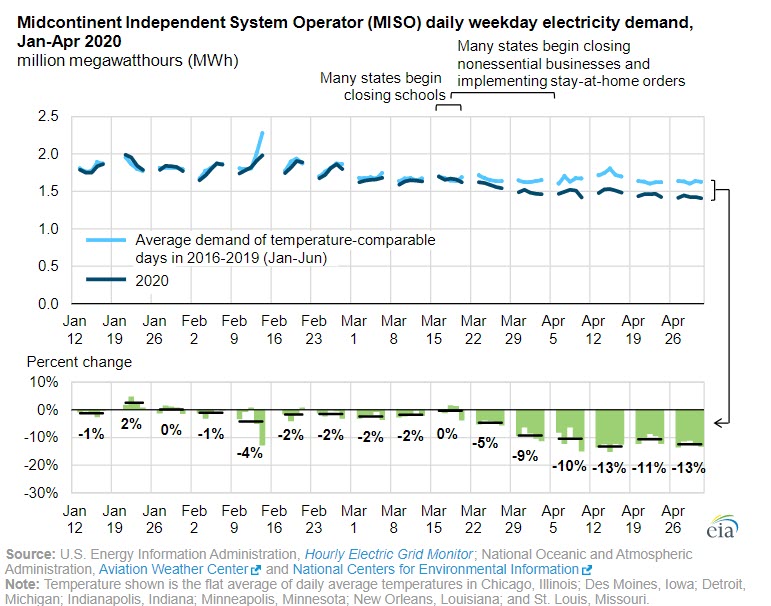
In the central portion of the country, the Midcontinent Independent System Operator (MISO) electric grid spans an area from Minnesota to Louisiana.
Mike et al,
I see NG is up pretty significantly despite the Dow being down rather significantly. I haven’t read any NG news stories yet, but my educated guess is that it is up due to an increase in CDD in the 6-15 day period (consistent with what Mike posted yesterday in the wx thread) once the next few days of chill end. What’s adding fuel to this rally imo is the very sharp (30 cent) drop that just preceded it late last week. The SE is downright quite hot on a good number of days. IF this is really a rally on heat, this would be the first such rally of the season.
Thanks Larry,
I've been watching this closely. In an ordinary year or if we had low storage, the increased demand from this could be fairly bullish.
We are also ending a period of record HDD's in May(which greatly exceeded this CDD demand), so compared to that, it may not look nearly so bullish.
NGI from this morning:
June Natural Gas Steady Early; Analysts Warn of ‘Storage Tsunami’
I will also note a couple of other items.
It's mainly the GFS ensembles that stay bullish in week 2, with the European ensemble not so warm/hot. Canadian model is cooler, especially in the Northeast.
Also the AO and NAO are both negative in week 2 and this suggests cold air is going to be able to invade pretty far south of the Canadian border.
Thanks, Mike. I still think much of the early rise was likely fueled by short covering due to the day 6-15 SE US heat, which consensus after accounting for cold bias is projecting highs well up into the 90s on some days. Even your linked NGI story noted the increased heat even though total demand may actually be a tad down due to reduction of HDD. That article mentioned that IF the projected day 6-15 pattern we’re to continue into June, that that would be a truly bullish pattern. So, perhaps enough short covering traders were spooked by this warmer day 6-15 enough to lead to a significant rally earlier. Of course, it has since sold back down.
Larry,
I should have stated from the get go, more clearly that I agree with you 100% on your assessment of the increase in CDD's being the reason for the market being higher.......and is pretty bullish by itself and would ordinary have us sharply higher
instead, I stated that I've been watching that, which didn't make it as clear. Sorry about that.
Actually I was looking for a low risk area to buy since before the open last night but noted the other factors mentioned, along with the non weather items that seem to be extreme in one direction one day(demand destruction), then the opposite direction the next(production shut down).
MUCH warmer the 2nd half of May!! Here's your Monday weather:
Natural Gas Intelligence Tuesday Morning:
Natural Gas Futures Called Lower as Weather-Driven Demand to ‘Drop Precipitously’
metmike: Compared to the record HDD demand so far this month, the robust CDD demand looks wimpy.........along with some underlying bearish demand killing fundamentals.
And the forecast is cooler(less CDD's) than yesterday!
NGI after the close on Tuesday:
Plunging LNG Demand, Storage Risk Spark Massive Sell-Off for Natural Gas Futures; Cash Retreats
5:15 PM
Aggressive selling in the last half hour of trading accelerated early losses for natural gas futures on Tuesday, with the June Nymex contract settling 10.6 cents lower day/day at $1.720/MMBtu. July dropped an even sharper 12.0 cents to $1.965
From an known short seller of Shale cos.
https://twitter.com/ViscosityRedux/status/1260344514318749697
Down to 17 rigs operating in the Bakken and I have 2.
Thanks Joe!
What significance is this from your vantage point. Any idea on what it means this Summer or beyond?
Natural Gas Intelligence Wednesday morning:
Unimpressive weather and loose balances prevented natural gas futures from recovering any of their recent losses in early trading Wednesday. The June Nymex futures contract was trading at $1.721/MMBtu at around 8:45 a.m. ET, up 0.1 cents.
Prices have fallen off sharply since last week’s highs, which occurred on a rally following reports of an explosion on the Texas Eastern Transmission Co. (Tetco) system. Prices have come under pressure on a combination of unimpressive weather-driven demand the next 15 days, “weakening” LNG exports and Covid-19 demand destruction in the industrial and commercial sectors, according to NatGasWeather.
“Ever since the spike to $2.15 on the heels of the Tetco pipeline explosion...all bounces in price have been sold,” NatGasWeather said. “...For today’s trade, we look to see if July 2020 contracts can reclaim $2 after giving it up yesterday.”
Bulls may not find much support from forecasts until more heat arrives, according to the forecaster.
“Temperatures will warm across the northern U.S. late this week into the perfect 70s from Chicago to New York City for very light demand,” NatGasWeather said. “At the same time, Texas, the South and Southeast will warm into the mid-80s to lower 90s for an increase in cooling demand.
“However, weak weather systems next week are expected to trigger heavy showers over Texas and the South and Mid-Atlantic coast, preventing widespread coverage of 90s from setting up. As such, until more impressive heat builds, weather patterns will remain bearish biased.”
For the period starting next Monday and continuing through May 22, Maxar’s Weather Desk observed cooler changes for the eastern half of the Lower 48 in its latest forecast Tuesday.
“The adjustments are largely in response to the interaction of a mid-latitude storm system with a subtropical low in the western Atlantic during the early stages,” the forecaster said. “A trough deepens in the western Atlantic in association, effectively strengthening onshore flow along the East Coast during the early half while delaying the arrival of warmer air into the region.”
Further out in the May 23-27 time frame, Maxar’s forecast maintained a similar outlook to previous expectations. This includes above normal temperatures for the Southeast.
“Unsettled conditions surround the ridge from the Plains through the Great Lakes region,” the forecaster said.
The overall supply/demand balance continues to look “obscenely loose,” even with production in retreat, according to Bespoke Weather Services. The firm pointed to estimates showing LNG feed gas demand “well off its highs,” coming in at 6.4 Bcf/d as of early Wednesday.
“This is what the market seemed to focus more on yesterday, as the loss of LNG is a big deal given how loose we have been already,” Bespoke said. “We have not seen demand recover much yet as parts of our economy reopen, though we expected any return to be gradual, not a rapid large jump.
“We cannot rule out any price pops with production low, but sustainable rallies at the front of the curve still look difficult.”
NGI Wednesday afternoon:
Tanking LNG Demand Takes Center Stage in Natural Gas Futures Decline; Hefty Storage Build Expected
5:46 PM
Natural gas futures continued to pull back Wednesday as liquefied natural gas demand (LNG) took another hit. With government storage data expected to produce a second consecutive triple-digit injection, the June Nymex gas futures contract settled 10.4 cents lower at $1.616. July fell 10.9 cents to $1.856. Read More
Coronavirus Seen Driving Record 5% Plunge in 2020 Natural Gas Demand
The previous contract low for June NG was 1.649 on April 2nd.
Wednesday's spike, new contract low was 1.595
![]()
for week ending May 8, 2020 | Released: May 14, 2020 at 10:30 a.m. | Next Release: May 21, 2020
+103 BCF Big but below expectations
| Working gas in underground storage, Lower 48 states Summary text CSV JSN | |||||||||||||||||||||||||
|---|---|---|---|---|---|---|---|---|---|---|---|---|---|---|---|---|---|---|---|---|---|---|---|---|---|
| Historical Comparisons | |||||||||||||||||||||||||
| Stocks billion cubic feet (Bcf) | Year ago (05/08/19) | 5-year average (2015-19) | |||||||||||||||||||||||
| Region | 05/08/20 | 05/01/20 | net change | implied flow | Bcf | % change | Bcf | % change | |||||||||||||||||
| East | 452 | 424 | 28 | 28 | 321 | 40.8 | 351 | 28.8 | |||||||||||||||||
| Midwest | 554 | 530 | 24 | 24 | 328 | 68.9 | 408 | 35.8 | |||||||||||||||||
| Mountain | 117 | 111 | 6 | 6 | 81 | 44.4 | 124 | -5.6 | |||||||||||||||||
| Pacific | 240 | 228 | 12 | 12 | 171 | 40.4 | 239 | 0.4 | |||||||||||||||||
| South Central | 1,059 | 1,027 | 32 | 32 | 722 | 46.7 | 887 | 19.4 | |||||||||||||||||
| Salt | 340 | 331 | 9 | 9 | 238 | 42.9 | 279 | 21.9 | |||||||||||||||||
| Nonsalt | 719 | 695 | 24 | 24 | 484 | 48.6 | 608 | 18.3 | |||||||||||||||||
| Total | 2,422 | 2,319 | 103 | 103 | 1,623 | 49.2 | 2,009 | 20.6 | |||||||||||||||||
Totals may not equal sum of components because of independent rounding. | |||||||||||||||||||||||||
Working gas in storage was 2,422 Bcf as of Friday, May 8, 2020, according to EIA estimates. This represents a net increase of 103 Bcf from the previous week. Stocks were 799 Bcf higher than last year at this time and 413 Bcf above the five-year average of 2,009 Bcf. At 2,422 Bcf, total working gas is within the five-year historical range.
For information on sampling error in this report, see Estimated Measures of Sampling Variability table below.
N
Natural Gas Intelligence Thursday midday:
Natural Gas Futures Extend Earlier Rally After EIA Storage Build Falls Short of Consensus
Thursday Weather......above average temps week 2:
Latest Release May 14, 2020 Actual 103B Forecast 107B Previous 109B
https://www.investing.com/economic-calendar/natural-gas-storage-386
| Release Date | Time | Actual | Forecast | Previous | |
|---|---|---|---|---|---|
| May 21, 2020 | 10:30 | 103B | |||
| May 14, 2020 | 10:30 | 103B | 107B | 109B | |
| May 07, 2020 | 10:30 | 109B | 106B | 70B | |
| Apr 30, 2020 | 10:30 | 70B | 69B | 43B | |
| Apr 23, 2020 | 10:30 | 43B | 39B | 73B | |
| Apr 16, 2020 | 10:30 | 73B | 64B | 38B |
https://www.oilandgas360.com/eia-expects-lower-natural-gas-production-in-2020/
In its May 2020 Short-Term Energy Outlook (STEO), the U.S. Energy Information Administration (EIA) forecasts that U.S. marketed natural gas production will decrease by 5% in 2020 because of a weakening economic outlook from the impact of efforts to reduce the spread of the 2019 novel coronavirus disease (COVID-19). EIA expects U.S. marketed natural gas production to average 94.3 billion cubic feet per day (Bcf/d) in 2020, down from 99.2 Bcf/d in 2019.
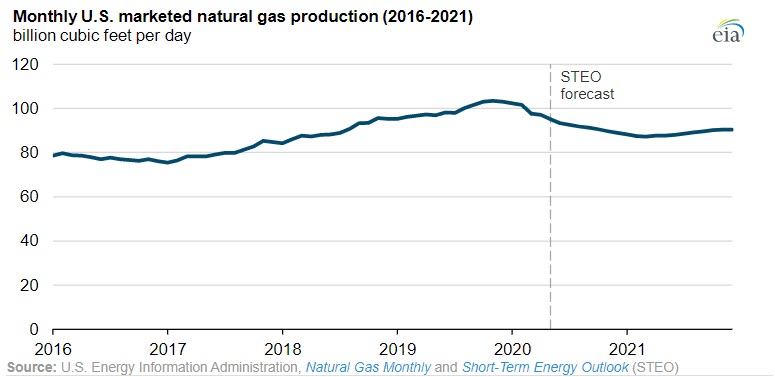
Declines in crude oil and natural gas prices in March and April have led producers to announce plans to further reduce capital spending and drilling levels, as well as curtail production from some existing wells. Most of the expected decline in natural gas production is from associated gas in oil-directed plays, particularly in the Permian Basin that spans parts of western Texas and eastern New Mexico.
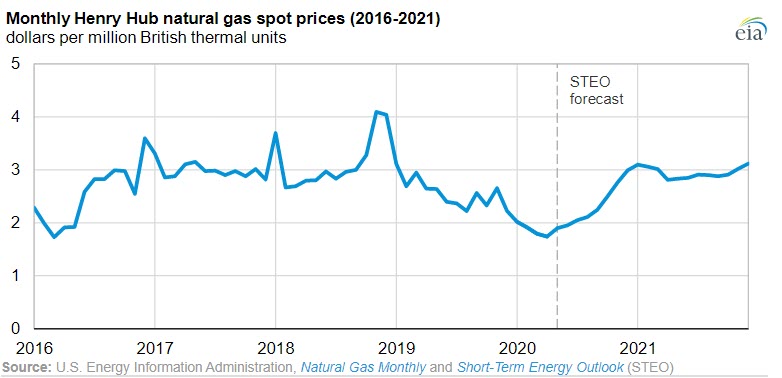
EIA expects that the natural gas spot price for the U.S. benchmark Henry Hub will average $2.16 per million British thermal units (MMBtu) in 2020, about 41 cents lower than the 2019 average of $2.57/MMBtu. Natural gas prices were already decreasing earlier this year because of the previous year’s record production level and a warmer-than-normal winter. In part because of reduced business activity and higher-than-average storage levels before the summer, Henry Hub prices fell to an average of $1.74/MMBtu in April 2020, the lowest monthly average since March 2016.
EIA expects natural gas prices to increase starting in the third quarter of 2020, driven by an increase in industrial demand as business activity resumes. Projected natural gas prices rise to an average of $2.95/MMBtu in 2021 because of upward pricing pressure from declining growth in natural gas production.
Splendid Saturday to you! Here's your weather: https://www.marketforum.com/forum/topic/52256/
Warm to very warm to end May but not excessive heat.
After closing closer to the lows on Friday and just below the previous contract low, set in early April of 1.649, ng opened sharply higher(not quite a gap) from more heat/CDD's in the forecast..........immediately took out Fridays highs, then dropped back down into Friday's range and ng has been weak since then, close to the lows right now and lower than the open.
Natural gas has been so flip floppy lately and volatile(margins went up recently because of that) that its nearly impossible to predict.
Last week, NGM(June) set new life of contract lows at 1.595, which is the huge level of support. Just below 1.650 is also strong support.
If weather models heat up overnight, there's a decent chance that we can add to the current gains.
However, ng is being profoundly affected by speculation over the massive demand destruction from people being shut in(industrial demand in the toilet) and speculation over natural gas shut ins and the lowest rig count in history which will cause supplies to drop off more.
From the Bakken:
7500 wells shut in
510K Bbls/ D shut in
ND projected to produce ~900K per D for May
12 Rigs running 1 Frac crew
Another problem has surfaced. Gas processing plants are running near low operational range (minimin capacity).
Still here
Thanks Joe!
Natural Gas is having one of its biggest days ever........thanks in part to the increase in heat (CDD's) in the forecast.
Up almost $2,000/contract!
Last week, now looks like a double bottom with the early April low for NGM.
Very compelling on the charts and technically.
Weather updated at Noon:
Marvelous Monday to you! Turning MUCH warmer later this week! https://www.marketforum.com/forum/topic/52312/
Big Surge for Natural Gas Futures as Production Drops Further; Cash Rallies Too
5:14 PM
Natural gas futures raced higher Monday as supply/demand balances finally started to move in a more supportive direction for prices. With a further push from the cash market, the June Nymex gas futures contract settled up 13.7 cents from Friday’s close at $1.783. July jumped 12.6 cents to $1.959.
Natural Gas Futures Extend Gains Early as Production Declines in Focus
9:00 AM
Following through on the previous day’s rally, natural gas futures were trading higher early Tuesday as production declines continued to provide support for prices. The June Nymex contract was up 6.1 cents to $1.844/MMBtu at around 8:40 a.m. ET.
Natural Gas Futures Pull Off Another Rally, Break Technical Resistance
4:50 PM
Fresh off a nearly 14-cent run, natural gas futures edged higher again Tuesday as the market continued to digest the sharp drop in production over the weekend. With weather models hinting at an increasingly supportive picture for summer heat, the June Nymex gas futures contract settled at $1.830, 4.7 cents higher day/day. July rose 2.6 cents to $1.985.
metmike:
Big warm up on the way!
Here's your Tuesday weather: https://www.marketforum.com/forum/topic/52419/

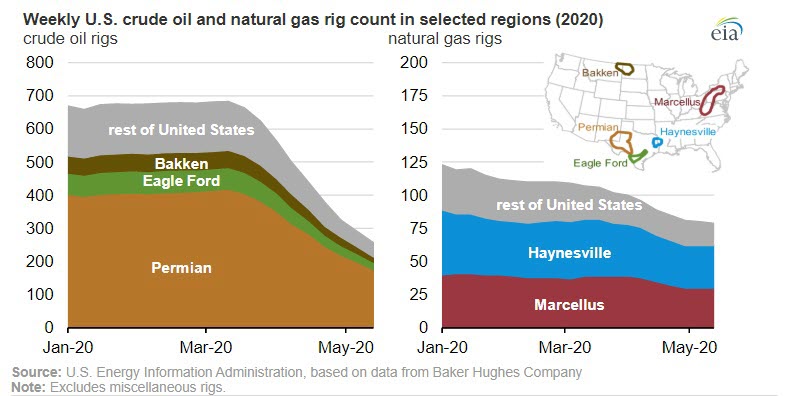 Similarly, natural gas rig activity has decreased along with the natural gas price. However, the decrease in natural gas prices has been over a longer period than oil prices; natural gas prices were already at multi-year lows in early 2020. Record-high dry natural gas production in November 2019, low demand because of warm weather, and relatively small withdrawals from storage during the winter heating season (November 1–March 31) have led to a sustained decrease in the natural gas price.
metmike: European model does not look as warm. Also, the heat in week 2 does not include the southeast, which at this time of year can generate some of the highest CDD's.
EIA report on Thursday should be another bearish number but smaller than last week?
https://www.investing.com/economic-calendar/natural-gas-storage-386
Latest Release May 14, 2020 Actual 103B Forecast 107B Previous 109B
| Release Date | Time | Actual | Forecast | Previous | |
|---|---|---|---|---|---|
| May 21, 2020 | 10:30 | 103B | |||
| May 14, 2020 | 10:30 | 103B | 107B | 109B | |
| May 07, 2020 | 10:30 | 109B | 106B | 70B | |
| Apr 30, 2020 | 10:30 | 70B | 69B | 43B | |
| Apr 23, 2020 | 10:30 | 43B | 39B | 73B | |
| Apr 16, 2020 | 10:30 | 73B | 64B | 38B |
Temperatures during the 7 day period thru last Friday for tomorrows EIA report.
Pretty chilly in the Midwest to Northeast. Maybe less than 100 BCF injection.
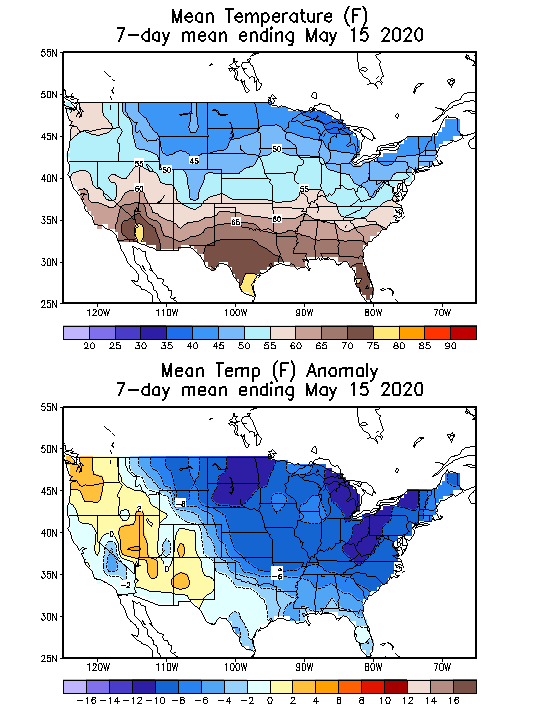
Compare that to the previous weeks temps and an EIA report that resulted in a 103 BCF injection.
Stampede Ends for Natural Gas Bulls as Futures Drop Ahead of EIA Storage Report; Cash Mixed
5:17 PM
After a promising start, natural gas bulls came up short in extending their streak as lackluster weather demand and indications of steep losses ahead from the liquefied natural gas (LNG) sector stopped the rally dead in its tracks. After touching a $1.889 intraday high, the June Nymex gas futures contract slid for the remainder of Wednesday’s session and ultimately settled at $1.771, down 5.9 cents on the day.
Turning up the atmospheric thermostat the next week! Here's your Wednesday weather:
for week ending May 15, 2020 | Released: May 21, 2020 at 10:30 a.m. | Next Release: May 28, 2020
+81 BCF neutral to a tad bullish Weather is not as bullish during week 2 as it was earlier in the week.
| Working gas in underground storage, Lower 48 states Summary text CSV JSN | |||||||||||||||||||||||||
|---|---|---|---|---|---|---|---|---|---|---|---|---|---|---|---|---|---|---|---|---|---|---|---|---|---|
| Historical Comparisons | |||||||||||||||||||||||||
| Stocks billion cubic feet (Bcf) | Year ago (05/15/19) | 5-year average (2015-19) | |||||||||||||||||||||||
| Region | 05/15/20 | 05/08/20 | net change | implied flow | Bcf | % change | Bcf | % change | |||||||||||||||||
| East | 469 | 452 | 17 | 17 | 346 | 35.5 | 376 | 24.7 | |||||||||||||||||
| Midwest | 576 | 554 | 22 | 22 | 356 | 61.8 | 432 | 33.3 | |||||||||||||||||
| Mountain | 124 | 117 | 7 | 7 | 87 | 42.5 | 129 | -3.9 | |||||||||||||||||
| Pacific | 253 | 240 | 13 | 13 | 183 | 38.3 | 246 | 2.8 | |||||||||||||||||
| South Central | 1,081 | 1,059 | 22 | 22 | 753 | 43.6 | 913 | 18.4 | |||||||||||||||||
| Salt | 345 | 340 | 5 | 5 | 246 | 40.2 | 286 | 20.6 | |||||||||||||||||
| Nonsalt | 737 | 719 | 18 | 18 | 507 | 45.4 | 627 | 17.5 | |||||||||||||||||
| Total | 2,503 | 2,422 | 81 | 81 | 1,724 | 45.2 | 2,096 | 19.4 | |||||||||||||||||
Totals may not equal sum of components because of independent rounding. | |||||||||||||||||||||||||
Working gas in storage was 2,503 Bcf as of Friday, May 15, 2020, according to EIA estimates. This represents a net increase of 81 Bcf from the previous week. Stocks were 779 Bcf higher than last year at this time and 407 Bcf above the five-year average of 2,096 Bcf. At 2,503 Bcf, total working gas is within the five-year historical range.
For information on sampling error in this report, see Estimated Measures of Sampling Variability table below.
Note: The shaded area indicates the range between the historical minimum and maximum values for the weekly series from 2015 through 2019. The dashed vertical lines indicate current and year-ago weekly periods.
Heating up for the Holiday! Here's your Friday Weather: https://www.marketforum.com/forum/topic/52591/
Summer like temps. Here's your Saturday Forecast:
https://www.marketforum.com/forum/topic/52675/
My Summer Forecast/La Nina's/Climate Change
Started by metmike - May 23, 2020, 11:33 p.m.
https://www.marketforum.com/forum/topic/52701/
14 Rigs active and i am down to 1.
Local Electric coop deals with the electric demand charge:
https://oilpatchhotline.com/mountrail-williams-cuts-electric-bills-to-aid-bakken-oil-producers/
Price +$13 per Bbl at the wellhead.
Obviously wrong about my prediction of 0 Rigs by the end of May, although only
1 Co (Burlington) has more than 1 (2) Rig active. The value of hedges and firm transport
out of the Basin.
Thanks Joe!
One would think that when demand starts coming back, things could get pretty bullish for prices, considering where they are right now.
Residential cooling demand, if unusually high this Summer from widespread heat waves in the high population centers could more than offset the loss from industrial demand.
Very Warm and turning dry............Sunday forecast +potential La Nina Summer: