KEY EVENTS TO WATCH FOR:
Thursday, April 30, 2020
8:30 AM ET. March Personal Income & Outlays
Personal Income, M/M% (previous +0.6%)
Consumer Spending, M/M% (previous +0.2%)
PCE Price Idx, M/M% (previous +0.1%)
PCE Price Idx, Y/Y% (previous +1.8%)
PCE Core Price Idx, M/M% (previous +0.2%)
PCE Core Price Idx, Y/Y% (previous +1.8%)
8:30 AM ET. Unemployment Insurance Weekly Claims Report - Initial Claims
Jobless Claims (previous 4427K)
Jobless Claims, Net Chg (previous -810K)
Continuing Claims (previous 15976000)
Continuing Claims, Net Chg (previous +4064K)
8:30 AM ET. 1st Quarter Employment Cost Index
ECI, Q/Q% (previous +0.7%)
ECI, Y/Y% (previous +2.7%)
8:30 AM ET. U.S. Weekly Export Sales
Corn (Metric Tons) (previous 670.8K)
Soybeans (Metric Tons) (previous 345.4K)
Wheat (Metric Tons) (previous 399.9K)
9:45 AM ET. Bloomberg Consumer Comfort Index
9:45 AM ET. April ISM-Chicago Business Survey - Chicago PMI
PMI-Adj (previous 47.8)
10:30 AM ET. EIA Weekly Natural Gas Storage Report
Working Gas In Storage (Cbf) (previous 2140B)
Working Gas In Storage, Net Chg (Cbf) (previous +43B)
3:00 AM ET. March Agricultural Prices
Farm Prices, M/M% (previous -2.2%)
4:30 PM ET. Foreign Central Bank Holdings
4:30 PM ET. Money Stock Measures
4:30 PM ET. Federal Discount Window Borrowings
N/A Foreign portfolio holdings of U.S. securities final results
Friday, May 1, 2020
9:45 AM ET. April US Manufacturing PMI
PMI, Mfg (previous 48.5)
10:00 AM ET. March Construction Spending - Construction Put in Place
New Construction (previous -1.3%)
Residential Construction
10:00 AM ET. April ISM Manufacturing Report on Business
Manufacturing PMI (previous 49.1)
Prices Idx (previous 37.4)
Employment Idx (previous 43.8)
Inventories (previous 46.9)
New Orders Idx (previous 42.2)
Production Idx (previous 47.7)
4:00 PM ET. April Domestic Auto Industry Sales
The STOCK INDEXES? http://quotes.ino.com/ex?changes/?c=indexes
The Dow closed sharply higher on Wednesday as it extends the rally off March's low. The high-range close that sets the stage for a steady to higher opening when Thursday's night session begins trading. Stochastics and the RSI are overbought but remain neutral to bullish signaling that sideways to higher prices are possible near-term. If the Dow extends the rally off March's low, the 62% retracement level of the February-March-decline crossing at 25,199.76 is the next upside target. Closes below the 20-day moving average crossing at 23,246.27 would confirm that a short-term top has been posted. First resistance is today's high crossing at 24,764.77. Second resistance is the 62% retracement level of the February-March-decline crossing at 25,199.76. First support is the 20-day moving average crossing at 23,246.27. Second support is April's low crossing at 20,735.02.
The June NASDAQ 100 closed higher on Wednesday as it extends the rally off March's low. The high-range close sets the stage for a steady to higher opening when Thursday's night session begins trading. Stochastics and the RSI are overbought but remain neutral to bullish signaling that sideways to higher prices are possible near-term. If June extends the rally off March's low, the 87% retracement level of the February-March-decline crossing at 9384.61 is the next upside target. Closes below the 20-day moving average crossing at 8399.70 would signal that a short-term top has been posted. First resistance is the 75% retracement level of the February-March-decline crossing at 9003.03. Second resistance is the 87% retracement level of the January-March-decline crossing at 9384.61. First support is the 20-day moving average crossing at 8399.70. Second support is the April 7th low crossing at 7948.00.
The June S&P 500 closed higher on Wednesday as it extends the rally off March's low. The high-range close sets the stage for a steady to higher opening when Thursday's night session begins trading. Stochastics and the RSI are overbought but remain neutral to bullish signaling that sideways to higher prices are possible near-term. If March extends the rally off March's low, the 75% retracement level of the February-March-decline crossing at 3085.85 is the next upside target. Closes below the 20-day moving average crossing at 2745.90 would confirm that a short-term top has been posted. First resistance is the 62% retracement level of the February-March-decline crossing at 2921.04. Second resistance is the 75% retracement level of the February-March-decline crossing at 3085.85. First support is the 20-day moving average crossing at 2745.90. Second support is April's low crossing at 2448.00.
INTEREST RATES? http://quotes.ino.com/ex?changes/?c=interest ""
June T-bonds closed down 15/32's at 181-12.
June T-bonds closed lower on Wednesday while extending this month's trading range.The low-range close sets the stage for a steady to lower opening when Thursday's night session begins trading. Stochastics and the RSI are diverging and are turning neutral to bearish signaling that sideways to lower prices are possible near-term. Closes below the April 14th low crossing at 177-14 would confirm that a short-term top has been posted while opening the door for a possible test of the 50-day moving average crossing at 176-16. If June renews the rally off March's low, March's high crossing at 191-22. First resistance is last-Wednesday's high crossing at 183-02. Second resistance is the March 12th high crossing at 184-07. First support is the April 14th low crossing at 177-14. Second support is the 50-day moving average crossing at 176-16.
June T-notes closed unchanged at 139.005.
June T-notes closed unchanged on Wednesday. The mid-range close sets the stage for a steady to lower opening when Thursday's night session begins trading. Stochastics and the RSI are neutral to bullish signaling that sideways to lower prices are possible near-term. If June extends the rally off March's low, March's high crossing at 140.240 is the next upside target. Closes below the April 7th low crossing at 137.160 would confirm that a short-term top has been posted. First resistance is last-Tuesday's high crossing at 139.220. Second resistance is March's high crossing at 140.240. First support is the April 7th low crossing at 137.160. Second support is the 50-day moving average crossing at 136.318.
ENERGY MARKETS? http://quotes.ino.com/ex?changes/?c=energy ""
June crude oil closed higher on Wednesday. The mid-range close sets the stage for a steady to higher opening when Thursday's night session begins. Stochastics and the RSI are neutral to bearish signaling that sideways to lower prices are possible near-term. If June renews this year's decline, zero is the next downside target. Closes above the 20-day moving average crossing at $23.07 are needed to confirm that a short-term low has been posted. First resistance is the 20-day moving average crossing at $23.07. Second resistance is the 50-day moving average crossing at $31.54. First support is last-Tuesday's low crossing at $6.50. Second support iszero.
June heating oil closed higher on Wednesday as it consolidated some of this year's decline. The high-range close sets the stage for a steady to higher opening when Thursday's night trading session begins. Stochastics and the RSI are oversold but remain neutral to bearish signaling that sideways to lower prices are possible near-term. If June extends this year's decline, the October 2001 low on the monthly continuation chart crossing at $49.30 is the next downside target. Closes above the 20-day moving average crossing at $92.94 are needed to confirm that a short-term low has been posted. First resistance is the 20-day moving average crossing at $92.94. Second resistance is the reaction high crossing at $116.02. First support is Tuesday's low crossing at $67.24. Second support is the October 2001 low on the monthly continuation chart crossing at $49.30.
June unleaded gas closed higher on Wednesday. The mid-range close sets the stage for a steady to higher opening when Thursday's night session begins trading. Stochastics and the RSI are turning bullish signaling that sideways to higher prices are possible near-term. Closes above the reaction high crossing at 82.72 would confirm that a short-term low has been posted. Closes below March's low crossing at 51.89 would renew this year's decline. First resistance is the 25% retracement level of the January-March-decline crossing at 88.30. Second resistance is the 38% retracement level of the January-March-decline decline crossing at 107.64. First support is March's low crossing at 51.89. Second support is monthly support crossing at 32.40.
June Henry natural gas closed lower on Wednesday. The low-range close sets the stage for a steady to lower opening when Thursday's night session begins trading. Stochastics and the RSI are neutral to bearish signaling that sideways to lower prices are possible near-term. If June extends the decline off last-Wednesday's high, the April 14th low crossing at 1.705 is the next downside target. If June renews the rally off April's low, the 50% retracement level of the 2019-2020 decline crossing at 2.154 is the next upside target. First resistance is last-Wednesday's high crossing at 2.100. Second resistance is the 50% retracement level of the 2019-2020 decline crossing at 2.154. First support is the April 14th low crossing at 1.705. Second support is April's low crossing at 1.649.
CURRENCIES? http://quotes.ino.com/ex?changes/?c=currencies ""
The June Dollar closed lower on Wednesday. The low-range close sets the stage for a steady to lower opening when Thursday's night session begins trading. Stochastics and the RSI are neutral to bearish signaling that sideways to lower prices are possible near-term. Closes below the 50-day moving average crossing at 99.32 would confirm that a short-term top has been posted. If June extends last-week's rally March's high crossing at 103.96. First resistance is the April 6th high crossing at 101.03. Second resistance is March's high crossing at 103.96. First support is April's low crossing at 98.81. Second support is the March 27thlow crossing at 98.34. Third support is the 62% retracement level of March's rally crossing at 98.14.
The June Euro closed higher on Wednesday. The high-range close sets the stage for a steady to higher opening when Thursday's night session begins trading. Stochastics and the RSI are neutral to bullish signaling that sideways to higher prices are possible near-term. Closes above the 50-day moving average crossing at 109.93 are needed to confirm that a short-term low has been posted. If June extends the decline off the March 27th high, March's low crossing at 106.71 is the next downside target. First resistance is the April 15th high crossing at 110.07. Second resistance is the March 27th high crossing at 111.88. First support is last-Friday's low crossing at 107.39. Second support is March's low crossing at 106.71.
The June British Pound closed higher on Wednesday. The high-range close sets the stage for a steady to higher opening when Thursday's night session begins trading. Stochastics and the RSI are turning neutral to bullish signaling that sideways to higher prices are possible near-term. Closes above the 50-day moving average crossing at 1.2484 are needed to confirm that a short-term low has been posted. If June resumes the decline off the April-14th high crossing at 1.2653, the April 7th low crossing at 1.2174 is the next downside target. First resistance is the 62% retracement level of the December-March-decline crossing at 1.2758. Second resistance is the 75% retracement level of the December-March-decline crossing at 1.3042. First support is the April 7th low crossing at 1.2174. Second support is March's low crossing at 1.1438.
The June Swiss Franc closed lower on Wednesday.The low-range close sets the stage for a steady to lower opening when Thursday's night session begins trading. Stochastics and the RSI are neutral to bearish signaling that sideways to lower prices are possible near-term. If June extends the decline off the March 30th high, March's low crossing at 1.0138 is the next downside target. Closes above the 50-day moving average crossing at 1.0397 are needed to confirm that a short-term low has been posted. First resistance April's high crossing at 1.0443. Second resistance is the March 30th high crossing at 1.0566. First support is last-Friday's low crossing at 1.0216. Second support is March's low crossing at 1.0138.
The June Canadian Dollar closed higher on Wednesday.The high-range close sets the stage for a steady to higher opening when Thursday's night session begins trading. Stochastics and the RSI are bullish signaling that sideways to higher prices are possible near-term. If June renews the rally off March's low, the 50% retracement level of the January-March-decline crossing at 72.73 is the next upside target. Closes below last-Tuesday's low crossing at 70.12 would confirm that a short-term top has been posted. First resistance is the 50-day moving average crossing at 72.08. Second resistance is the 50% retracement level of the January-March-decline crossing at 72.73. First support is April's low crossing at $70.12. Second support is the March 31st low crossing at 69.73. Second support is March's low crossing at 68.20.
The June Japanese Yen closed higher on Wednesday. The mid-range close sets the stage for a steady to higher opening when Thursday’s night session begins trading. Stochastics and the RSI are overbought but remain neutral to bullish signaling that sideways to higher prices are possible near-term. If June extends the rally off March's low, long-term resistance crossing at 0.0942 is the next upside target. Closes below April's low crossing at 0.0916 would confirm that a short-term top has been posted. First resistance is long-term resistance crossing at 0.0942. Second resistance is March's high crossing at 0.0992. First support is April's low crossing at 0.0916. Second support is March's low crossing at 0.0900.
PRECIOUS METALS? http://quotes.ino.com/ex?changes/?c=metals ""
June gold closed lower on Wednesday. The mid-range close sets the stage for a steady to lower opening when Thursday's night session begins trading. Stochastics and the RSI are turning neutral to bearish signaling that sideways to lower prices are possible near-term. Closes below last-Tuesday's low crossing at $1666.20 would confirm that a short-term top has been posted. If April renews the rally off March's low, the October-2012 high on the monthly continuation chart crossing at $1798.10 is the next upside target. First resistance is April's high crossing at $1788.80. Second resistance is the October-2012 high on the monthly continuation chart crossing at $1798.10. First support is last-Tuesday's low crossing at $1666.20. Second support is the 50-day moving average crossing at $1651.20.
July silver closed higher on Wednesday. The high-range close set the stage for a steady to higher opening when Thursday's night session begins trading. Stochastics and the RSI are neutral to bearish signaling that sideways to lower prices are possible near-term. Closes below last-Tuesday's low crossing at 14.715 would confirm that a short-term top has been posted. If July resumes the rally off March's low, the 75% retracement level of the February-March-decline crossing at 17.237 is the next upside target. First resistance is the 62% retracement level of the February-March-decline crossing at 16.252. Second resistance is the 75% retracement level of the February-March-decline decline crossing at 17.237 is the next upside target. First support is last-Tuesday's low crossing at 14.715. Second support is the April 1st low crossing at 13.935.
July copper closed higher on Wednesday as it extends the rally off March's low. The high-range close sets the stage for a steady to higher opening when Thursday's night session begins trading. Stochastics and the RSI are neutral to bullish signaling that sideways to higher prices are possible near-term. If July extends the rally off March's low, the 50% retracement level of the January-March-decline crossing at 243.80 is the next upside target. Closes below last-Tuesday's low crossing at 221.70 would confirm that a short-term top has been posted. First resistance is today's high crossing at 238.60. Second resistance is the 50% retracement level of the January-March-decline crossing at 243.80. First support is last-Tuesday's low crossing at 221.70. Second support is March's low crossing at 197.95.
GRAINS? http://quotes.ino.com/ex?changes/?c=grains "
July Corn closed up $0.02 3/4-cents at 3.14 3/4.
July corn closed higher due to short covering on Wednesday. The high-range close sets the stage for a steady to higher opening when Thursday's night sessions begins trading. Stochastics and the RSI are neutral to bearish signaling that sideways to lower prices are possible near-term. If July renews this year's decline, psychological support crossing at $3.00 is the next downside target. Closes above the 20-day moving average crossing at $3.28 1/4 are needed to confirm that a short-term low has been posted. First resistance is the 20-day moving average crossing at 3.28 1/4. Second resistance is the 38% retracement level of the January-March-decline crossing at $3.45 3/4. First support is last-Tuesday's low crossing at $3.09. Second support is psychological support crossing at $3.00.
July wheat closed down $0.09 3/4-cents at $5.16 1/4.
July wheat closed lower on Wednesday as it extends the decline off last-Monday's high. The low-range close sets the stage for a steady to lower opening when Thursday's night session begins trading. Stochastics and the RSI are oversold but remain neutral to bearish signaling that sideways to lower prices are possible near-term. If July extends the decline off March's low, the 87% retracement level of March's rally crossing at $5.04 1/4. Closes above the 20-day moving average crossing at $5.41 1/2 would signal that a short-term low has been posted. First resistance is April's high crossing at $5.64 1/2. Second resistance is March's high crossing at $5.71 1/2. First support is today's low crossing at $5.10 1/2. Second support is the 87% retracement level of March's rally crossing at $5.04 1/4.
July Kansas City Wheat closed down $0.06 3/4-cents at $4.77.
July Kansas City wheat closed lower on Wednesday as it extends the decline off last-Monday's high. The low-range close sets the stage for a steady to lower opening when Thursday night session begins trading. Stochastics and the RSI are neutral to bearish signaling that sideways to lower prices are possible near-term. Closes below the 50-day moving average crossing at $4.75 1/2 are needed to confirm that a short-term top has been posted. If July resumes the rally off March's low, January's high crossing at $5.19 is the next upside target. First resistance is April's high crossing at $5.14. Second resistance is January's high crossing at $5.19. First support is the 50-day moving average crossing at $4.75 1/2. Second support is April's low crossing at $4.67 3/4.
July Minneapolis wheat closed down $0.06 1/2-cents at $5.07 1/2.
July Minneapolis wheat closed lower on Wednesday as it extends this year's decline. The low-range close sets the stage for a steady to lower opening when Thursday's night session begins trading. Stochastics and the RSI are oversold but remain neutral to bearish signaling that sideways to lower prices are possible near-term. If July extends this year's decline, psychological support crossing at $5.00 is the next downside target. If July closes above the 50-day moving average crossing at $5.31 3/4 are needed to temper the near-term bearish outlook. First resistance is the 10-day moving average crossing at $5.16. Second resistance is the 20-day moving average crossing at 5.25 3/4. First support is today's low crossing at $5.05 3/4. Second support is psychological support crossing at $5.00.
SOYBEAN COMPLEX? http://quotes.ino.com/ex?changes/?c=grains "
July soybeans closed up $0.05 1/4-cents at $8.37 1/4.
July soybeans closed higher on Wednesday. The high-range close sets the stage for a steady to higher opening when Thursday's night session begins trading. Stochastics and the RSI are neutral to bearish signaling that sideways to lower prices are possible near-term. If July extends this year's decline, psychological support crossing at $8.00 is the next downside target. Closes above the 50-day moving average crossing at $8.71 1/4 are needed to confirm that a short-term low has been posted. First resistance is the 20-day moving average crossing at $8.50 1/2. Second resistance is the 50-day moving average crossing at $8.71 1/4. First support is last-Tuesday's low crossing at $8.18 1/2. Second support is psychological support crossing at $8.00.
July soybean meal closed down $0.40 at $288.00.
July soybean meal closed lower on Wednesday. The mid-range close sets the stage for a steady to lower opening when Thursday's night session begins trading. Stochastics and the RSI are neutral to bearish signaling that sideways to lower prices are possible near-term. If July extends the decline off March's high, monthly support crossing at $283.10 is the next downside target. Closes above the 50-day moving average crossing at $303.60 are needed to confirm that a short-term low has been posted. First resistance is the 20-day moving average crossing at $296.00. Second is the 50-day moving average crossing at $303.60. First support is today's low crossing at $285.60. Second support is monthly support crossing at $283.10.
July soybean oil closed up 46-pts. At 26.23.
July soybean oil closed higher on Wednesday. The high-range close sets the stage for a steady to higher opening when Thursday's night session begins trading. Stochastics and the RSI are turning neutral to bullish signaling that sideways to higher prices are possible near-term. Closes above the 20-day moving average crossing at 26.61 would temper the near-term bearish outlook. If July extends this month's decline, March's low crossing at 25.02 is the next downside target. First resistance is the 20-day moving average crossing at 26.61. Second resistance is the 50-day moving average crossing at 27.53. First support is Monday's low crossing at 25.09. Second support is March's low crossing at 25.02.
LIVESTOCKhttp://quotes.ino.com/exchanges/?c=livestock
June hogs closed down $0.68 at $55.53.
June hogs closed lower on Wednesday as it consolidates some of the rally off April's low. The low-range close sets the stage for a steady to lower opening when Thursday's night session begins trading. Stochastics and the RSI remain neutral to bullish signaling that sideways to higher prices are possible near-term. If June extends the aforementioned rally the 38% retracement level of the 2019-2020 decline crossing at $62.16 is the next upside target. Closes below the 20-day moving average crossing at $49.68 would confirm that a short-term top has been posted. First resistance is Tuesday's high crossing at $60.78. Second resistance is the 38% retracement level of the 2019-2020 decline crossing at $62.16. First support is the 20-day moving average crossing at $49.68. Second support is April's low crossing at $41.50.
June cattle closed down $0.43 at $84.28.
June cattle closed lower on Wednesday as it continues to form a symmetrical Triangle. The low-range close sets the stage for a steady to lower opening on Thursday. Stochastics and the RSI are neutral signaling that sideways trading is possible near-term. If June resumes this year's decline, monthly support crossing at $69.29 is the next downside target. Closes above the reaction high crossing at $88.13 are needed to confirm that a short-term low has been posted. First resistance is the reaction high crossing at $88.13. Second resistance is the 50-day moving average crossing at $92.42. First support is April's low crossing at $76.60. Second support is monthly support crossing at $69.29.
May Feeder cattle closed up $0.05-cents at $118.55.
May Feeder cattle closed higher on Wednesday. The mid-range close sets the stage for a steady to higher opening when Thursday's session begins trading. Stochastics and the RSI are neutral to bullish signaling that sideways to higher prices are possible near-term. Closes above the reaction high crossing at $120.85 would signal that a short-term low has been posted. If May resumes this year's decline, monthly support crossing at $95.50 is the next downside target. First resistance is the reaction high crossing at $120.85. Second resistance is the 50-day moving average crossing at $123.11. First support is April's low crossing at $103.62. Second support is monthly support crossing at $95.50.
FOOD & FIBERhttp://quotes.ino.com/ex changes/?c=food
July coffee closed lower on Wednesday as it extends the decline off March's high. The low-range close sets the stage for a steady to lower opening on Thursday. Stochastics and the RSI are oversold but remain neutral to bearish signaling that sideways to lower prices are possible near-term. If July extends this month's decline, March's low crossing at 10.31 is the next downside target. Closes above the 20-day moving average crossing at 11.54 would signal that a low has been posted.
July cocoa closed higher on Wednesday. The high-range close sets the stage for a steady to higher opening on Thursday. Stochastics and the RSI are turning neutral to bullish signaling that sideways to higher prices are possible near-term. If July extends the rally off April's low, the 50-day moving average crossing at 24.36 is the next upside target. If July extends the decline off March's high, March's low crossing at 10.13 is the next downside target.
July sugar closed higher on Wednesday as it consolidates some of this year's decline. The high-range close set the stage for a steady to higher opening on Thursday. Stochastics and the RSI are oversold but are turning neutral to bullish signaling that sideways to higher prices are possible. Closes above the 20-day moving average crossing at 10.15 are needed to temper the near-term bearish outlook. If July extends the decline off February's high, monthly support crossing at 8.36 is the next downside target.
July cotton closed higher on Wednesday. The high-range close sets the stage for a steady to higher opening on Thursday. Stochastics and the RSI are turning neutral to bullish signaling that sideways to higher prices are possible near-term. If July extends the rally off March's low, the 50-day moving average crossing at 57.65 is the next upside target. Closes below the 20-day moving average crossing at 53.59 would temper the near-term friendly outlook.
Thanks tallpine!
Apparently the wheat got hammered because of rains in wheat country of Russia.
Positive news about beating COVID-19 helped the stock market and the not as bearish as expected EIA storage report, rallied crude and this likely helped C and S.
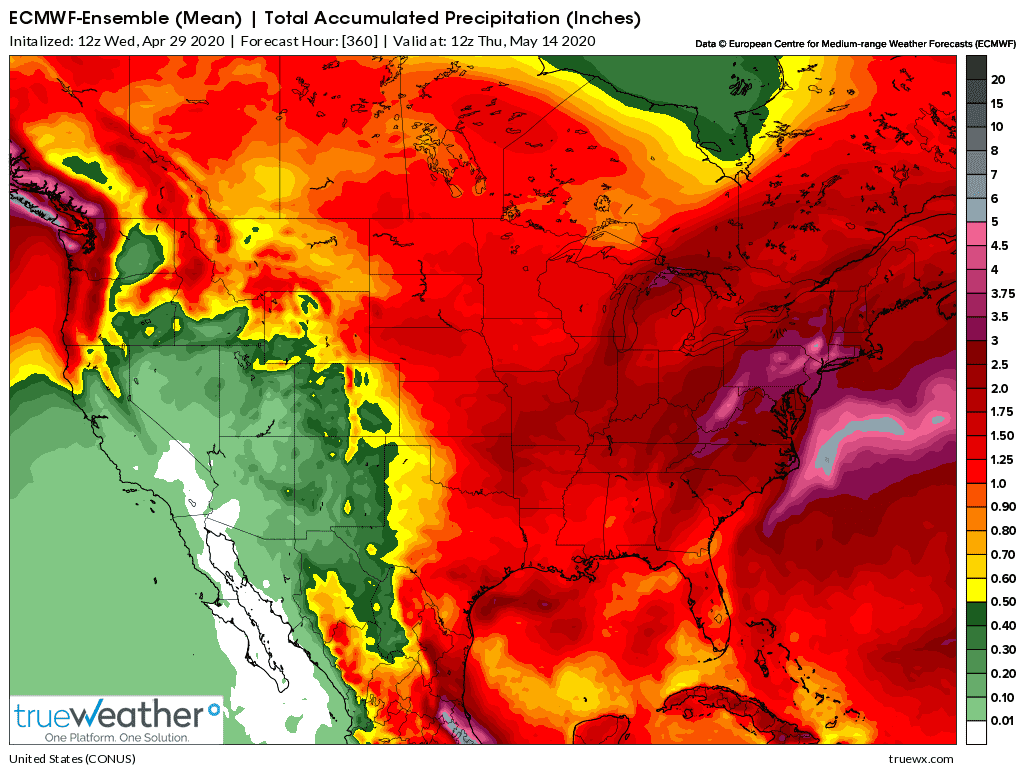
Here's the latest 2 week rains from the European model.
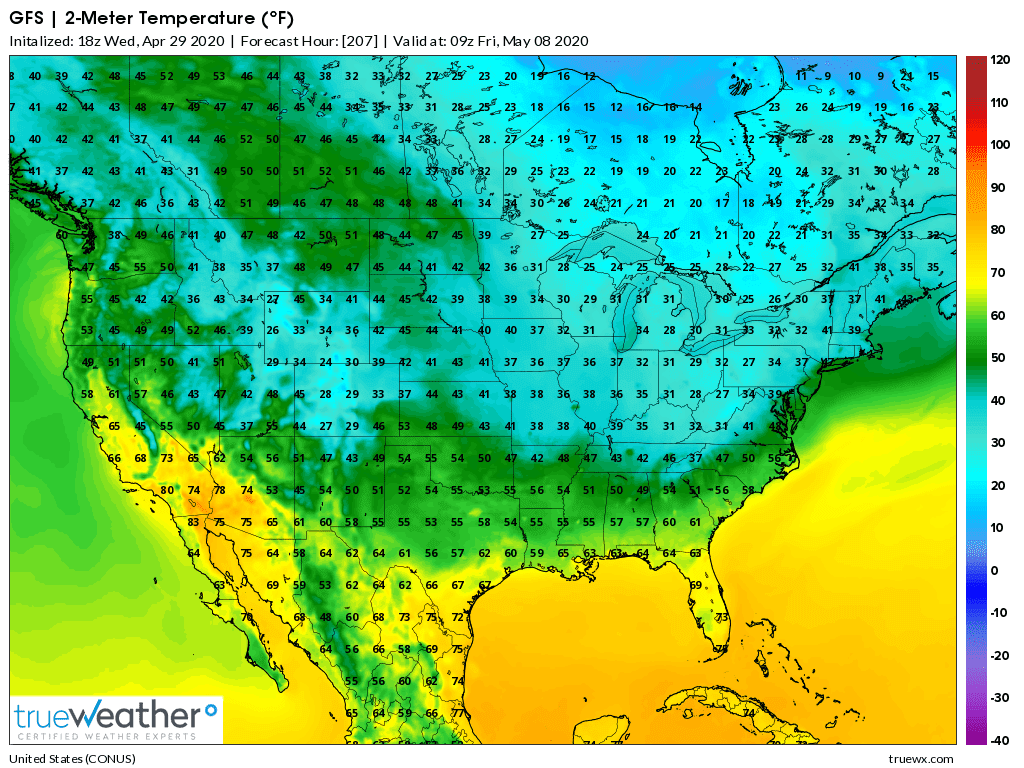
Below that, temperatures for next Friday morning on the last GFS operational model.
There is some really cold air coming down into Southeastern Canada late next week. Well down into the 20's!!! If that cold gets a bigger push, into the Eastern Cornbelt, it could end up being pretty bullish. If temps, for instance dropped into the mid 20's in IN and OH.
Wayne, I hope you dodge the bullet on your early planted corn with this cold wave as it looks like U-20's next Thu and Fri mornings for you )-: