APRIL 20, 2020: The previous coronavirus thread was getting excessively long, so we've started another new one.
Note: 2 months ago, with almost no test results, I guessed that total March cases would be around 10,000..............19 times too low! Sorry about that! By 3 weeks later, after the data showed the big increases, I quickly adjusted that to 200,000 total cases by the end of March. We ended the month with 190,000 total cases. So tracking the data closely the is giving us more and more information to hone in our predictive skills.
There is still tremendous uncertainty but its becoming less every day. We have hit the top in new cases and now, we will be tracking the rate of fall. Not every day will feature a drop, however.
+++++++++++++++++++++++++++++++++++++++++++
See the latest data below:
+++++++++++++++++++++++++++++++++++++++++++++
https://www.marketforum.com/forum/topic/50894/
Most mind boggling COVID-19 fact yet
Started by metmike - April 20, 2020, 7:11 p.m.
+++++++++++++++++++++++++++++++++++++++++
Previous thread below:
https://www.marketforum.com/forum/topic/49863/
Tracking the Coronavirus#2-SUN
45 responses |
Started by metmike - April 1, 2020, 1:26 p.m.
https://www.marketforum.com/forum/topic/48892/
*Tracking the Coronavirus-TUE#'s at the bottom-rate slowing down a bit?
41 responses |
Started by metmike - March 14, 2020, 11:49 a.m.
+++++++++++++++++++++++++++++++++++++++++++++++++++++++++++++++++++++++++++++++++
Last few posts from previous thread are below:
By cutworm - April 19, 2020, 8:10 a.m.
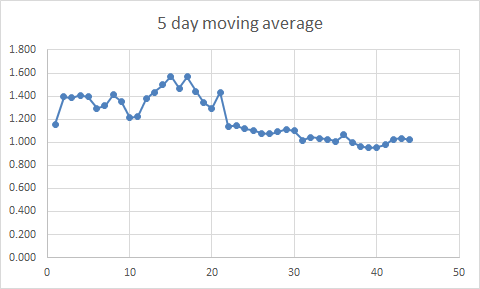
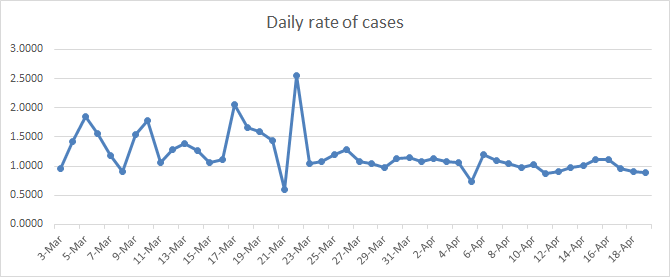
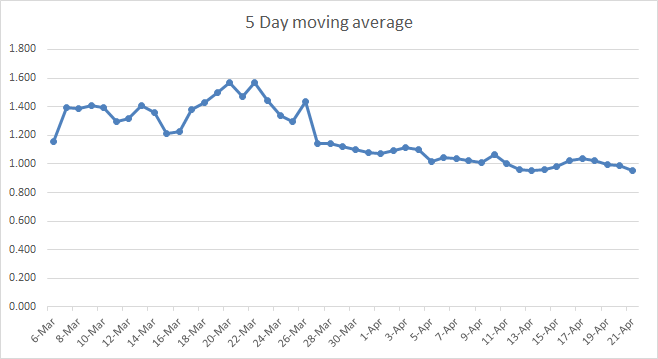
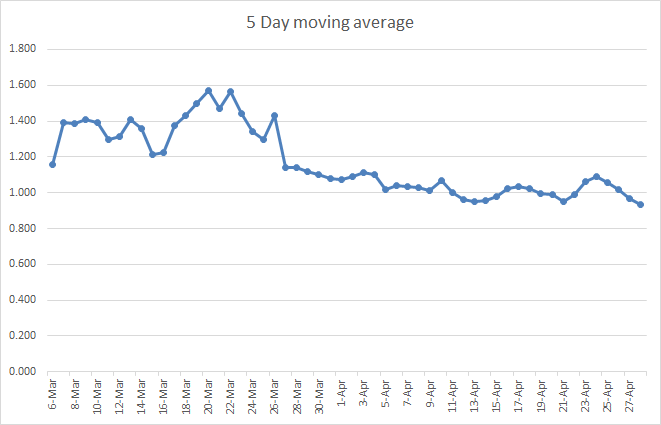
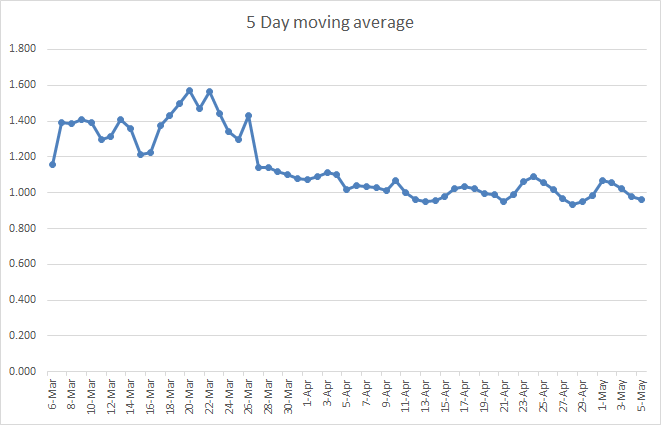
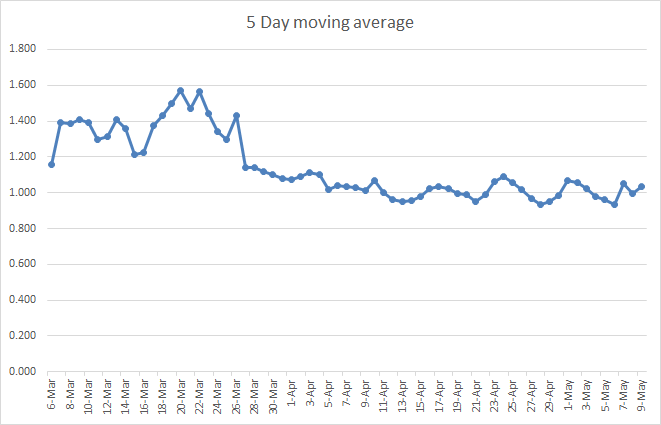
Info For these charts gleaned from https://www.worldometers.info/coronavirus/country/us/
The end date is 4-18.
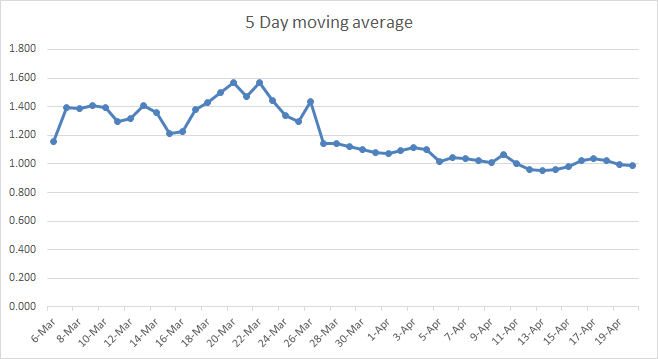
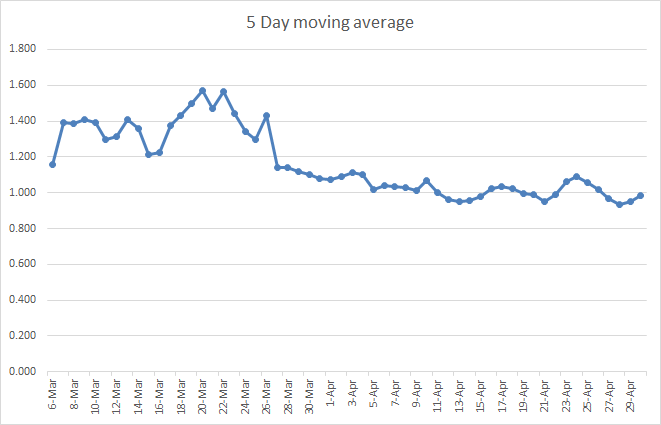
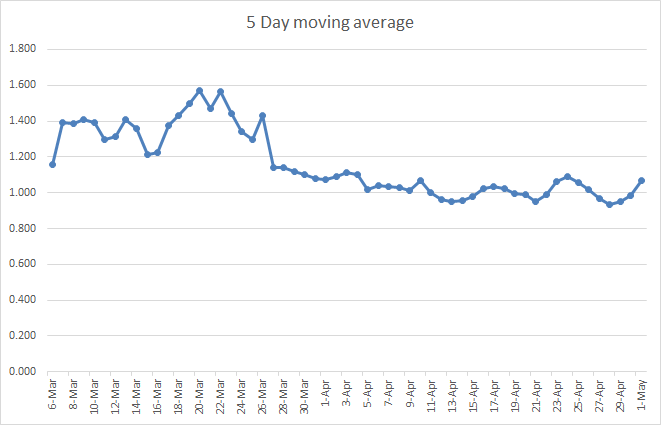
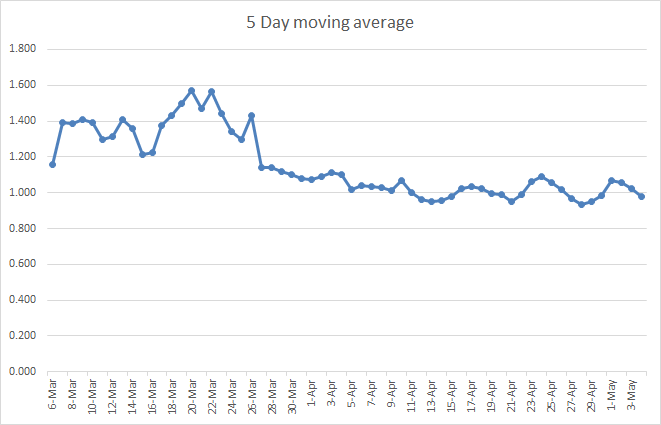
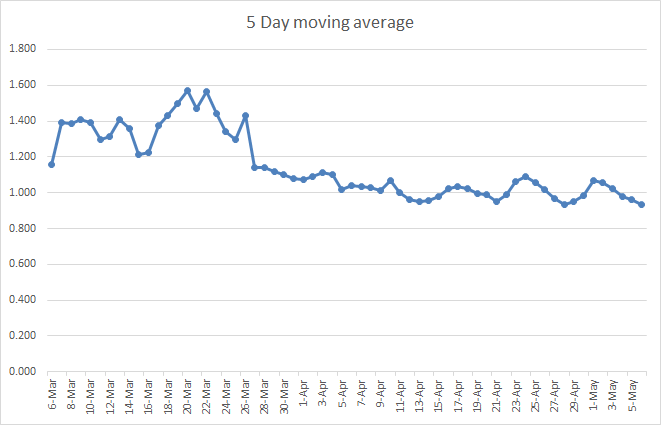
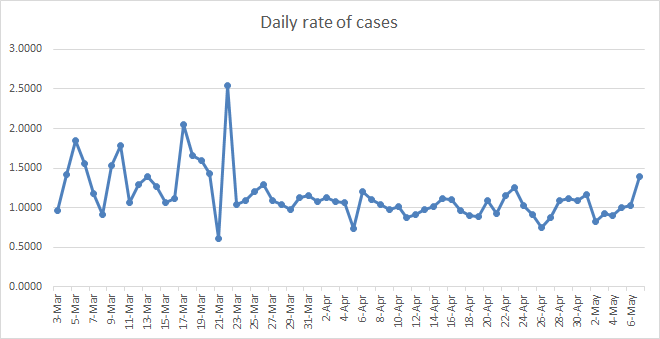
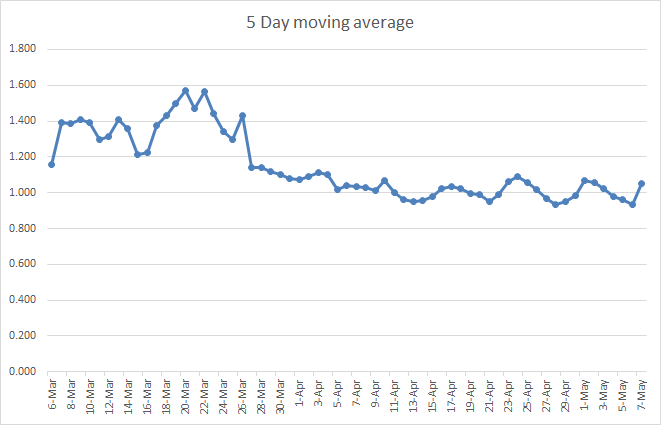
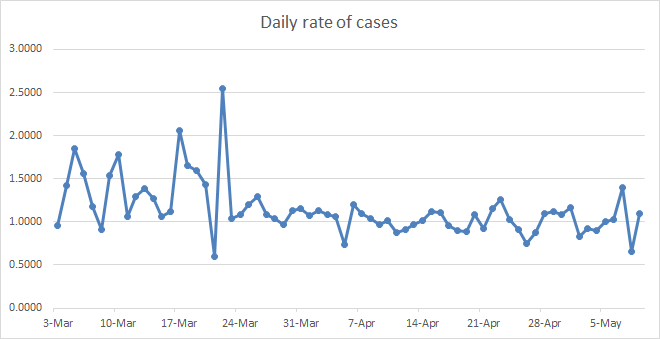
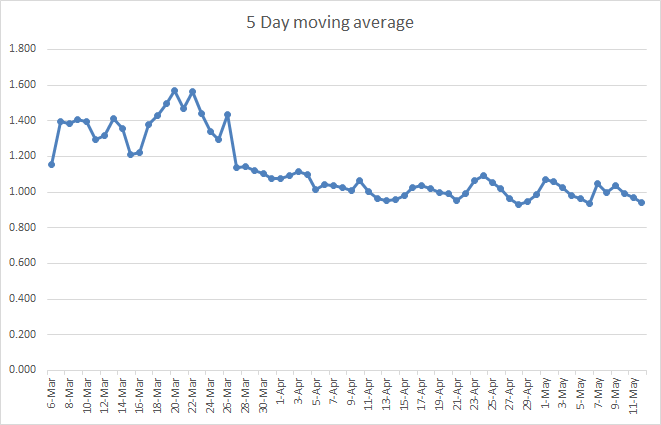
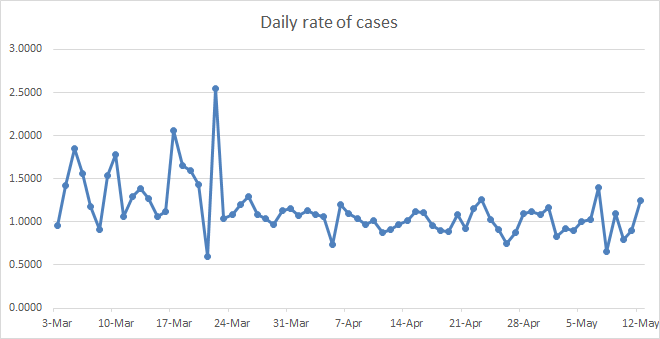
Current rate 0.9034, 5 day moving average 1.021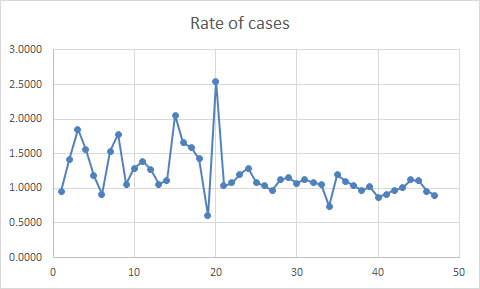
++++++++++++++++++++++++++++++++++++++
Re: Re: Re: Re: Re: Re: Re: Re: Re: Tracking the Coronavirus#2-TUE#'s-Highs are in!
By cutworm - April 19, 2020, 11:21 a.m.
Opinion: Can we analyze the rate chart like some do in technical annalists? on the rate chart below is there a triangle pattern ? Notice the 3 brown points line up, and the 3 green also. Let's see what happens in the days to come.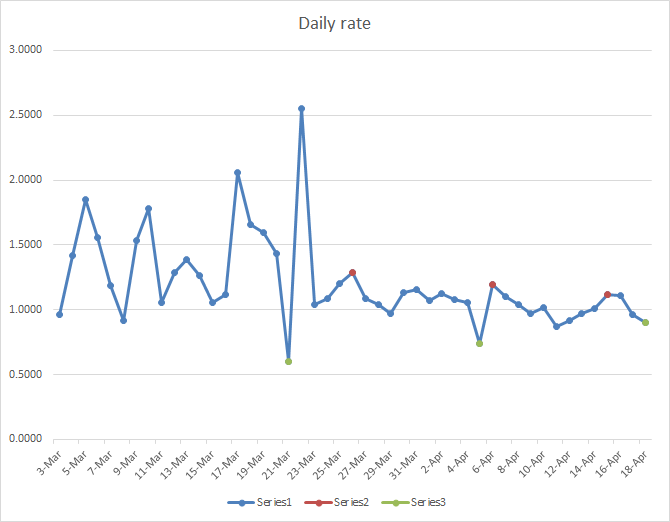
++++++++++++++++++++++++++++++++++++++++
Re: Re: Re: Re: Re: Re: Re: Re: Re: Re: Tracking the Coronavirus#2-TUE#'s-Highs are in!
By metmike - April 20, 2020, 12:26 a.m.
Thanks very much cutworm!
With Sunday's number, we probably broke below the green dot of Saturday. I feel confident that lower numbers are ahead. Not every day but on most days.
Saturday: They just did an insane update for deaths on 4-14, more than doubling the previous number and more than double the previous high or any other day at 5,977!!! How can 3,000+ deaths suddenly show up several days later in the stat and that day have more than 3 times as many deaths as the previous day, with 1,718??? If that is not a glitch that gets adjusted back, then it makes me concerned again about the accuracy of this data.
https://coronavirus.1point3acres.com/en
Date New Cases+/-change in new cases vs yesterday
3-3 21
3-4 31+10
3-5 75+46
3-6 99+24
3-7 116+17
3-8 121+5
3-9 179+58
3-10 290+111
3-11 247-43
3-12 425+178
3-13 528+103
3-14 732+204
3-15 710-22
New cases +/- change %change in new cases
3-16 965+258 +37%
3-17 1,454+489 +51%
3-18 2,645+1,191 +82%
3-19 5,437+2858 +108%
3-20 5,529+65 +1%
3-21 7,165+1,683 +23%
3-22 8,361+1165 +16%
3-23 9,828 +1,403 +17%
3-24 10,590 +783 +8%
3-25 13,984 +3,369 +32%
3-26 16,905 +2,863 +20%
3-27 18,780 +2,101 +12%
3-28 20,028 +1,039 +5%
3-29 17,989 -1,853 -9%
3-30 21,844 +3,790 +21%
3-31 25,747- +3,774 +17%
4-1 26,558 +837 +3%
4-2 29,738 +3,180 +12%
4-3 32,592 +2,754 +9%
4-4 34,126 +1,534 +6% High for daily number
4-5 25,796 -8,330 -25%
4-6 31,185 +5,389 +21%
4-7 31,676 +491 +2%
4-8 32,989 +1,313 +4%
4-9 34,408 +1,419 +4% Barely a new high with 4-4
4-10 34,244 +164 +0% Barley another new high for a triple top
4-11 30,142 -4,102 -12%
4-12 27,532 -2,510 -8%
4-13 26,540 -992 -4%
4-14 26,506 -34 -0%
4-15 30,413 +3,907 +15% Not every day will drop after the top. A new high here, however would be an unpleasant surprise.
4-16 32,029 +1,616 +5% Bouncing higher after the extremely dry air mass hit. Is this from weather? https://www.marketforum.com/forum/topic/49391/
4-17 30,980 -1,049 -3%
4-18 28,687 -2,293 -8%
4-19 25,596 -3,091 -11%
Today's increase is the lowest increase since 20 days ago, March 30! Past Sunday's have featured low numbers.
Total cases 771,980
A statistical triple top occurred on 4-4, 4-9, 4-10 for new cases at just over 34,000 on all 3 days. Deaths Tuesday just got changed today to 5,977, more than 3,000 higher than what they had reported for that day all week...until today's crazy change!
Thursday: Did the cold, very dry air cause new cases to go higher here? https://www.marketforum.com/forum/topic/49391/
Edit: forgot to revise the deaths to 53,000 earlier this week. I've been just paying attention to new cases and not paying attention to deaths.
++++++++++++++++++++++++++++++++++++
Friday: Highs are still in but this very dry air may have been good for the virus to survive longer.
+++++++++++++++++++++++++++++++++++++
Saturday: They just increased the deaths on Tuesday from 2,557 to 5,977! That can't be right! The day before was 1,718-Mon and day after-Wed was 2,795, then 2,110-Thu.
++++++++++++++
Sunday: Lowest daily increase in new cases since March 30th. However, Sunday's in the past have a tendency to report low numbers.
++++++++++++++++++++++++++++++++++++++++++++++++++++
We have a reliable leading indicator that is often 2 weeks ahead of the daily infection reports which is providing powerful evidence that the current rate of new numbers of people with the flu/coronavirus.....measured in real time has been falling for awhile even as new cases and delayed test results WERE showing an increase because they are LAGGING indicators).
https://www.marketforum.com/forum/topic/49867/
++++++++++++++++++++++++++++++++++++++++++
Re: Re: Re: Re: Re: Re: Re: Re: Re: Tracking the Coronavirus#2-TUE#'s-Highs are in!
By cutworm - April 20, 2020, 7:36 a.m.
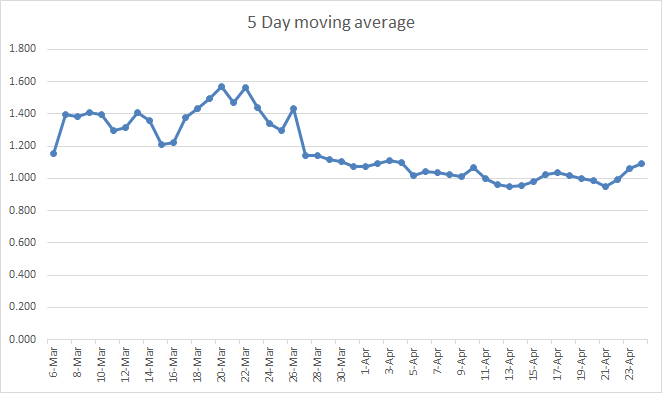
Info For these charts gleaned from https://www.worldometers.info/coronavirus/country/us/
The end date is 4-18.
Current rate 0.8894, 5 day moving average 0.997 Both below 1 and on downward trends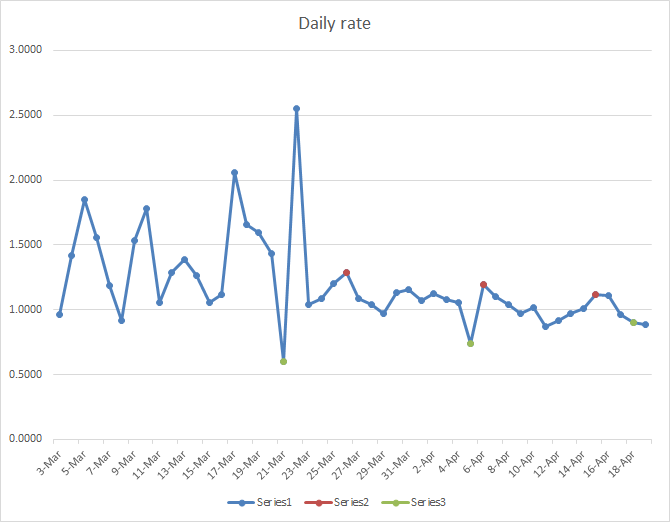
Thanks very much cutworm!
https://coronavirus.1point3acres.com/en
Date New Cases+/-change in new cases vs yesterday
3-3 21
3-4 31+10
3-5 75+46
3-6 99+24
3-7 116+17
3-8 121+5
3-9 179+58
3-10 290+111
3-11 247-43
3-12 425+178
3-13 528+103
3-14 732+204
3-15 710-22
New cases +/- change %change in new cases
3-16 965+258 +37%
3-17 1,454+489 +51%
3-18 2,645+1,191 +82%
3-19 5,437+2858 +108%
3-20 5,529+65 +1%
3-21 7,165+1,683 +23%
3-22 8,361+1165 +16%
3-23 9,828 +1,403 +17%
3-24 10,590 +783 +8%
3-25 13,984 +3,369 +32%
3-26 16,905 +2,863 +20%
3-27 18,780 +2,101 +12%
3-28 20,028 +1,039 +5%
3-29 17,989 -1,853 -9%
3-30 21,844 +3,790 +21%
3-31 25,747- +3,774 +17%
4-1 26,558 +837 +3%
4-2 29,738 +3,180 +12%
4-3 32,592 +2,754 +9%
4-4 34,126 +1,534 +6% High for daily number
4-5 25,796 -8,330 -25%
4-6 31,185 +5,389 +21%
4-7 31,676 +491 +2%
4-8 32,989 +1,313 +4%
4-9 34,408 +1,419 +4% Barely a new high with 4-4
4-10 34,244 +164 +0% Barley another new high for a triple top
4-11 30,142 -4,102 -12%
4-12 27,532 -2,510 -8%
4-13 26,540 -992 -4%
4-14 26,506 -34 -0%
4-15 30,413 +3,907 +15% Not every day will drop after the top. A new high here, however would be an unpleasant surprise.
4-16 32,029 +1,616 +5% Bouncing higher after the extremely dry air mass hit. Is this from weather? https://www.marketforum.com/forum/topic/49391/
4-17 30,980 -1,049 -3%
4-18 28,687 -2,293 -8%
4-19 25,596 -3,091 -11%
4-20 28,043 +2,447 +10%
Yesterdays new case number was the lowest so far in April but this is the 4th Sunday in a row that featured a low number .
Total cases 800,198
A statistical triple top occurred on 4-4, 4-9, 4-10 for new cases at just over 34,000 on all 3 days. Deaths Tuesday just got changed today to 5,977, more than 3,000 higher than what they had reported for that day all week...until today's crazy change!
Thursday: Did the cold, very dry air cause new cases to go higher here? https://www.marketforum.com/forum/topic/49391/
Edit: forgot to revise the deaths to 53,000 earlier this week. I've been just paying attention to new cases and not paying attention to deaths.
++++++++++++++++++++++++++++++++++++
Friday: Highs are still in but this very dry air may have been good for the virus to survive longer.
+++++++++++++++++++++++++++++++++++++
Saturday: They just increased the deaths on Tuesday from 2,557 to 5,977! That can't be right! The day before was 1,718-Mon and day after-Wed was 2,795, then 2,110-Thu.
++++++++++++++
Sunday: Lowest daily increase in new cases since March 30th. However, Sunday's in the past have a tendency to report low numbers.
++++++++++++++++++++++++++++++++++++++++++++++++++++
Monday: Like the previous 3 Sunday's, yesterday was in fact too low as we thought. Deaths for the 14th, which were suddenly increased by over 3,000(on the 18th).......were increased even more for that one day, now at 6,142.......well over double 2nd place. The only thing that I can think of to explain this is that a bunch of deaths were "found" after the 14th and they assigned them all to that day for some unknown reason.
What do you have cutworm?
Info For these charts gleaned from https://www.worldometers.info/coronavirus/country/us/
The end date is 4-20.
Current rate 1.0882, 5 day moving average 0.997
Cutworm: Mike I am also thinking that there is a "Week end Kink" in the data collection. Also we don't know how additional testing is affecting the results. 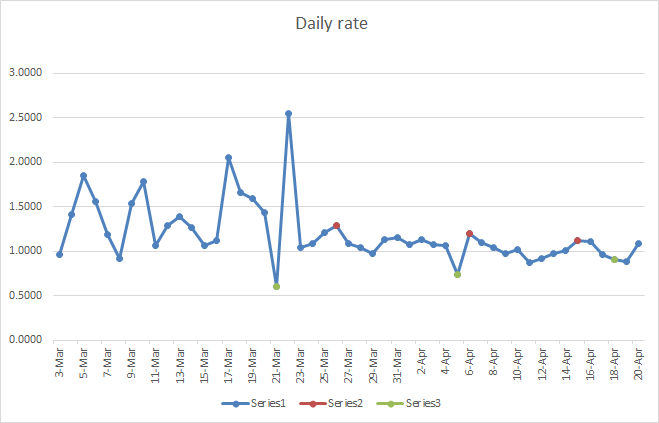
"Also we don't know how additional testing is affecting the results."
cutworm
I think you may have nailed a great point. They are doing studies that shockingly show many times more people were infected than we knew before. Ramping up the testing like they are doing, is going to pick up on these people and cause MANY more new cases that were undetected before. It will be near impossible to dial that in, however, if they have a hospitalization number, it should be more independent of the number of tests being administered. If 50 times more people had/have it and are not going to the hospital but are now testing positive, they won't show up in the hospital stat, which should drop more than the new positives drop...........theoretically.
https://coronavirus.1point3acres.com/en
Date New Cases+/-change in new cases vs yesterday
3-3 21
3-4 31+10
3-5 75+46
3-6 99+24
3-7 116+17
3-8 121+5
3-9 179+58
3-10 290+111
3-11 247-43
3-12 425+178
3-13 528+103
3-14 732+204
3-15 710-22
New cases +/- change %change in new cases
3-16 965+258 +37%
3-17 1,454+489 +51%
3-18 2,645+1,191 +82%
3-19 5,437+2858 +108%
3-20 5,529+65 +1%
3-21 7,165+1,683 +23%
3-22 8,361+1165 +16%
3-23 9,828 +1,403 +17%
3-24 10,590 +783 +8%
3-25 13,984 +3,369 +32%
3-26 16,905 +2,863 +20%
3-27 18,780 +2,101 +12%
3-28 20,028 +1,039 +5%
3-29 17,989 -1,853 -9%
3-30 21,844 +3,790 +21%
3-31 25,747- +3,774 +17%
4-1 26,558 +837 +3%
4-2 29,738 +3,180 +12%
4-3 32,592 +2,754 +9%
4-4 34,126 +1,534 +6% High for daily number
4-5 25,796 -8,330 -25%
4-6 31,185 +5,389 +21%
4-7 31,676 +491 +2%
4-8 32,989 +1,313 +4%
4-9 34,408 +1,419 +4% Barely a new high with 4-4
4-10 34,244 +164 +0% Barely another new high for a triple top
4-11 30,142 -4,102 -12%
4-12 27,532 -2,510 -8%
4-13 26,540 -992 -4%
4-14 26,506 -34 -0%
4-15 30,413 +3,907 +15%
4-16 32,029 +1,616 +5% Bouncing higher after the extremely dry air mass hit. Is this from weather? https://www.marketforum.com/forum/topic/49391/
4-17 30,980 -1,049 -3%
4-18 28,687 -2,293 -8%
4-19 25,596 -3,091 -11%
4-20 28,043 +2,447 +10%
4-21 26,558 -1,485 -5%
Total cases 827,093
Sunday: Lowest daily increase in new cases since March 30th. However, Sunday's in the past have a tendency to report low numbers.
++++++++++++++++++++++++++++++++++++++++++++++++++++
Monday: Like the previous 3 Sunday's, yesterday was in fact too low as we thought. Deaths for the 14th, which were suddenly increased by over 3,000(on the 18th).......were increased even more for that one day, now at 6,142.......well over double 2nd place. The only thing that I can think of to explain this is that a bunch of deaths were "found" after the 14th and they assigned them all to that day for some unknown reason.
+++++++++++++++++++++++++++++++++++
Tuesday: Back down a bit but deaths jumped higher today(still not even half of the crazy high number they gave us for the 14th.
What do you have cutworm?
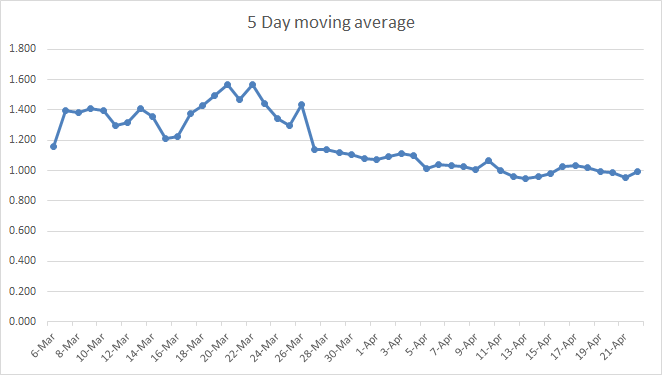
Info For these charts gleaned from https://www.worldometers.info/coronavirus/country/us/
The end date is 4-21.
Current rate 0.942, 5 day moving average 0.953 Both below 1 and on downward trends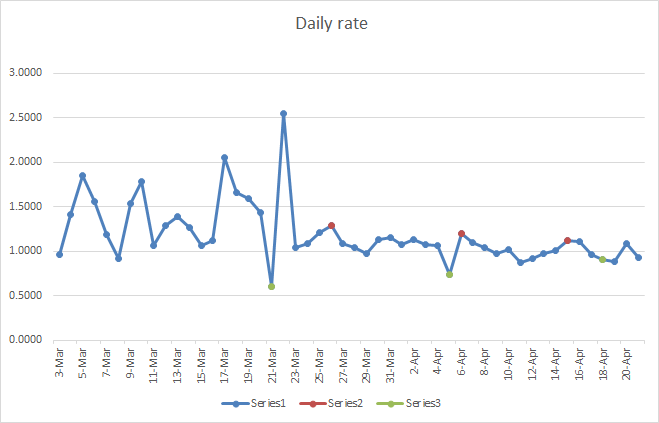
https://coronavirus.1point3acres.com/en
Date New Cases+/-change in new cases vs yesterday
3-3 21
3-4 31+10
3-5 75+46
3-6 99+24
3-7 116+17
3-8 121+5
3-9 179+58
3-10 290+111
3-11 247-43
3-12 425+178
3-13 528+103
3-14 732+204
3-15 710-22
New cases +/- change %change in new cases
3-16 965+258 +37%
3-17 1,454+489 +51%
3-18 2,645+1,191 +82%
3-19 5,437+2858 +108%
3-20 5,529+65 +1%
3-21 7,165+1,683 +23%
3-22 8,361+1165 +16%
3-23 9,828 +1,403 +17%
3-24 10,590 +783 +8%
3-25 13,984 +3,369 +32%
3-26 16,905 +2,863 +20%
3-27 18,780 +2,101 +12%
3-28 20,028 +1,039 +5%
3-29 17,989 -1,853 -9%
3-30 21,844 +3,790 +21%
3-31 25,747- +3,774 +17%
4-1 26,558 +837 +3%
4-2 29,738 +3,180 +12%
4-3 32,592 +2,754 +9%
4-4 34,126 +1,534 +6% High for daily number
4-5 25,796 -8,330 -25%
4-6 31,185 +5,389 +21%
4-7 31,676 +491 +2%
4-8 32,989 +1,313 +4%
4-9 34,408 +1,419 +4% Barely a new high with 4-4
4-10 34,244 +164 +0% Barely another new high for a triple top
4-11 30,142 -4,102 -12%
4-12 27,532 -2,510 -8%
4-13 26,540 -992 -4%
4-14 26,506 -34 -0%
4-15 30,413 +3,907 +15%
4-16 32,029 +1,616 +5% Bouncing higher after the extremely dry air mass hit. Is this from weather? https://www.marketforum.com/forum/topic/49391/
4-17 30,980 -1,049 -3%
4-18 28,687 -2,293 -8%
4-19 25,596 -3,091 -11%
4-20 28,043 +2,447 +10%
4-21 26,558 -1,485 -5%
4-22 29,304 +2,746 +10%
Total cases 856,584
Sunday: Lowest daily increase in new cases since March 30th. However, Sunday's in the past have a tendency to report low numbers.
++++++++++++++++++++++++++++++++++++++++++++++++++++
Monday: Like the previous 3 Sunday's, yesterday was in fact too low as we thought. Deaths for the 14th, which were suddenly increased by over 3,000(on the 18th).......were increased even more for that one day, now at 6,142.......well over double 2nd place. The only thing that I can think of to explain this is that a bunch of deaths were "found" after the 14th and they assigned them all to that day for some unknown reason.
+++++++++++++++++++++++++++++++++++
Tuesday: Back down a bit but deaths jumped higher today(still not even half of the crazy high number they gave us for the 14th.
+++++++++++++++++++++++++++++++++++++++++
Wednesday: Cutworm made a profound point a couple of days ago about the increase in testing. Recent studies are finding there may have been as many as 50 times more infected than we originally thought. If that's the case, than the massive increase in testing is picking up people that previously didn't get counted in the daily new case stat. This seems to be the main explanation for why we are not falling as expected.
++++++++++++++++++++++++++++++++
What do you have cutworm?
Info For these charts gleaned from https://www.worldometers.info/coronavirus/country/us/
The end date is 4-22.
Current rate 1.1535, 5 day moving average 0.992 The 5 day moving average has a downward trend.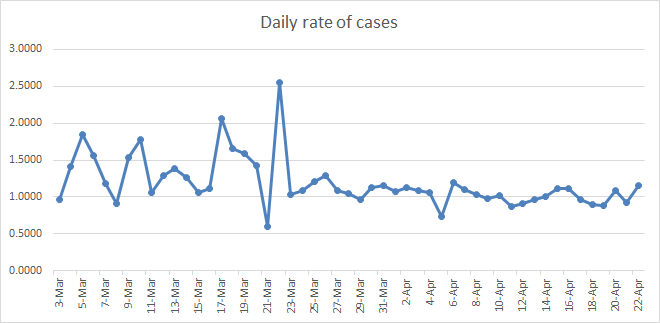
https://coronavirus.1point3acres.com/en
Date New Cases+/-change in new cases vs yesterday
3-3 21
3-4 31+10
3-5 75+46
3-6 99+24
3-7 116+17
3-8 121+5
3-9 179+58
3-10 290+111
3-11 247-43
3-12 425+178
3-13 528+103
3-14 732+204
3-15 710-22
New cases +/- change %change in new cases
3-16 965+258 +37%
3-17 1,454+489 +51%
3-18 2,645+1,191 +82%
3-19 5,437+2858 +108%
3-20 5,529+65 +1%
3-21 7,165+1,683 +23%
3-22 8,361+1165 +16%
3-23 9,828 +1,403 +17%
3-24 10,590 +783 +8%
3-25 13,984 +3,369 +32%
3-26 16,905 +2,863 +20%
3-27 18,780 +2,101 +12%
3-28 20,028 +1,039 +5%
3-29 17,989 -1,853 -9%
3-30 21,844 +3,790 +21%
3-31 25,747- +3,774 +17%
4-1 26,558 +837 +3%
4-2 29,738 +3,180 +12%
4-3 32,592 +2,754 +9%
4-4 34,126 +1,534 +6% High for daily number
4-5 25,796 -8,330 -25%
4-6 31,185 +5,389 +21%
4-7 31,676 +491 +2%
4-8 32,989 +1,313 +4%
4-9 34,408 +1,419 +4% Barely a new high with 4-4
4-10 34,244 +164 +0% Barely another new high for a triple top
4-11 30,142 -4,102 -12%
4-12 27,532 -2,510 -8%
4-13 26,540 -992 -4%
4-14 26,506 -34 -0%
4-15 30,413 +3,907 +15%
4-16 32,029 +1,616 +5% Bouncing higher after the extremely dry air mass hit. Is this from weather? https://www.marketforum.com/forum/topic/49391/
4-17 30,980 -1,049 -3%
4-18 28,687 -2,293 -8%
4-19 25,596 -3,091 -11%
4-20 28,043 +2,447 +10%
4-21 26,558 -1,485 -5%
4-22 29,304 +2,746 +10%
4-23 34,833 +5,529 +19% actually not surprised that we jumped higher based on new information that we are learning......huge increase in testing and possibly a 50 times higher rate of infection than what we thought that is now being captured better by this statistic.
Total cases 891,677
Sunday: Lowest daily increase in new cases since March 30th. However, Sunday's in the past have a tendency to report low numbers.
++++++++++++++++++++++++++++++++++++++++++++++++++++
Monday: Like the previous 3 Sunday's, yesterday was in fact too low as we thought. Deaths for the 14th, which were suddenly increased by over 3,000(on the 18th).......were increased even more for that one day, now at 6,142.......well over double 2nd place. The only thing that I can think of to explain this is that a bunch of deaths were "found" after the 14th and they assigned them all to that day for some unknown reason.
+++++++++++++++++++++++++++++++++++
Tuesday: Back down a bit but deaths jumped higher today(still not even half of the crazy high number they gave us for the 14th.
+++++++++++++++++++++++++++++++++++++++++
Wednesday: Cutworm made a profound point a couple of days ago about the increase in testing. Recent studies are finding there may have been as many as 50 times more infected than we originally thought. If that's the case, than the massive increase in testing is picking up people that previously didn't get counted in the daily new case stat. This seems to be the main explanation for why we are not falling as expected.
++++++++++++++++++++++++++++++++
Thursday: It's becoming more clear that people measuring positive is a flawed metric to tell us where we are compared to weeks ago. There could have been 50 times more people infected a month ago than we actually measured(most did not get sick). Now, we are measuring alot of those people which is inflating this stat..........even as infections go down.
++++++++++++++++++++++++++++++++++++++++++++++++++
https://www.marketforum.com/forum/topic/50894/
Most mind boggling COVID-19 fact yet
Rate might be 50 times greater than what we thought
Started by metmike - April 20, 2020, 7:11 p.m.
++++++++++++++++++++++++++++++++++++++++++++++++++++
https://www.marketforum.com/forum/topic/51095/
Game changing-Summer kills COVID-19
Started by metmike - April 23, 2020, 10:36 p.m.
Hi Mike
Is the number of infections reported from hospitalization or infections that do not require hospitalization but merely home quarantine as my wife and myself had to do. By the way our quarantine is done. My wife was rather sick and I did the cooking for a number of days. My wife did not eat much and lost weight but is okay now. I wonder if she would show up in any stats as an infection?? She did call the hot line and was put on some kind of register of possible infection, then told to home quarantine. I did voluntary quarantine as I thought living together and touching all the same surfaces put me at risk to infect others, thus my voluntary quarantine. I was told I was not in quarantine but that made no sense to me.
Makes me wonder what the stats actual count
Hello Wayne, there are big problems with the data that we have because of several factors. 1 more testing being done, 2 the first reported cases were not only symptomatic but very symptomatic, asymptomatic cases were unknown, 3 now testing of groups to find asymptomatic cases, 4 cases like yours where it may or may not be in the data. Any of these issues is a concern. It is a problem not just in these charts but in many other resources.
Info For these charts gleaned from https://www.worldometers.info/coronavirus/country/us/
The end date is 4-24.
Current rate 1.2586, The highest since 4-2. The 5 day moving average 1.063 the highest since 4-10
Cutworm: I suspect a glitch in the collection and reporting.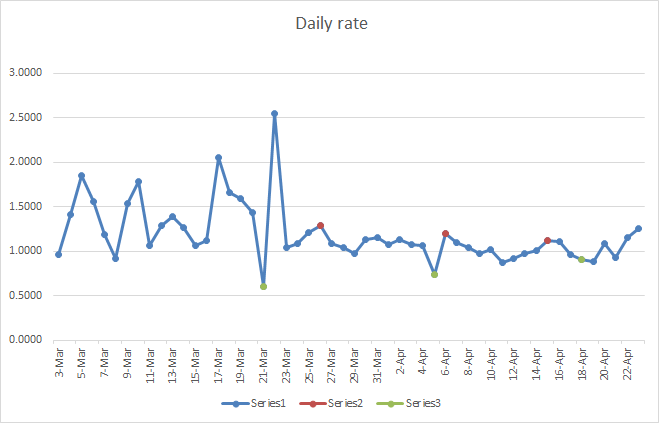

The more I've been thinking about it recently, the more I'm realizing that the reporting lag of 2 weeks+ is really making it difficult to follow things in GA and elsewhere on a daily basis. For example, regarding infections with first symptoms as of today (4/24), we really won't have a good handle on that number for at least 2 weeks and maybe not til 3 weeks. And then when one considers that it can take a week from getting infected to showing first symptoms, it is even more complicated to analyze trends.
So, today's increase in reported cases at the main GA website is largely going to be from folks first getting infected way back near the start of April! Do folks realize this?
Larry,
This is why I was using this leading indicator below for March and up until around a week ago to anticipate what was coming. However, I underestimated(and everybody else too) how many more cases were actually out there than we were testing for. Possibly 50 times more people were infected than we realized but were not testing. Now that we are testing much more, REAL infections can be going down but even when they are down, let's say by 50%, if we are testing 300% more people every day compared to before.......... then the number of daily positives in the tests will go higher.
This source has strongly suggested that fevers and sickness have been plunging for weeks.......even as we test more of the ones that have COVID.
https://healthweather.us/?mode=Atypical
https://coronavirus.1point3acres.com/en
Date New Cases+/-change in new cases vs yesterday
3-3 21
3-4 31+10
3-5 75+46
3-6 99+24
3-7 116+17
3-8 121+5
3-9 179+58
3-10 290+111
3-11 247-43
3-12 425+178
3-13 528+103
3-14 732+204
3-15 710-22
New cases +/- change %change in new cases
3-16 965+258 +37%
3-17 1,454+489 +51%
3-18 2,645+1,191 +82%
3-19 5,437+2858 +108%
3-20 5,529+65 +1%
3-21 7,165+1,683 +23%
3-22 8,361+1165 +16%
3-23 9,828 +1,403 +17%
3-24 10,590 +783 +8%
3-25 13,984 +3,369 +32%
3-26 16,905 +2,863 +20%
3-27 18,780 +2,101 +12%
3-28 20,028 +1,039 +5%
3-29 17,989 -1,853 -9%
3-30 21,844 +3,790 +21%
3-31 25,747- +3,774 +17%
4-1 26,558 +837 +3%
4-2 29,738 +3,180 +12%
4-3 32,592 +2,754 +9%
4-4 34,126 +1,534 +6% High for daily number
4-5 25,796 -8,330 -25%
4-6 31,185 +5,389 +21%
4-7 31,676 +491 +2%
4-8 32,989 +1,313 +4%
4-9 34,408 +1,419 +4% Barely a new high with 4-4
4-10 34,244 +164 +0% Barely another new high for a triple top
4-11 30,142 -4,102 -12%
4-12 27,532 -2,510 -8%
4-13 26,540 -992 -4%
4-14 26,506 -34 -0%
4-15 30,413 +3,907 +15%
4-16 32,029 +1,616 +5% Bouncing higher after the extremely dry air mass hit. Is this from weather? https://www.marketforum.com/forum/topic/49391/
4-17 30,980 -1,049 -3%
4-18 28,687 -2,293 -8%
4-19 25,596 -3,091 -11%
4-20 28,043 +2,447 +10%
4-21 26,558 -1,485 -5%
4-22 29,304 +2,746 +10%
4-23 34,833 +5,529 +19% actually not surprised that we jumped higher based on new information that we are learning......huge increase in testing and possibly a 50 times higher rate of infection than what we thought that is now being captured better by this statistic.
4-24 37,346 +2,513 +7% Not surprised at the new high. Much more testing and many more cases out there all along than what we realized.
Total cases 928,657
Sunday: Lowest daily increase in new cases since March 30th. However, Sunday's in the past have a tendency to report low numbers.
++++++++++++++++++++++++++++++++++++++++++++++++++++
Monday: Like the previous 3 Sunday's, yesterday was in fact too low as we thought. Deaths for the 14th, which were suddenly increased by over 3,000(on the 18th).......were increased even more for that one day, now at 6,142.......well over double 2nd place. The only thing that I can think of to explain this is that a bunch of deaths were "found" after the 14th and they assigned them all to that day for some unknown reason.
+++++++++++++++++++++++++++++++++++
Tuesday: Back down a bit but deaths jumped higher today(still not even half of the crazy high number they gave us for the 14th.
+++++++++++++++++++++++++++++++++++++++++
Wednesday: Cutworm made a profound point a couple of days ago about the increase in testing. Recent studies are finding there may have been as many as 50 times more infected than we originally thought. If that's the case, than the massive increase in testing is picking up people that previously didn't get counted in the daily new case stat. This seems to be the main explanation for why we are not falling as expected.
++++++++++++++++++++++++++++++++
Thursday: It's becoming more clear that people measuring positive is a flawed metric to tell us where we are compared to weeks ago. There could have been 50 times more people infected a month ago than we actually measured(most did not get sick). Now, we are measuring alot of those people which is inflating this stat..........even as infections go down.
Added: Numbers could continue higher even as infections go down. What we would need is hospitalizations of actual sick people from all 50 states to properly gauge where the entire country is at(but individual states vary tremendously and this matters alot)
++++++++++++++++++++++++++++++++++++++++++++++++++
Friday: New high for daily increase in new positives.......from increased testing. We saw this coming. I did some research earlier on Friday on different states that I will share on Saturday. The best metric right now to have an accurate assessment of where we are would be hospitalizations. But the huge problem is that some states, like MI and IN don't report this. Other states only update this stat every fews days. Some states update hospitalizations every day. We would need every state to do this to use it to represent the US and that ain't happenin )-:
https://www.marketforum.com/forum/topic/50894/
Most mind boggling COVID-19 fact yet
Rate might be 50 times greater than what we thought
Started by metmike - April 20, 2020, 7:11 p.m.
++++++++++++++++++++++++++++++++++++++++++++++++++++
https://www.marketforum.com/forum/topic/51095/
Game changing-Summer kills COVID-19
Started by metmike - April 23, 2020, 10:36 p.m.
Info For these charts gleaned from https://www.worldometers.info/coronavirus/country/us/
The end date is 4-24.
Current rate 1.0282, The 5 day moving average 1.090 the highest since 4-10
Cutworm: I suspect that a change in collection and reporting (more test being done) has skewed the results. I believe that we were only testing critically symptomatic persons. Now we are testing more lessor symptomatic persons.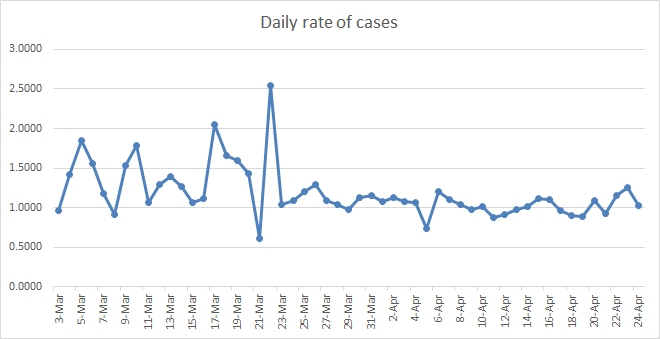
 .
.
There is no question, as cutworm and I have suspected for some time, that the big increase in the number of tests administered is causing an increase in the number of those testing positive...........even as the REAL WORLD cases has dropped off.
After learning that as many as 50 times more people had been infected than what we realized, this was inevitable. For instance, if we were only testing a tiny fraction of the population before that had the most severe symptoms, and now are testing 4 times as many people, even if the REAL WORLD rate is only 25% of what it was before, the number testing positive is not going to fall.
There is no way to apply a formula to account for this. Ideally, hospitalizations would be the perfect metric to gauge how many sick people that we have(though it would be a lagging indicator and with 50 times more infected than what we thought, the vast, vast majority of those with the virus will still not be going to hospitals and not show up in that stat).
This will be the end of my regular, daily and sometimes hourly updates since their ability to provide useful information is limited. I actually started them back in January, using the Chinese data, that we now know was concocted.
I will continue to provide updates in all sorts of threads with good/valuable information but just not these daily updates.
I am extremely grateful to cutworm for his constant updates and valuable data with insights. It helps a great deal to have another set of intelligent, analytical eyes confirming your thoughts(or questioning them when appropriate which actually never happened between us in this team effort endeavor).
I will copy the emails below that I sent out to my family earlier this week when trying to get a better handle on the status of us trying to gauge the amount of coronavirus out there.
"I did more checking this morning on the number of tests being used for several states and it confirms what I think is causing the positive cases based on measured data to NOT fall as expected vs the real cases to probably falling.
An increase in the number of tests.
But I found data issues that tells us the data is not very reliable.
Unfortunately, each state reports differently. MI does not report hospitalization rates which would be the ideal metric for us to use.
Georgia does and their hospital rates have been falling, so this is evidence for them to open up.....................even as their new positives from increased testing goes up and tell us they should remain shut down. They have basically doubled their test this month.......so that explains a big part of more MEASURED positives vs real world infections that are likely going down.
I will look more but this makes me even more skeptical that we can trust this data because sometimes, its pretty messed up.
For instance, last Saturday and Wednesday in MI, they only tested around 20% of the number for any other day in April but every person was positive and no negatives, when the normal ratio is something like 10 negatives/positive. This is impossible.
There is no rational explanation for daily errors this huge(there are others) that would convince me that we can trust the data and sources.
Some states probably have it together and can be trusted and maybe MI is way more messed up than the others but I am wasting time providing the daily infection rate numbers as a predictive tool.
I looked at several more states after typing that. MI is by far the worst. All the other states have hospitalizations but not MI. This is the one thing that would tell us the most.
However, NY has 0 new hospitalizations in the state for the last 3 days in a row.............even with 16,000 new cases during the same period. This is impossible and just another example of why we can't trust the data.
https://covidtracking.com/data/state/michigan#historical
| |||||||||
|---|---|---|---|---|---|---|---|---|---|
| https://covidtracking.com/data/state/georgia | |||||||||
Additional email:
I see why NY has no new hospitalizations this week. Many states do not update this stat every day (MI does not even have it). So we have an increase of 0 for numerous days...........then it gets updated and suddenly jumps higher.
When the numbers plunged in NY, I will guess that they stopped reporting hospitalizations daily. Which, again makes it impossible for somebody to accurately track the country, since each state does things differently and in some states like Michigan, there are wild, random, unexplainable data spikes well beyond what random variation in the natural world would explain and what data gathering flaws would explain.
The data gathering flaws(including effects of ramping up of testing) are just too great for me to continue using the US compilation of the data the way that I have.
So I looked at Alaska, Mariann's state.
A state in great shape!
No new deaths for 10 days. Only a handful of new cases every day this week. No new hospitalizations in the last week, although this could be because they have not updated that number, which is the problem. In many some states/cases it means they are just not updating it every day but in others like Alaska with really low numbers all along, it probably really means no new hospitalizations that day.
https://covidtracking.com/data/state/alaska#historical
| Alaska | The COVID Tracking Project Total tests are taken from the annotations on the charts on the page. Negatives = (Totals – Positives) Positives occasionally update before totals do; do not revise negatives down, keep the last calculated negative. covidtracking.com |
Last email:
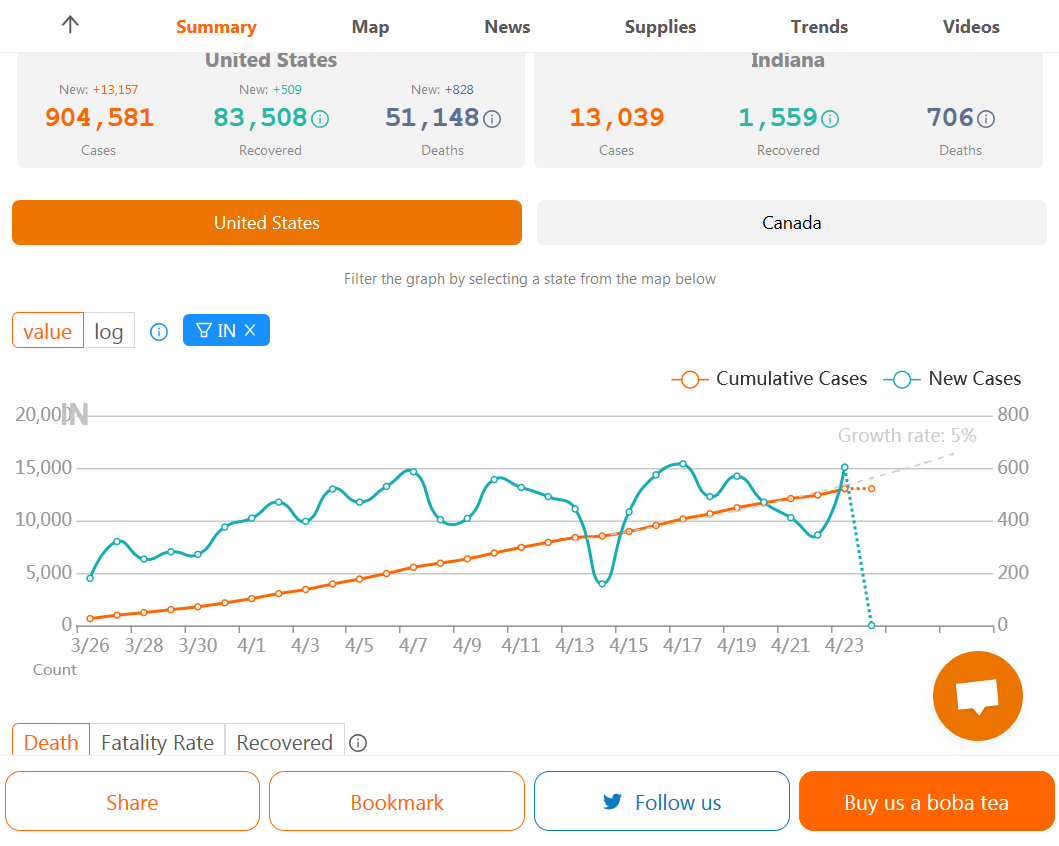
"Indiana is another state, like Michigan that does not give us hospitalizations. The 2 states that are the most important for us to have this measurement from. Again, this means its impossible to track REAL sick people.
As mentioned a bunch of times, more testing is increasing the ratio of people that have COVID that are now actually being captured with the testing process. So the REAL numbers(that includes everybody not tested) will fall but the additional people being captured that were not tested before but are now, will go up to offset the REAL drop.
Here is Indiana below. I've included a graph of the numbers in the attachment from another site for you to see how the data for new infections DETECTED (positives) is on a roller coaster ride and is not very useful in telling us what is happening or where we might be going.
Number of new tests administered are all over the place too, with last Sunday, spiking higher(when most of the other states and US have less testing on Saturdays)"
https://covidtracking.com/data/state/indiana#historical
| Indiana | The COVID Tracking Project The COVID Tracking Project collects and publishes the most complete testing data available for US states and territories. covidtracking.com |
The following is info gleaned from the Franklin County Sheriff office Face book page:
93 reported cases as of 4-24
7 deaths all over 60 years old
only reports 1 child testing positive
last death 4-7
many co- habitants of positive symptomatic have been released from quarantine with no symptoms
Franklin county population is just less than 23,000
Edit: 4 people still on ventilators
Also note that there has not been any testing of non symptomatic that I Know of
Did I miss something? Why did these stop?
Hi Tim,
Read the explanations above.
The great increase in testing, in combination with studies which show that as many as 50 times more people had the virus made it increasingly clear that data for new people testing positive was not the best metric for measuring those infected in the real world.
If we are testing 4 times as many people for instance, the positives will still go up even with half as many infected..........because many that were infected in the past were never tested.
Hospitalization rates would be great........but some states don't provide any data on this, some update every several days, some update every day.
For the states that update this stat every day, its wonderful.
The numbers were down alot the last 2 days. I may update this every few days or at random times when I get the chance and cutworm is welcome to do that, although he devoted alot of his precious time during this crisis to help keep us posted already.
Info For these charts gleaned from https://www.worldometers.info/coronavirus/country/us/
The end date is 4-28.
Current rate 10954, 5 day moving average 0.932 The low on the chart and on downward trend. 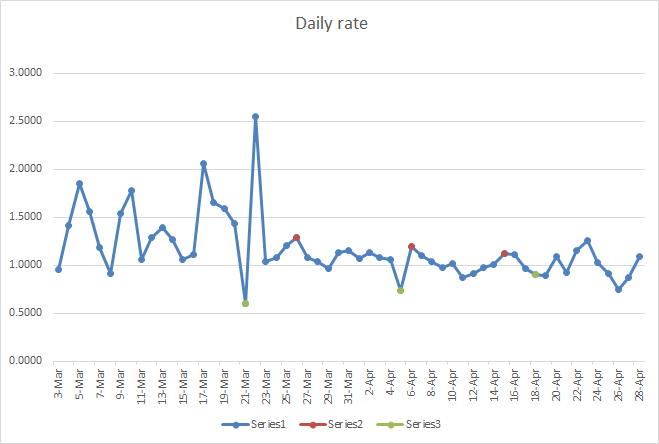
Info For these charts gleaned from https://www.worldometers.info/coronavirus/country/us/
The end date is 4-29.
Current rate 1.1189, 5 day moving average 0.950
CW: I remain skeptical about the data collections and any conclusions from these charts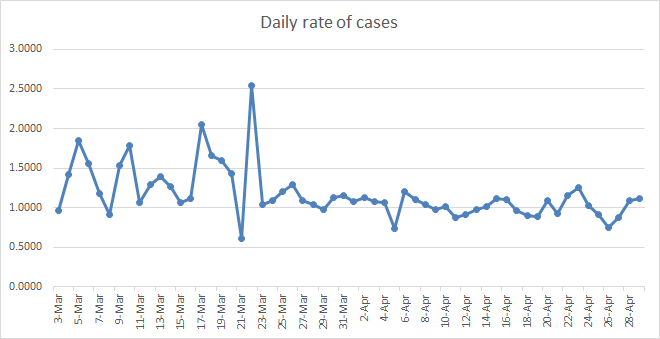
Thanks very much cutworm. Keep it coming. I'll try to have some updates too..........been working on a project this week.
Back by popular demand (-: With some good graphs now to go with cutworms great graphs!
https://coronavirus.1point3acres.com/en
Date New Cases+/-change in new cases vs yesterday
3-3 21
3-4 31+10
3-5 75+46
3-6 99+24
3-7 116+17
3-8 121+5
3-9 179+58
3-10 290+111
3-11 247-43
3-12 425+178
3-13 528+103
3-14 732+204
3-15 710-22
New cases +/- change %change in new cases
3-16 965+258 +37%
3-17 1,454+489 +51%
3-18 2,645+1,191 +82%
3-19 5,437+2858 +108%
3-20 5,529+65 +1%
3-21 7,165+1,683 +23%
3-22 8,361+1165 +16%
3-23 9,828 +1,403 +17%
3-24 10,590 +783 +8%
3-25 13,984 +3,369 +32%
3-26 16,905 +2,863 +20%
3-27 18,780 +2,101 +12%
3-28 20,028 +1,039 +5%
3-29 17,989 -1,853 -9%
3-30 21,844 +3,790 +21%
3-31 25,747- +3,774 +17%
4-1 26,558 +837 +3%
4-2 29,738 +3,180 +12%
4-3 32,592 +2,754 +9%
4-4 34,126 +1,534 +6% High for daily number
4-5 25,796 -8,330 -25%
4-6 31,185 +5,389 +21%
4-7 31,676 +491 +2%
4-8 32,989 +1,313 +4%
4-9 34,408 +1,419 +4% Barely a new high with 4-4
4-10 34,244 +164 +0% Barely another new high for a triple top
4-11 30,142 -4,102 -12%
4-12 27,532 -2,510 -8%
4-13 26,540 -992 -4%
4-14 26,506 -34 -0%
4-15 30,413 +3,907 +15%
4-16 32,029 +1,616 +5% Bouncing higher after the extremely dry air mass hit. Is this from weather? https://www.marketforum.com/forum/topic/49391/
4-17 30,980 -1,049 -3%
4-18 28,687 -2,293 -8%
4-19 25,759 -3,091 -11%
4-20 28,372 +2,447 +10%
4-21 26,735 -1,485 -5%
4-22 29,581 +2,746 +10%
4-23 34,539 +5,529 +19% actually not surprised that we jumped higher based on new information that we are learning......huge increase in testing and possibly a 50 times higher rate of infection than what we thought that is now being captured better by this statistic.
4-24 37,243 +2,513 +7% Not surprised at the new high. Much more testing and many more cases out there all along than what we realized.
4-25 31,617
4-26 27,077
4-27 24,454
4-28 25,314
4-29 28,932
4-30 31,579
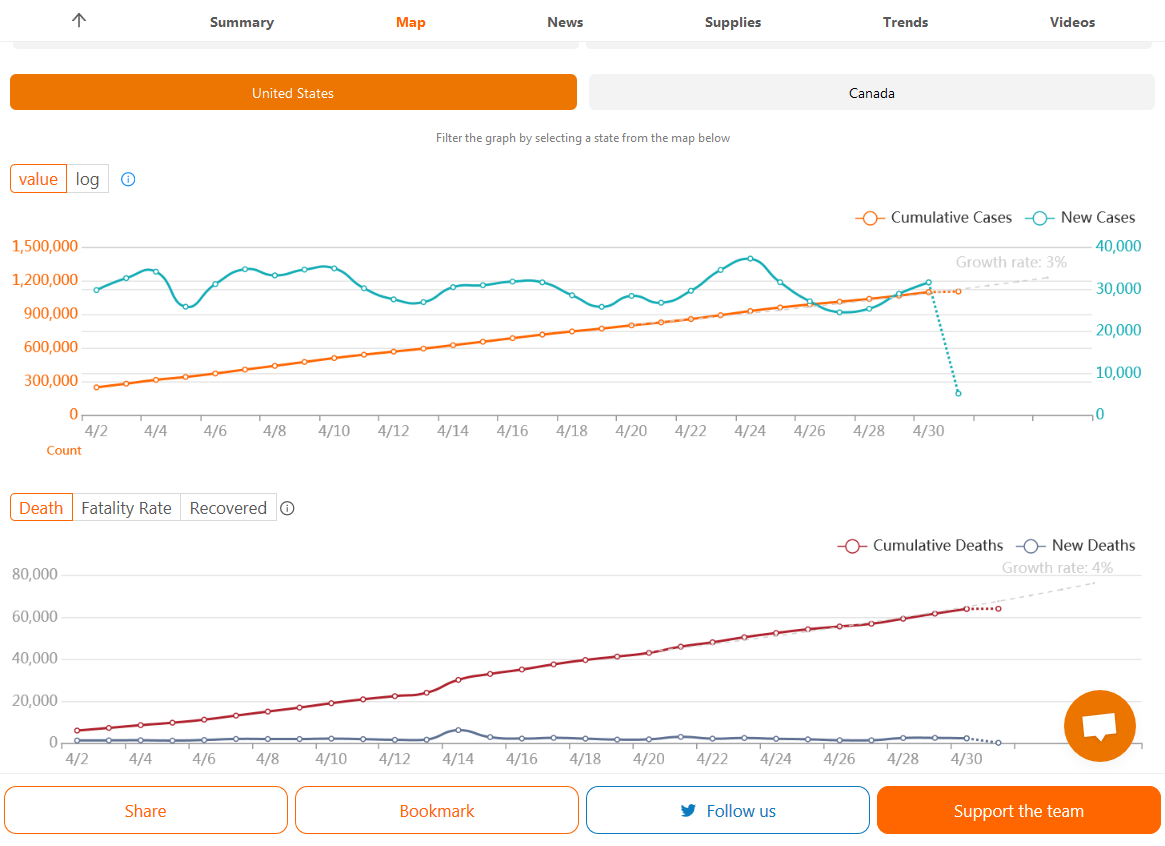
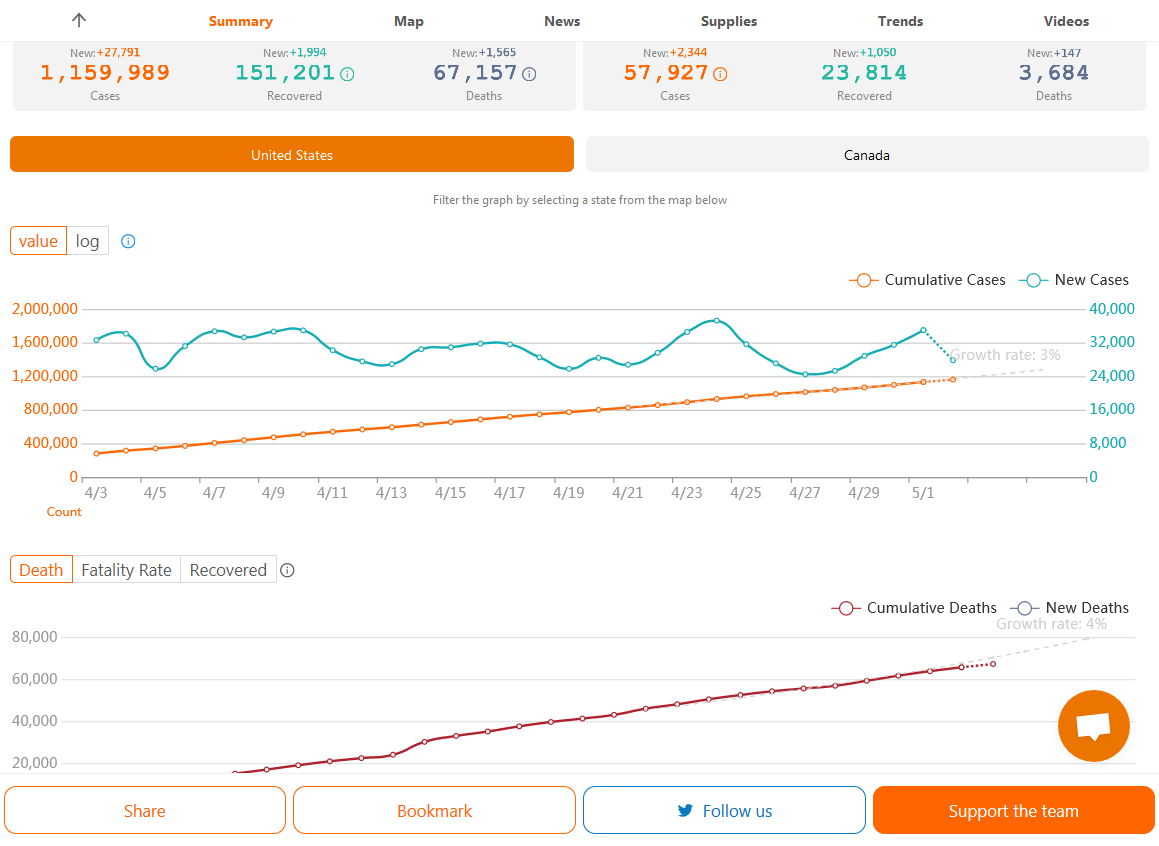
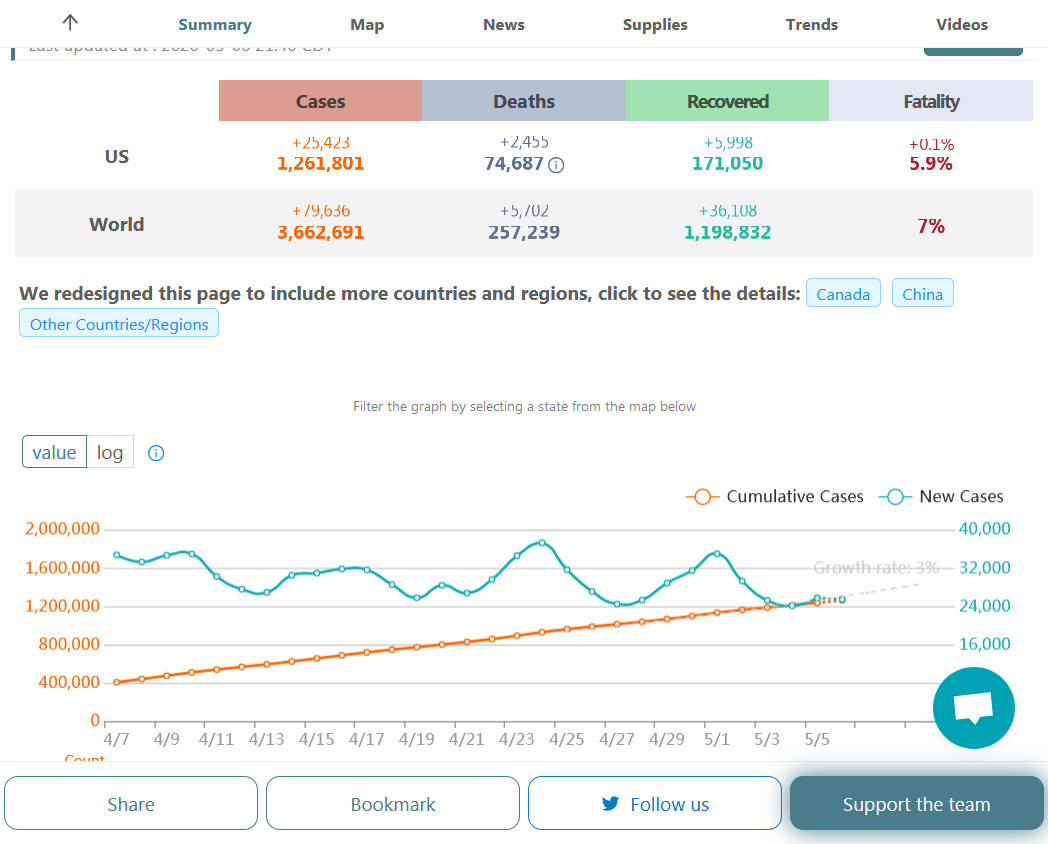
Total cases 1,081,531
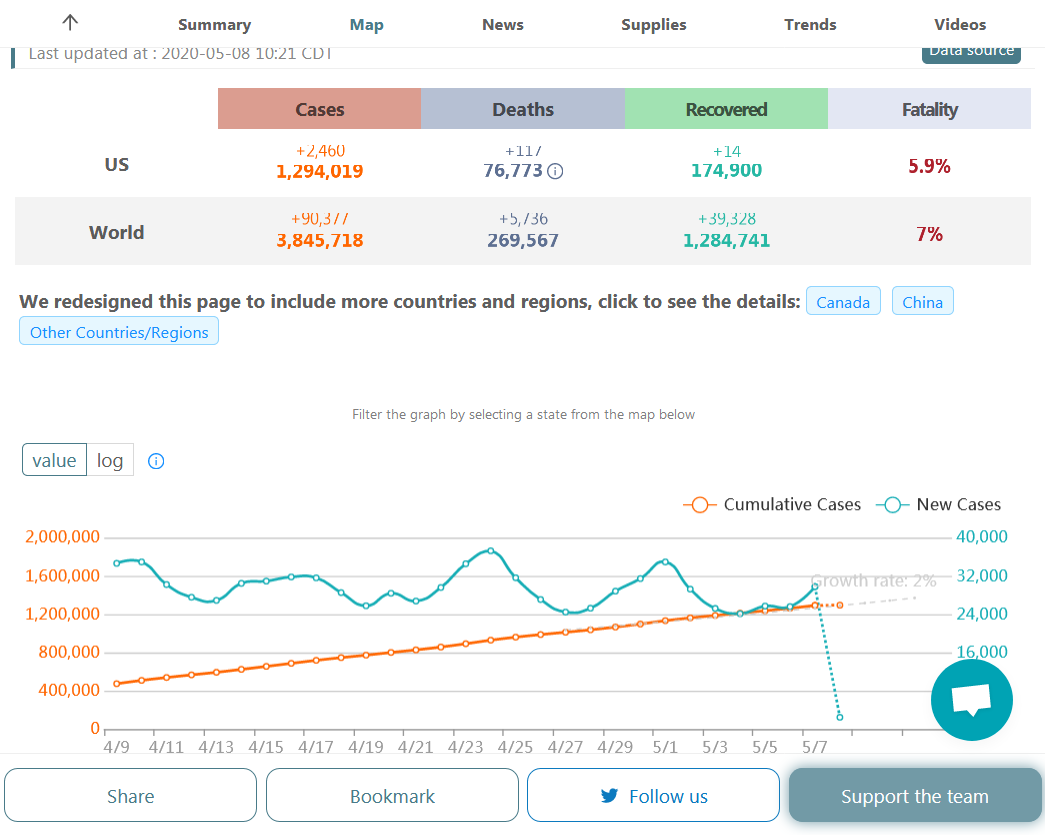
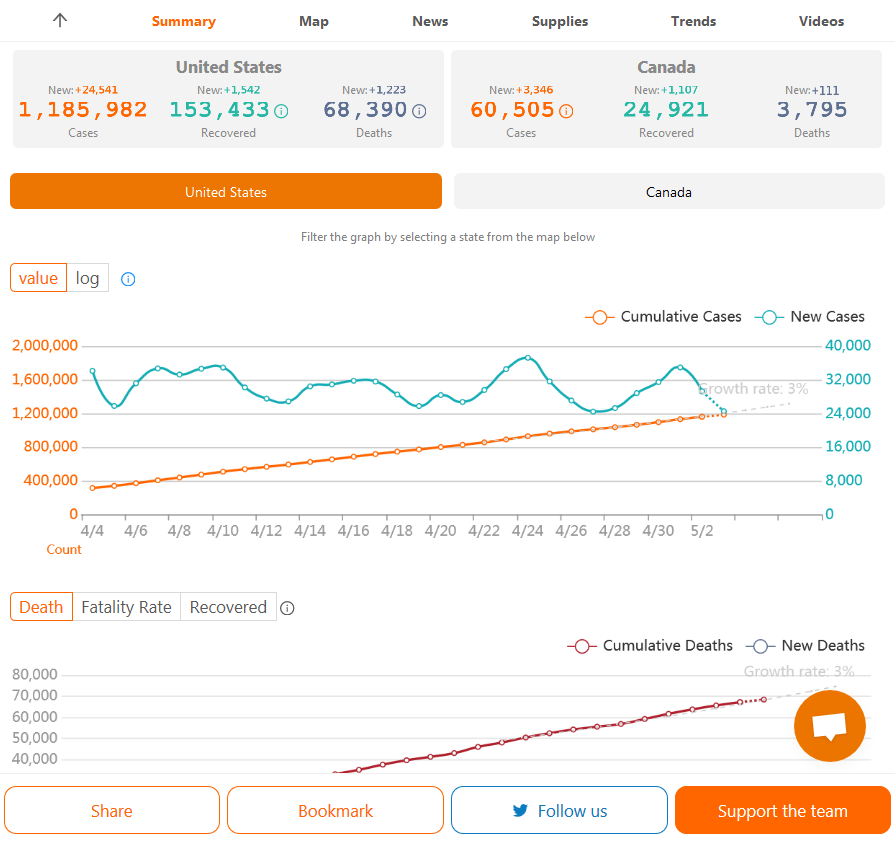
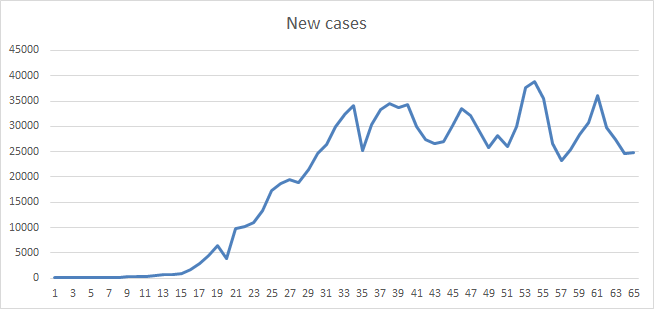
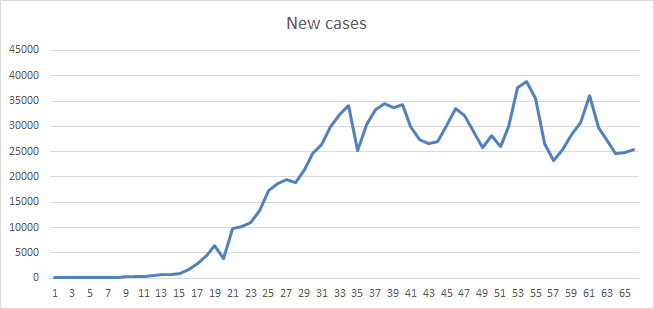
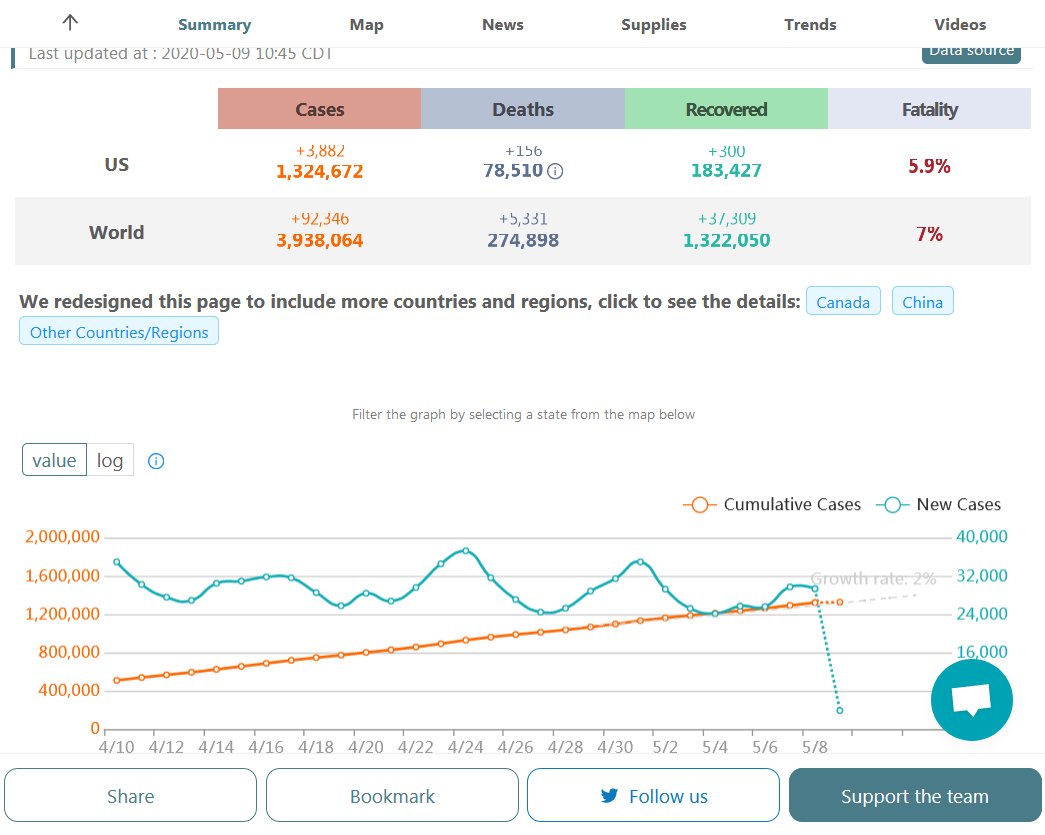
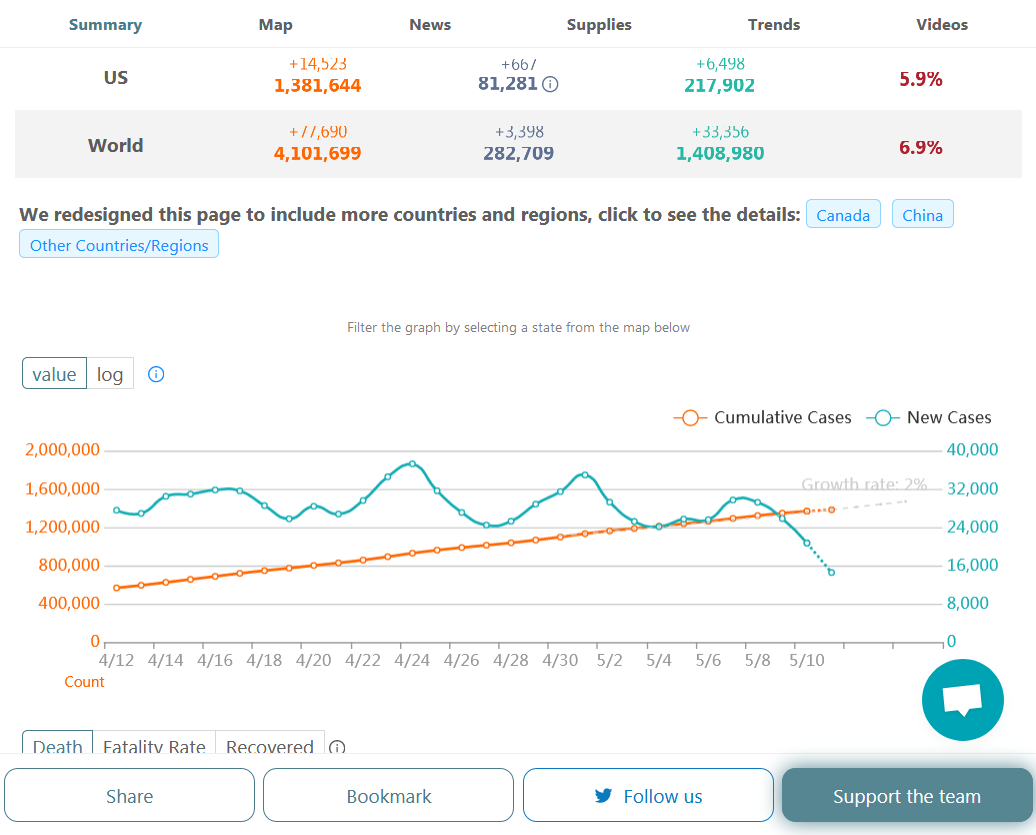
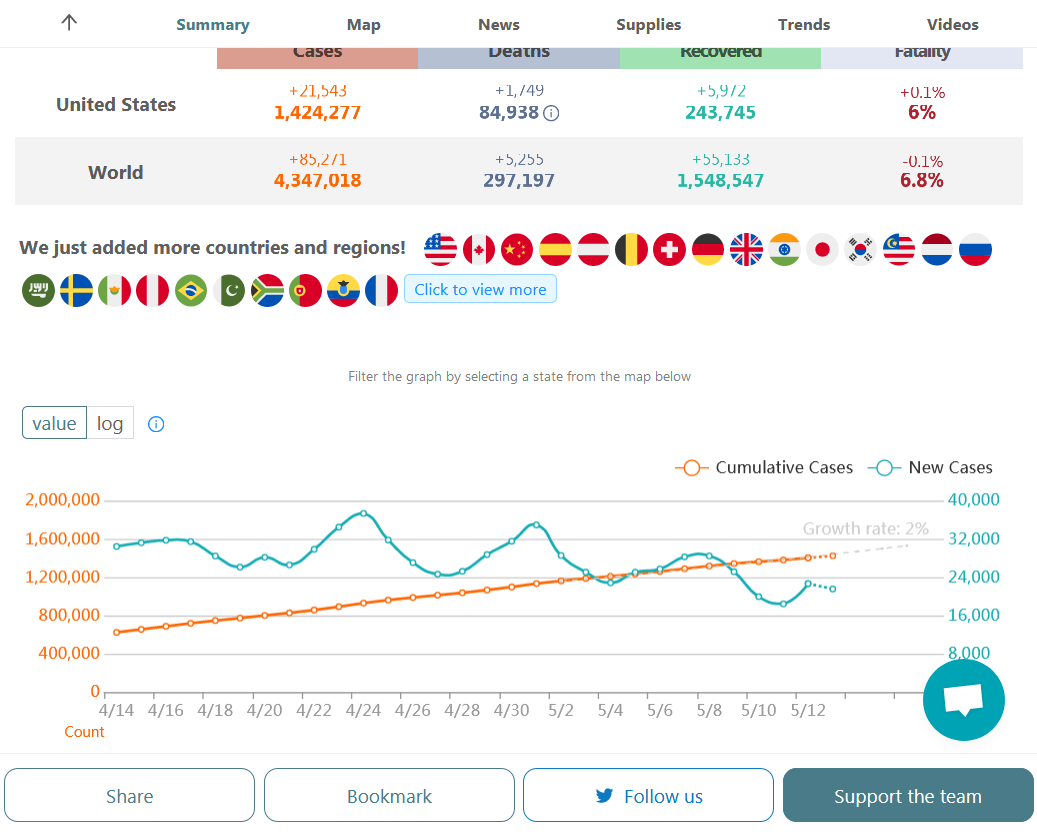
The graphs below show the daily infections at the top(blue line daily increase-orange line total increase) and deaths at the bottom(red line total deaths). The last blue dot is always going to be low until late in the day.
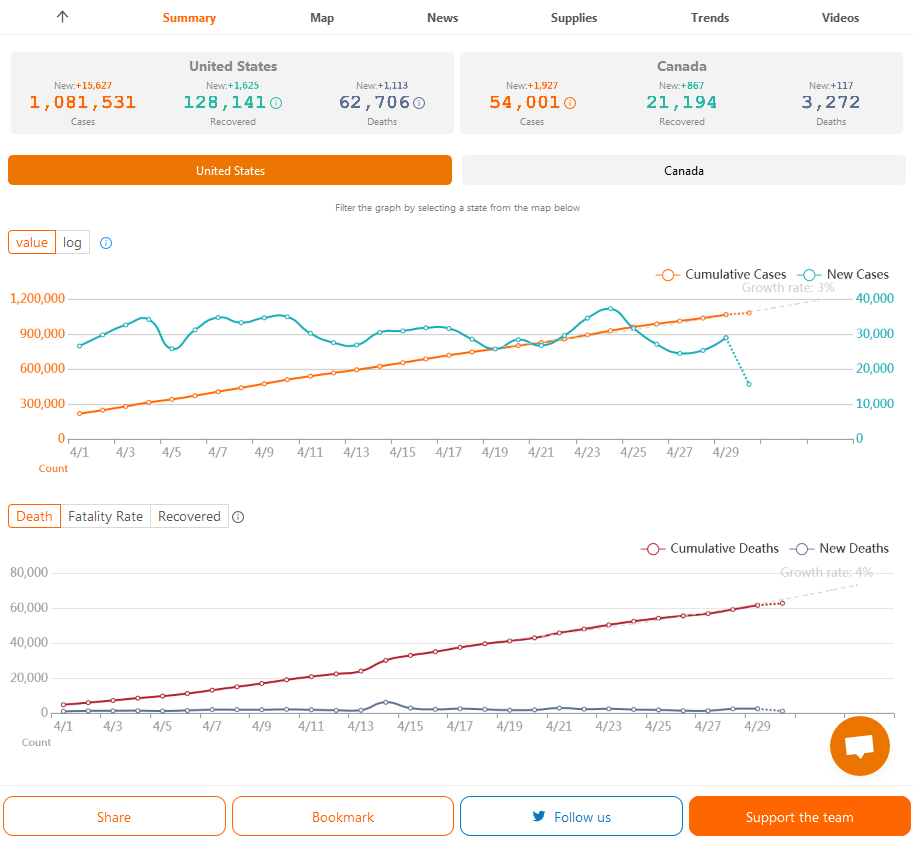
I appreciate the effort. I realize that because of "non-standard" reporting and variance in testing, the data and conclusions are questionable, particularly in the short term (Day/Day-Wk/Wk), but in the long term, patterns might emerge.
Info For these charts gleaned from https://www.worldometers.info/coronavirus/country/us/
The end date is 4-30.
Current rate 1.0844, 5 day moving average 0.984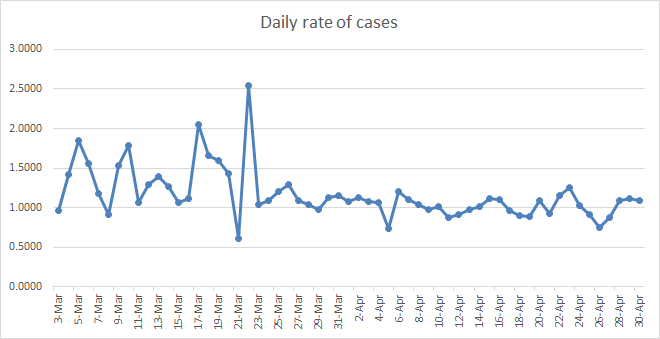
Thanks Tim!
At this point, showing graphs are going to do best at portraying the big picture. The graphs below are from the site and data that I've been showing from here:
https://coronavirus.1point3acres.com/en
They go well with cutworms great graphs that allow us to see things using the same data but using a different data analysis method that helps tell us more than just if the raw numbers are going higher or lower.
Regardless, increasing the testing rate greatly is capturing a greater % of positives that we didn't know were out there before and this is likely showing up in the daily positive increases which is offsetting REALITY decreases. How would it not?
Another factor that is slowing the drop is the chilly dry air vs the seasonal big warm up that typically helps to kill off virus's.
Info For these charts gleaned from https://www.worldometers.info/coronavirus/country/us/
The end date is 5-1.
Current rate 1.1680, 5 day moving average 1.068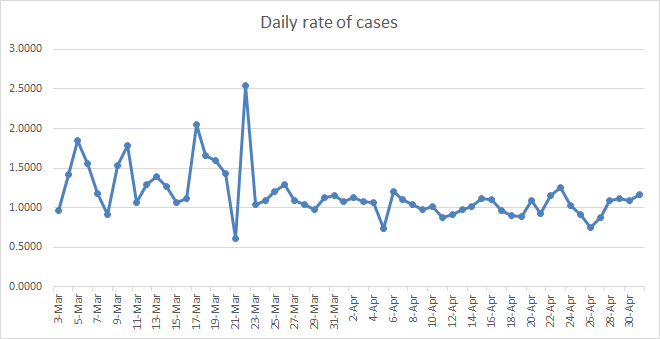
Holding pretty steady because of the increase in testing offsetting the likely drop in infections.
Info For these charts gleaned from https://www.worldometers.info/coronavirus/country/us/
The end date is 5-2.
Current rate 0.8252, 5 day moving average 1.058
CW: There seems to lower than normal reporting on Saturdays and Sundays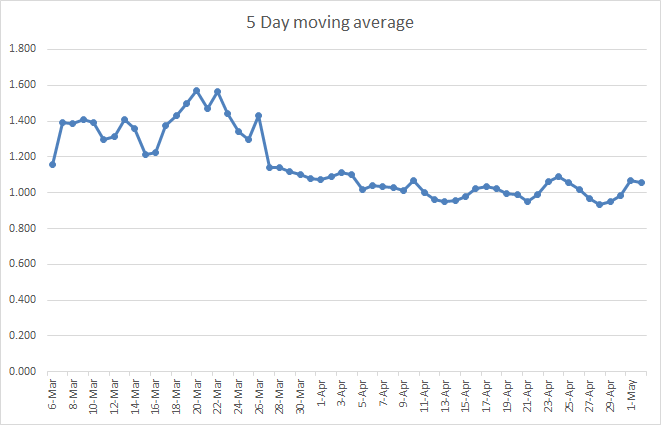
We had our usual Sunday dip again. 2nd Lowest number since March though, which is great news! New positive cases recently have stayed elevated from the increase in tests administered.
Info For these charts gleaned from https://www.worldometers.info/coronavirus/country/us/
The end date is 5-3.
Current rate .9214, 5 day moving average 1.024

Thanks cutworm!
Today was the lowest number for new infections(24,158) going back to March 30th! Hurray! And that's with the big increase in testing.
.png)
Info For these charts gleaned from https://www.worldometers.info/coronavirus/country/us/
The end date is 5-4.
Current rate 0.9027, 5 day moving average 0.980
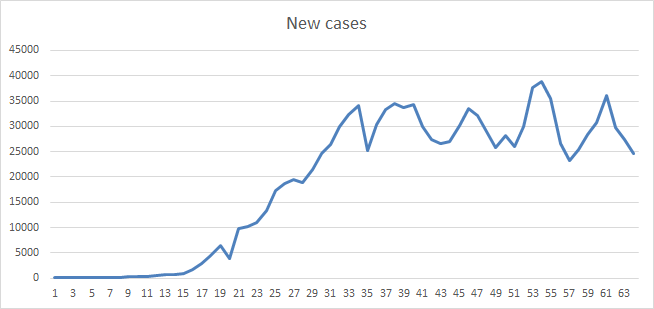
I add a new chart of new daily reported cases 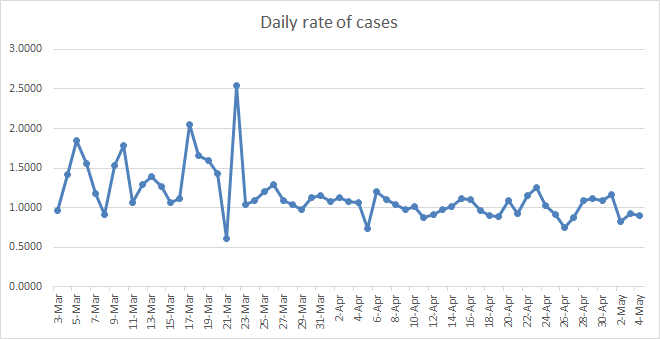
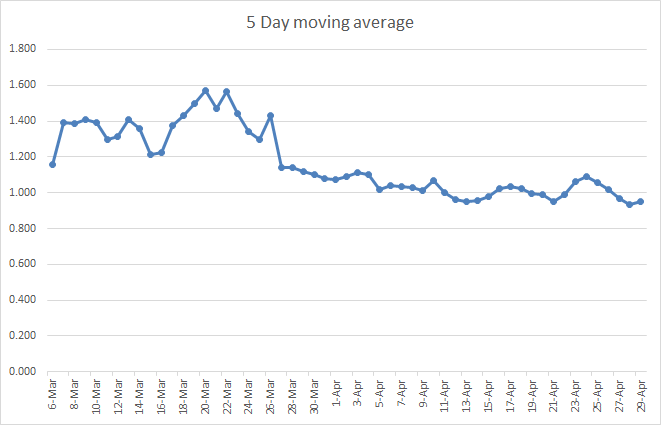
Info For these charts gleaned from https://www.worldometers.info/coronavirus/country/us/
The end date is 5-5.
Current rate 1.0034, 5 day moving average 0.964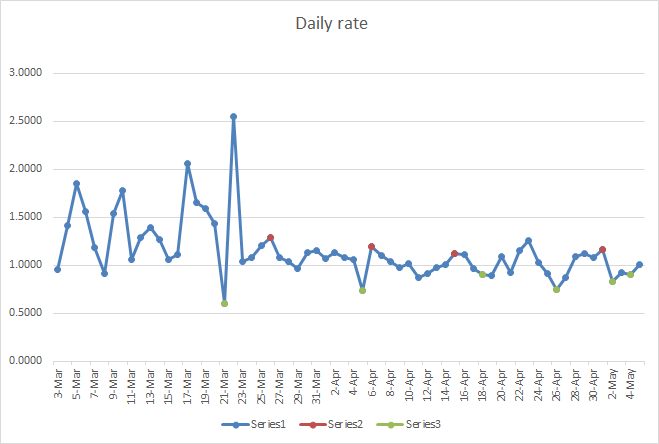
Thanks again cutworm!
Numbers staying steady, near the lows of the last month.
https://coronavirus.1point3acres.com/en
Info For these charts gleaned from https://www.worldometers.info/coronavirus/country/us/
The end date is 5-6.
Current rate 1.0267, 5 day moving average 0.936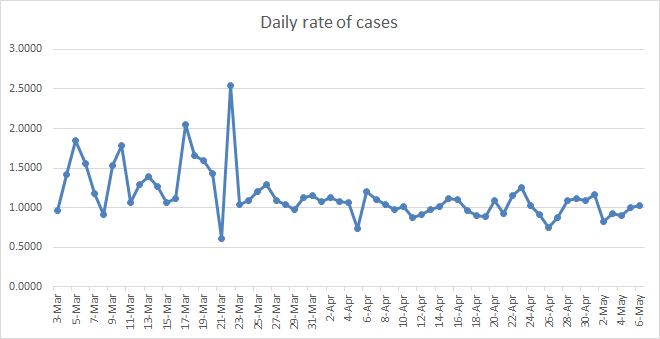
Info For these charts gleaned from https://www.worldometers.info/coronavirus/country/us/
The end date is 5-7.
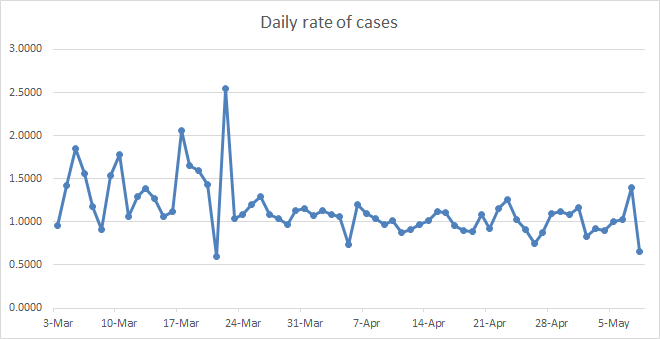
Current rate 1.3956, 5 day moving average 01.050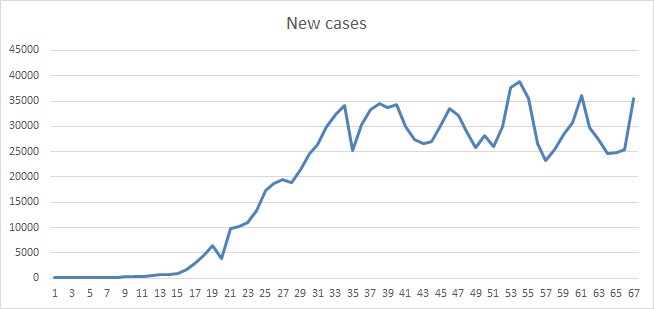
Info For these charts gleaned from https://www.worldometers.info/coronavirus/country/us/
The end date is 5-8.
Current rate .6519, 5 day moving average 0.996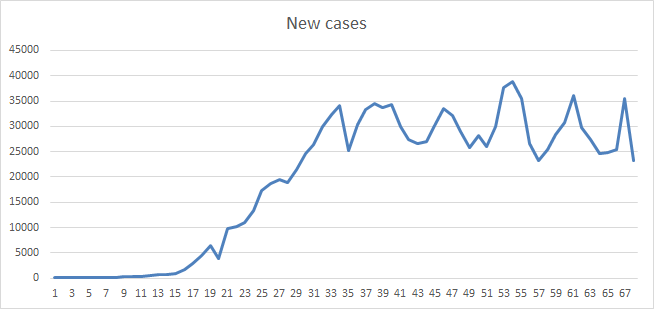

Thanks cutworm!
Interesting that your source(pj uses that one too) shows such a big drop yesterday. The drop of the last point below from this source is just because its so early on Saturday and not much data has been loaded.
You can get data from this source here:
https://coronavirus.1point3acres.com/en
Info For these charts gleaned from https://www.worldometers.info/coronavirus/country/us/
The end date is 5-9.
Current rate 1.020, 5 day moving average 1.036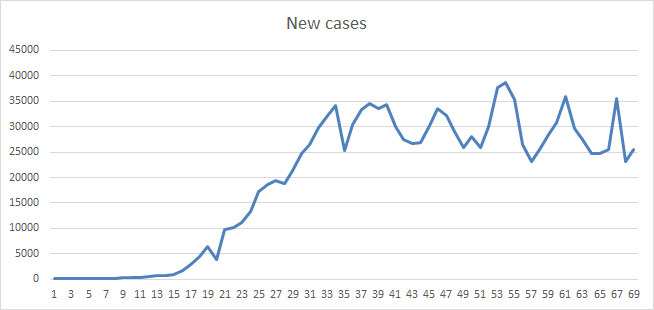
https://coronavirus.1point3acres.com/en
Numbers here on Sunday were MUCH lower than any previous daily new COVID-19 numbers, going back to March 29th.
Sundays are usually much lower just because of the day of the week but this is the lowest Sunday since March.
The data and science continues to be screaming the same message to us:
Open back up slowly in most places NOW!.png) , so that's likely part of the reason.
, so that's likely part of the reason.
Monday 3:30 pm
We obviously peaked weeks ago. Even with many more tests than what we did in March, the numbers continue to drop. The last 3 days have featured new case numbers lower than any number during the entire month of April.
The shut ins were successful in flattening the curve. Good job America!
Don't believe CNN and the NYT that are telling us its getting worse because of opening up and that models are drastically increasing deaths and new case numbers..
The science is telling us to open up more!
https://coronavirus.1point3acres.com/en
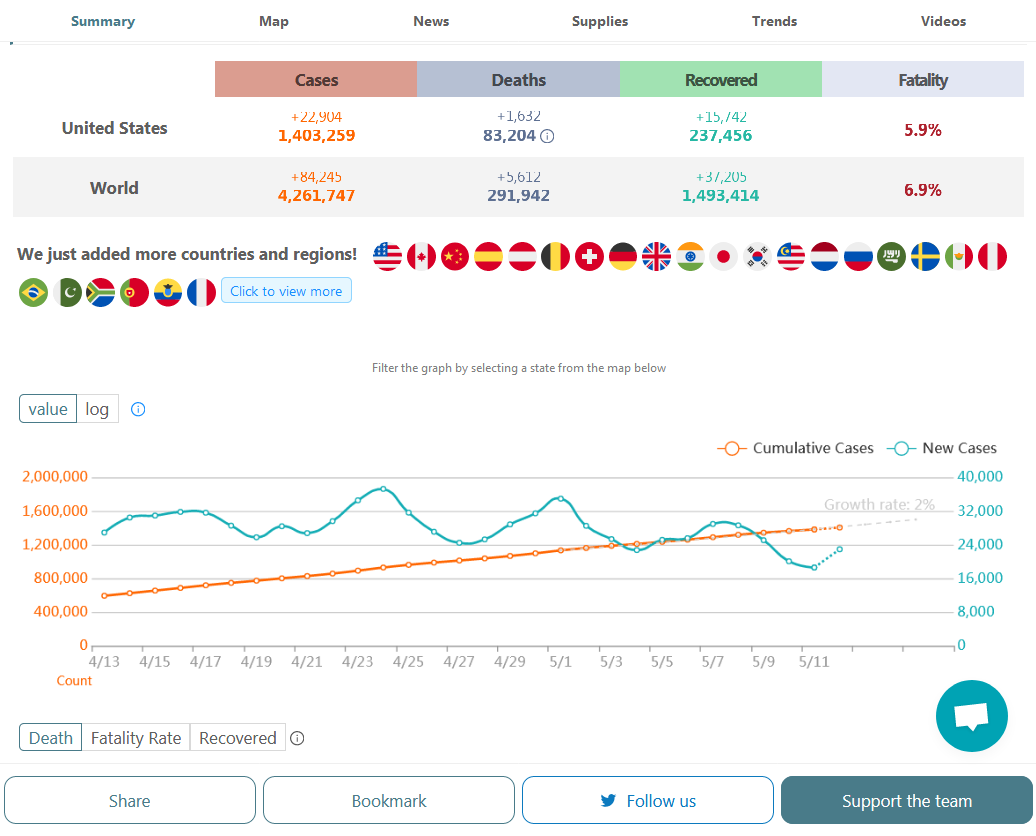
Info For these charts gleaned from https://www.worldometers.info/coronavirus/country/us/
The end date is 5-12.
Current rate 1.2531, 5 day moving average 0.940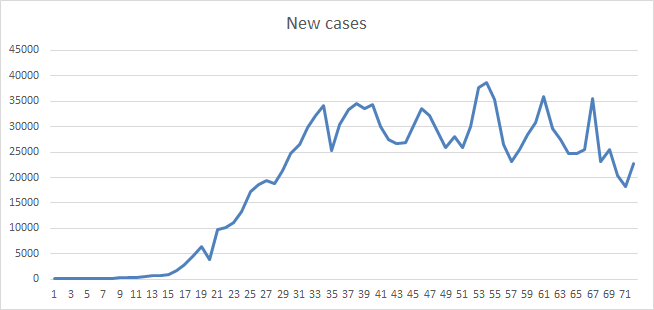
Thanks cutworm.
The last 4 days have reported lower numbers than any in the month of April..............despite CNN and NYT telling us during the last 10 days that rates are going higher because of things going up.
Does that graph below, a plot of the daily increases in new cases, that starts on the left and progresses, with time to the right, look like its going higher to you?
https://coronavirus.1point3acres.com/en
Thursday afternoon. They have started going back much farther on these graphs, to mid March which is MUCH better in giving up a good perspective of where we are.....which is a downtrend.
https://coronavirus.1point3acres.com/en
_SVudAWB.png)
.png)