FWIW I ran the figures for reported deaths in the US. The starting point was where I could find the data. I calculated a weighted average of the rate of increase in new deaths through 4/8 to be 1.14. Using this rate to estimate the number total deaths out to 4/30 gives a total of about 300,000 deaths. This is most likely quite a bit too high, due to the number of new cases probably currently peaking and the lag in deaths vs cases.
I then tried calculating a least squares line though the rate of increase data. This came out with r= -.00813*day+ 1.21055. So decreasing very slightly at this point. Given that there major risks when you extrapolate, using the rates from this formula to calculate the day by day deaths, the number of total deaths by the end of April comes out to be about 88,000. Again given the lag and the number of new cases probably peaking, this is likely still a bit high, but probably closer to what will actually happen.
| day | date | new deaths | rate of increase | total deaths | new deaths | Le Sq rate of increase | total deaths | ||||
| actual | actual | ||||||||||
| 1 | 3/27 | 394 | 1264 | ||||||||
| 2 | 3/28 | 456 | 1.16 | 1720 | |||||||
| 3 | 3/29 | 575 | 1.26 | 2295 | |||||||
| 4 | 3/30 | 830 | 1.44 | 3125 | |||||||
| 5 | 3/31 | 928 | 1.12 | 4053 | |||||||
| 6 | 4/1 | 1049 | 1.13 | 5102 | |||||||
| 7 | 4/2 | 968 | 0.92 | 6070 | |||||||
| 8 | 4/3 | 1051 | 1.09 | 7121 | |||||||
| 9 | 4/4 | 1331 | 1.27 | 8452 | |||||||
| 10 | 4/5 | 1165 | 0.88 | 9616 | |||||||
| 11 | 4/6 | 1255 | 1.08 | 10871 | |||||||
| 12 | 4/7 | 1970 | 1.57 | 12848 | |||||||
| 13 | 4/8 | 1940 | 0.98 | 1.14 | 14788 | ||||||
| projected | ^ weighted avg | projected | projected | projected | |||||||
| 14 | 4/9 | 2,220.84 | 1.14 | 17,008.84 | 2,143.35 | 1.104818616 | 16,931.35 | ||||
| 15 | 4/10 | 2,542.34 | 1.14 | 19,551.17 | 2,350.58 | 1.096685175 | 19,281.93 | ||||
| 16 | 4/11 | 2,910.37 | 1.14 | 22,461.55 | 2,558.73 | 1.088551734 | 21,840.65 | ||||
| 17 | 4/12 | 3,331.68 | 1.14 | 25,793.23 | 2,764.49 | 1.080418293 | 24,605.15 | ||||
| 18 | 4/13 | 3,813.99 | 1.14 | 29,607.22 | 2,964.33 | 1.072284852 | 27,569.47 | ||||
| 19 | 4/14 | 4,366.11 | 1.14 | 33,973.33 | 3,154.49 | 1.064151411 | 30,723.96 | ||||
| 20 | 4/15 | 4,998.16 | 1.14 | 38,971.49 | 3,331.20 | 1.05601797 | 34,055.16 | ||||
| 21 | 4/16 | 5,721.71 | 1.14 | 44,693.20 | 3,490.71 | 1.047884529 | 37,545.87 | ||||
| 22 | 4/17 | 6,550.00 | 1.14 | 51,243.21 | 3,629.47 | 1.039751088 | 41,175.35 | ||||
| 23 | 4/18 | 7,498.20 | 1.14 | 58,741.41 | 3,744.23 | 1.031617647 | 44,919.57 | ||||
| 24 | 4/19 | 8,583.66 | 1.14 | 67,325.07 | 3,832.16 | 1.023484206 | 48,751.73 | ||||
| 25 | 4/20 | 9,826.26 | 1.14 | 77,151.32 | 3,890.98 | 1.015350765 | 52,642.71 | ||||
| 26 | 4/21 | 11,248.73 | 1.14 | 88,400.06 | 3,919.07 | 1.007217324 | 56,561.78 | ||||
| 27 | 4/22 | 12,877.13 | 1.14 | 101,277.19 | 3,915.48 | 0.9990838834 | 60,477.26 | ||||
| 28 | 4/23 | 14,741.26 | 1.14 | 116,018.45 | 3,880.04 | 0.9909504424 | 64,357.30 | ||||
| 29 | 4/24 | 16,875.25 | 1.14 | 132,893.69 | 3,813.37 | 0.9828170014 | 68,170.67 | ||||
| 30 | 4/25 | 19,318.16 | 1.14 | 152,211.85 | 3,716.83 | 0.9746835604 | 71,887.50 | ||||
| 31 | 4/26 | 22,114.71 | 1.14 | 174,326.56 | 3,592.50 | 0.9665501194 | 75,480.00 | ||||
| 32 | 4/27 | 25,316.10 | 1.14 | 199,642.66 | 3,443.12 | 0.9584166784 | 78,923.12 | ||||
| 33 | 4/28 | 28,980.93 | 1.14 | 228,623.58 | 3,271.93 | 0.9502832374 | 82,195.05 | ||||
| 34 | 4/29 | 33,176.29 | 1.14 | 261,799.87 | 3,082.65 | 0.9421497964 | 85,277.71 | ||||
| 35 | 4/30 | 37,978.98 | 1.14 | 299,778.85 | 2,879.25 | 0.9340163554 | 88,156.95 |
Thanks much pj!
Good stuff.
I'm betting there will be only half the 88,000 deaths that your model predicts.
The effects of human behavior with mitigation are impossible to model as indicated by all the recent models drastically cutting all earlier estimates by a great deal.
This will continue.
My last wild guess was 1,200,000 total cases and 30,000 deaths at the end of the month may be low on the deaths by as much as 10,000 and high on the cases by 100,000 but I am using what is most likely to happen using critical thinking.
For instance, it's extremely likely that the rate of new cases will be dropping for the rest of the month. Not every day but most days. It's plausible that the daily rate could be well under 20,000 at the end of the month.
That will take at least a week to show up in big drops in the deaths, which is why I probably need to increase that.
I have also been using the Kinsa health data as a LEADING indicator.
https://www.marketforum.com/forum/topic/49867/
In some ways, it's like weather predicting. We have dozens of weather models that use thousands of mathematical equations based on the physical laws of the atmosphere that do all the work and we could never try to forecast without.
It would take a human their entire life to solve all the equations for just 1 model run!!
However, a good operational meteorologist can look at the model forecasts and recognize when the models are missing things. I note that the local NWS in most locations these days just uses the computer generated model output in their forecast vs trying to beat the models.
In the old days, operational meteorologists worth their oats could often whip the computer models.
The NWS does a wonderful job providing us with their products and service.
The huge difference between weather models and COVID-19 models is that one is based on the well known physical laws of the atmosphere...........the other one is greatly affected by uncertain human behavior, predicting the not so well known science(infections/deaths) of a brand new virus.
The latest empirical data/observations will always count much more in the unknown situation because it immediately closes the gap between known and unknown for that data point...........which might have been pretty wide.
FWIW I updated the least squares fit I did last week. When calculating the daily rates of increase I left out the "probable cases" that were added a few days ago, which would have caused a spike for that day. My feeling, maybe they're learning/getting better at treatments, maybe some of the pressure is coming off the medical facilities will result in rates dropping a little faster than the least squares straight line projects.
| date | new deaths | rate of increase | total deaths | |
| 3/27 | 394 | 1264 | ||
| 3/28 | 456 | 1.157360 | 1720 | |
| 3/29 | 575 | 1.260965 | 2295 | |
| 3/30 | 830 | 1.443478 | 3125 | |
| 3/31 | 928 | 1.118072 | 4053 | |
| 4/1 | 1049 | 1.130388 | 5102 | |
| 4/2 | 968 | 0.922784 | 6070 | |
| 4/3 | 1051 | 1.085744 | 7121 | |
| 4/4 | 1331 | 1.266413 | 8452 | |
| 4/5 | 1165 | 0.875282 | 9616 | |
| 4/6 | 1255 | 1.077253 | 10871 | |
| 4/7 | 1970 | 1.569721 | 12848 | |
| 4/8 | 1940 | 0.984772 | 14791 | |
| 4/9 | 1900 | 0.979381 | 16712 | |
| 4/10 | 2035 | 1.071053 | 18747 | |
| 4/11 | 1830 | 0.899263 | 20577 | |
| 4/12 | 1528 | 0.834973 | 22105 | |
| 4/13 | 1535 | 1.004581 | 23640 | |
| 4/14 | 2407 | 1.568078 | 29825 | |
| 4/15 | 2618 | 1.087661 | 32443 | |
| 4/16 | 2171 | 0.829259 | 34614 |
Projected
| new deaths | LS rate of increase | total deaths | |
| 1.025398 | |||
| 4/17 | 2,229.22 | 1.016669 | 36,846.22 |
| 4/18 | 2,266.37 | 1.007940 | 39,112.59 |
| 4/19 | 2,284.37 | 0.999211 | 41,396.96 |
| 4/20 | 2,282.57 | 0.990482 | 43,679.53 |
| 4/21 | 2,260.84 | 0.981753 | 45,940.37 |
| 4/22 | 2,219.59 | 0.973024 | 48,159.96 |
| 4/23 | 2,159.71 | 0.964295 | 50,319.67 |
| 4/24 | 2,082.60 | 0.955566 | 52,402.27 |
| 4/25 | 1,990.06 | 0.946837 | 54,392.33 |
| 4/26 | 1,884.26 | 0.938108 | 56,276.59 |
| 4/27 | 1,767.64 | 0.929379 | 58,044.23 |
| 4/28 | 1,642.81 | 0.920650 | 59,687.04 |
| 4/29 | 1,512.45 | 0.911921 | 61,199.49 |
| 4/30 | 1,379.24 | 0.903192 | 62,578.73 |
Thanks very much pj. Great stuff!
The last 2 days has featured an increase in new cases again, possibly related to the record cold/dry weather pattern that hit at the end of last week/early this week.
If the weather is actually having an influence and this is seasonal(we don't know that) then our models will be way off.
2nd update
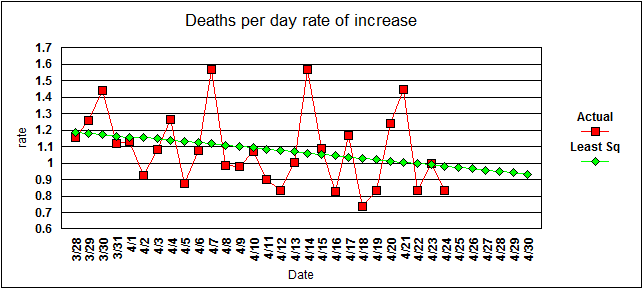
Surprisingly (and no doubt at least partly by coincidence) the projected total deaths by 4/30 remains almost exactly the same as last week's analysis at 62,000+. Below a plot of the data with the least squares line. Note `it's slope is slightly declining and the projected rate is below 1. If this stays on track it means we may well have seen the peak in the (average) number of daily deaths.
| date | new deaths | rate of increase | total deaths | |
| 3/27 | 394 | 1264 | ||
| 3/28 | 456 | 1.157360 | 1720 | |
| 3/29 | 575 | 1.260965 | 2295 | |
| 3/30 | 830 | 1.443478 | 3125 | |
| 3/31 | 928 | 1.118072 | 4053 | |
| 4/1 | 1049 | 1.130388 | 5102 | |
| 4/2 | 968 | 0.922784 | 6070 | |
| 4/3 | 1051 | 1.085744 | 7121 | |
| 4/4 | 1331 | 1.266413 | 8452 | |
| 4/5 | 1165 | 0.875282 | 9616 | |
| 4/6 | 1255 | 1.077253 | 10871 | |
| 4/7 | 1970 | 1.569721 | 12848 | |
| 4/8 | 1940 | 0.984772 | 14791 | |
| 4/9 | 1900 | 0.979381 | 16712 | |
| 4/10 | 2035 | 1.071053 | 18747 | |
| 4/11 | 1830 | 0.899263 | 20577 | |
| 4/12 | 1528 | 0.834973 | 22105 | |
| 4/13 | 1535 | 1.004581 | 23640 | |
| 4/14 | 2407 | 1.568078 | 29825 | |
| 4/15 | 2618 | 1.087661 | 32443 | |
| 4/16 | 2171 | 0.829259 | 34619 | |
| 4/17 | 2535 | 1.167665 | 37154 | |
| 4/18 | 1867 | 0.736489 | 39014 | |
| 4/19 | 1561 | 0.836101 | 40575 | |
| 4/20 | 1939 | 1.242152 | 42514 | |
| 4/21 | 2804 | 1.446106 | 45318 | |
| 4/22 | 2341 | 0.834879 | 47892 | |
| 4/23 | 2342 | 1.000427 | 50234 | |
| 4/24 | 1951 | 0.833049 | 52185 |
Projected
| new deaths | LS rate of increase | total deaths | |
| 0.973020 | |||
| 4/25 | 1,898.36 | 0.965034 | 54,083.36 |
| 4/26 | 1,831.98 | 0.957048 | 55,915.35 |
| 4/27 | 1,753.30 | 0.949061 | 57,668.64 |
| 4/28 | 1,663.99 | 0.941075 | 59,332.63 |
| 4/29 | 1,565.94 | 0.933089 | 60,898.56 |
| 4/30 | 1,461.16 | 0.925103 | 62,359.72 |
Thanks very much pj. More on this later.
Update as of the end of April.
The past two projections for the end of April total deaths of 62,000+ turned out to be quite close to actual total of 63,856.
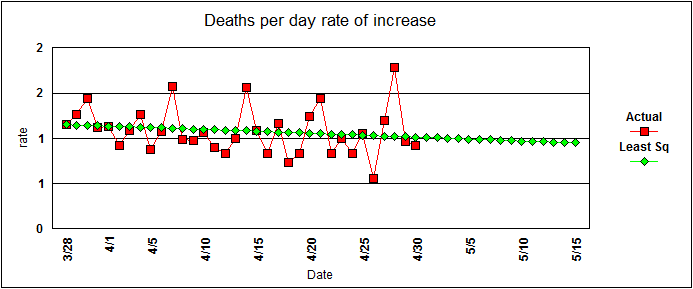
Below is the actual data through 4/30 with projections for May. The slope of the least squares line has flattened (become less negative) a little since the prior weeks' calculations, the projected rate (only) now dropping below 1 in the next few days. Obviously the projections are highly sensitive to whether/when the rate goes below 1.
The actual rate on 4/27, being so high, may have skewed the line a bit and perhaps could be eliminated, as being an outlier. Though it's part of the pattern of larger drops over the weekend being made up for by bigger increases on the following week days. OTOH once you start "playing" with data, you run the risk of the whole exercise becoming arbitrary.
Using the data as is, and extrapolating the least squares line into May, gives expected total deaths of about 92,000 by 5/15 and 106,000 by 5/31. My gut feeling is that these projected totals will turn out to be on the high side.
| date | new deaths | rate of increase | total deaths | |
| 3/27 | 394 | 1264 | ||
| 3/28 | 456 | 1.157360 | 1720 | |
| 3/29 | 575 | 1.260965 | 2295 | |
| 3/30 | 830 | 1.443478 | 3125 | |
| 3/31 | 928 | 1.118072 | 4053 | |
| 4/1 | 1049 | 1.130388 | 5102 | |
| 4/2 | 968 | 0.922784 | 6070 | |
| 4/3 | 1051 | 1.085744 | 7121 | |
| 4/4 | 1331 | 1.266413 | 8452 | |
| 4/5 | 1165 | 0.875282 | 9616 | |
| 4/6 | 1255 | 1.077253 | 10871 | |
| 4/7 | 1970 | 1.569721 | 12848 | |
| 4/8 | 1940 | 0.984772 | 14791 | |
| 4/9 | 1900 | 0.979381 | 16712 | |
| 4/10 | 2035 | 1.071053 | 18747 | |
| 4/11 | 1830 | 0.899263 | 20577 | |
| 4/12 | 1528 | 0.834973 | 22105 | |
| 4/13 | 1535 | 1.004581 | 23640 | |
| 4/14 | 2407 | 1.568078 | 29825 | |
| 4/15 | 2618 | 1.087661 | 32443 | |
| 4/16 | 2171 | 0.829259 | 34619 | |
| 4/17 | 2535 | 1.167665 | 37154 | |
| 4/18 | 1867 | 0.736489 | 39014 | |
| 4/19 | 1561 | 0.836101 | 40575 | |
| 4/20 | 1939 | 1.242152 | 42514 | |
| 4/21 | 2804 | 1.446106 | 45318 | |
| 4/22 | 2341 | 0.834879 | 47892 | |
| 4/23 | 2342 | 1.000427 | 50234 | |
| 4/24 | 1959 | 0.836465 | 52191 | |
| 4/25 | 2065 | 1.054109 | 54256 | |
| 4/26 | 1157 | 0.560291 | 55413 | |
| 4/27 | 1384 | 1.196197 | 56796 | |
| 4/28 | 2470 | 1.784682 | 59265 | |
| 4/29 | 2390 | 0.967611 | 61655 | |
| 4/30 | 2201 | 0.920921 | 63856 |
7-day moving avg 1947
Projected
| new deaths | LS rate of increase | total deaths | |
| 1.014592 | |||
| 5/1 | 1,974.98 | 1.010314 | 65,830.98 |
| 5/2 | 1,995.35 | 1.006036 | 67,826.32 |
| 5/3 | 2,007.39 | 1.001758 | 69,833.71 |
| 5/4 | 2,010.92 | 0.997480 | 71,844.63 |
| 5/5 | 2,005.85 | 0.993203 | 73,850.49 |
| 5/6 | 1,992.22 | 0.988925 | 75,842.71 |
| 5/7 | 1,970.15 | 0.984647 | 77,812.86 |
| 5/8 | 1,939.91 | 0.980369 | 79,752.77 |
| 5/9 | 1,901.82 | 0.976091 | 81,654.59 |
| 5/10 | 1,856.35 | 0.971813 | 83,510.94 |
| 5/11 | 1,804.03 | 0.967535 | 85,314.97 |
| 5/12 | 1,745.46 | 0.963257 | 87,060.43 |
| 5/13 | 1,681.33 | 0.958980 | 88,741.76 |
| 5/14 | 1,612.36 | 0.954702 | 90,354.12 |
| 5/15 | 1,539.32 | 0.950424 | 91,893.44 |
| 5/16 | 1,463.01 | 0.946146 | 93,356.45 |
| 5/17 | 1,384.22 | 0.941868 | 94,740.67 |
| 5/18 | 1,303.75 | 0.937590 | 96,044.42 |
| 5/19 | 1,222.38 | 0.933312 | 97,266.81 |
| 5/20 | 1,140.87 | 0.929034 | 98,407.68 |
| 5/21 | 1,059.90 | 0.924756 | 99,467.58 |
| 5/22 | 980.15 | 0.920479 | 100,447.73 |
| 5/23 | 902.21 | 0.916201 | 101,349.94 |
| 5/24 | 826.61 | 0.911923 | 102,176.55 |
| 5/25 | 753.80 | 0.907645 | 102,930.35 |
| 5/26 | 684.18 | 0.903367 | 103,614.53 |
| 5/27 | 618.07 | 0.899089 | 104,232.60 |
| 5/28 | 555.70 | 0.894811 | 104,788.30 |
| 5/29 | 497.25 | 0.890533 | 105,285.54 |
| 5/30 | 442.81 | 0.886255 | 105,728.36 |
| 5/31 | 392.45 | 0.881978 | 106,120.80 |
Least Squares Rate = -0.004278 *(day) + 1.155762
Thanks again pj.
Yes, your model did an amazing job at projecting deaths at the end of April. Congrats!
I was way too low for guessing deaths but nailed the positive tests/infections....because this has been measuring only a fraction of the REAL infections.
This tells me that there have been many more deaths/positives than I expected(and to take your model seriously) but the reality, now that we are finding out there could have been between 10 and 50 times more cases that never got tested is that the positives are extremely too low for measuring how many cases in the REAL WORLD exist out there.....but catching up, which is making it look like the infection rate is not dropping.
Instead of 1 million measured, there may have been more than 10 million REAL infections.
The more data that we get, the better handle we get on it.
"Yes, your model did an amazing job at projecting deaths at the end of April. Contrats!"
Thanks. Probably a significant amount of luck involved with it coming out that close. More particularly, the rate of the rate of change staying so stable over that period.
Another week another update. The projections continue to track actual deaths pretty well. As of 5/7, 77,813 projected vs 76,928 actual.
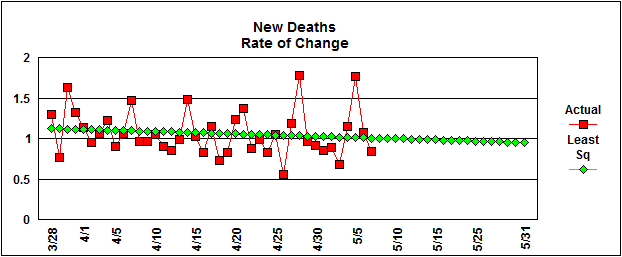
Below the projections though the end of May. The least sq line has flattened a bit again (diminishing at a slower rate), no doubt skewed some by the high values on 4/28 and 5/7. Now still a few days before dropping below 1.
For reasons unknown, I was unable to copy in my table this time around.
Actual
new deaths rate of increase total deaths
5/1 1,897 0.861881 65,753
5/2 1,691 0.891407 67,444
5/3 1,153 0.681845 68,597
5/4 1,324 1.148309 69,921
5/5 2,350 1.774924 72,271
5/6 2,528 1.075745 74,799
5/7 2,129 0.842168 76,928
Projected
new deaths rate of increase total deaths
5/8 1890 1.009142 78818
5/9 1907 1.006159 80725
5/10 1919 1.003176 82645
5/11 1925 1.000194 84570
5/12 1926 0.997211 86495
5/13 1920 0.994228 88415
5/14 1909 0.991245 90325
5/15 1892 0.988262 92217
5/16 1870 0.985279 94087
5/17 1843 0.982296 95930
5/18 1810 0.979313 97740
5/19 1773 0.976330 99512
5/20 1731 0.973347 101243
5/21 1685 0.970364 102928
5/22 1635 0.967381 104562
5/23 1581 0.964398 106143
5/24 1525 0.961415 107668
5/25 1466 0.958432 109135
5/26 1405 0.955449 110540
5/27 1343 0.952466 111882
5/28 1279 0.949484 113161
5/29 1214 0.946501 114375
5/30 1149 0.943518 115524
5/31 1084 0.940535 116609
Least squares rate = -0.002983 x (day) + 1.131443
This is amazing stuff PJ. Thanks!!
please allow me to explain why the "reported" deaths figure probably is fraudulent.
you can find other info on this topic at armstroneconomics.com
since the u.s. govt has supposedly made the proposal to pay hospitals for covid deaths, now all deaths are covid deaths. doctors at hospitals are being told (by administrators) to put down covid, even when people are dying of other causes. and in most cases, definitive testing has NOT been done to determine cause of death. but it is still listed as a covid death anyway.
if a person dies of heart disease, then the hospital has to fight to get payment from the family of the deceased. but if they put down covid, then they expect to automatically get paid by uncle sam.
one funeral home in new york said that recently ALL death certificates say covid as cause of death. NO one is dying of heart disease, or cancer, or flu, or any other cause.
ask yourself... what are the odds ?
so you will probably get a more accurate covid death rate in a place like iceland, where there is NO motivation for hospitals to commit fraud to boost their revenue.
in iceland where they did a large scale test,... 50% of the population had covid, but most had No symptoms. 4% of the population showed symptoms, far less than one tenth of one percent died of covid. (no worse than the flu).
the point here... in the u.s., we dont know if the figures are overstated by 50%, or 100%, or 200%, etc. NO ONE is doing an honest assessment of how many of those death are actually covid (as compared to a flu death, or a heart attack death, etc).
my econ professor always told us... figures don't lie, but liers figure.
remember, here in the u.s., politicians get their death figures from the health dept. health depts get their figures from hospitals. and hospitals have a motivation to Lie about cause of death. $$$$ follow the money $$$$.
6/1 update.
The projection made on 5/1 (above) for the total deaths in the US by the end of May, again fortuitously, was very close to the actual number. Projected 106,121, actual 106,195.
Proving that being that close was in part luck, was the update done a week later which projected 116,109. I believe that one was thrown off by weekend drop off and subsequent bounce way up, with the methodology, using squares of the data, accentuating the phenomenon.
Again FWIW at this point, using all the data and the same method, the projections for June are 118,900 by 6/15, 126,100 by 6/30.
pj,
Congrats again. Your estimates have been better than any model from any source that I've seen this year.........hands down. You say that luck is party responsible. Maybe so but luck runs out, skill continues.
You will note that I stopped trying to make predictions a long time ago............I'll stick to making predictions in a field of expertise that I actually have some skill at...........weather and climate!
Too bad that you aren't an atmospheric/climate scientist (-: .............actually, anytime you want to take a crack at predicting global temperatures for the next 100 years, I'll take it seriously!
Before my kids play in chess tournaments, I will sometimes tell them, "don't have good luck, use skill to win"
Thanks again for your kind words. Wish I could come close to predicting futures prices.
But if you had that great talent in predicting futures prices and were making millions of dollars, you wouldn't be associating with us here (-:
You might even vote for Donald Trump
6/16 update, if anyone still cares. Turned out the 6/1 projections for 6/15 came quite close again. 118,900 projected vs 118,283 actual.
The least squares analysis now projects 129,400 total US deaths by 6/30 and 138,100 by 7/15.
We definitely care pj, this is a wonderful contribution and thanks!
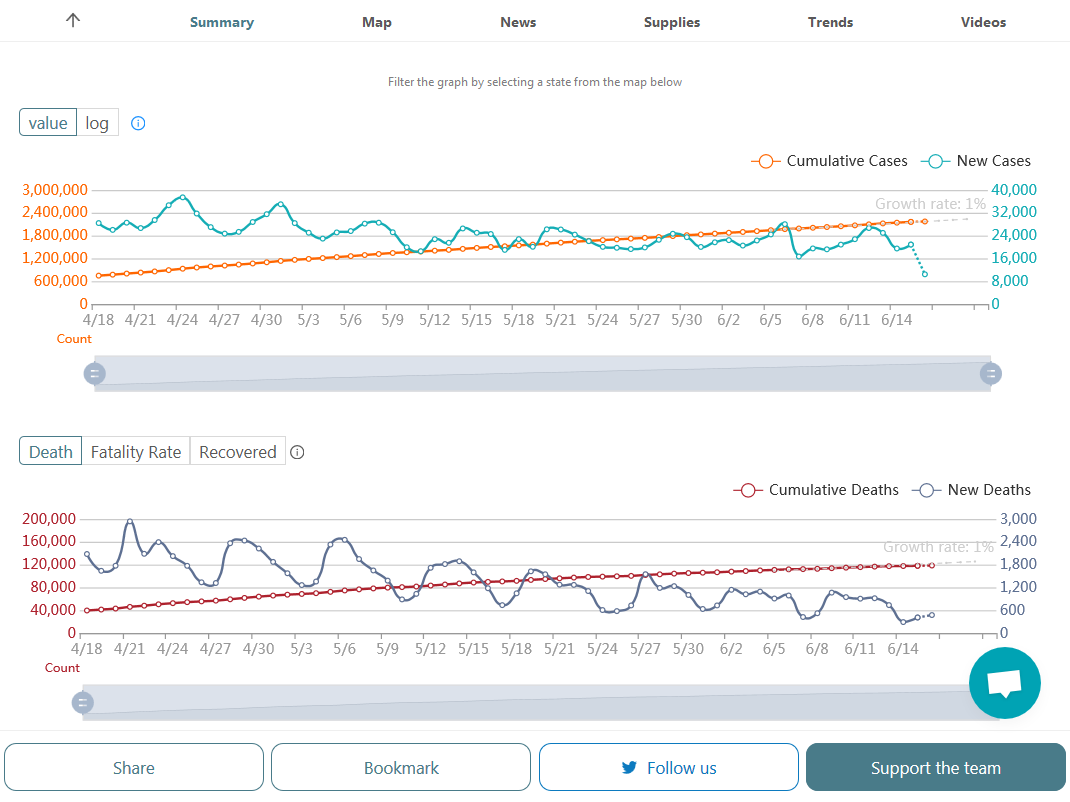
On the top graph below, you can see the new cases plotted. They have leveled off. The graph below that are the deaths, they are less than half what they were in April. Why are deaths going much lower but not new cases?
The additional testing........more than double. It might be close to quadruple by now compared to the the start of the graph in April.
Many people that had it before that were not severe did not get tested. Many of them now are.
People that died from it before.......were mostly tested. So are people dying from it now. That metric is not going be affected much.
The zig zag blue line on the top map are the new daily cases, orange line is cumulative infections.
The purple zig zag line on the bottom graph are the new daily deaths, red line is cumulative deaths.
https://coronavirus.1point3acres.com/en
If my seat of the pants numbers are correct on your prediction, there will be 11,117 new deaths during the rest of the month and that averages to 690 deaths/day.
Then, during the first half of July, down to 8,700 new deaths and the average dropping to 580 deaths/day.
So an assumption of a continuation in the trend downward in deaths.
That seems very reasonable to me but I'm out of the business of predicting the coronavirus and will leave that up to experts like you (-:
But seriously, your track record continues to out perform any source that I've seen. It would appear that the death numbers are becoming more predictable now, so maybe other models can match you!
It will be interesting to see how all the different factors affect this. Widespread opening, mask wearing, hand washing, social distancing in some places, social packing like sardines in others(protests).
Seasonality and there appearing to be the likelyhood that the virus can't survive long outside(lack of spike higher in big protest cities).
A tricky thing on that is that its mostly young people going to these protests. In fact, I went to one over a week ago and there were only 2 other black guys that were older than me out of, maybe 400? people.
95%+ were at least a generation younger than me. Our community has a very low infection rate but in the urban areas, no doubt the same age group would be protesting.
So do we have to wait longer for them to get COVID, then pass it on to somebody older? Probably not with the increase in the testing. Many of the protesters came from out of town in the big urban settings, so just using the stats from that county might not be helpful.
Thanks PJ nice work!!!
Thanks cutworm.
update as of 7/1
The actual number of total deaths by 6/30 came in at 130,122 vs my projection of 129,400.
The slope of the least squares line has now flattened, so there’s only a very small decrease in the projected daily rate of new deaths as time goes by.
Also for whatever reasons, the daily number of deaths are bouncing around more than before, making the rates do the same. This particularly true when there’s a low figure followed by high. Due to the nature of the beast a low death number like the 281 on 6/21, which causes a low rate of increase number 0.46 does not completely offset the 2.36 figure when deaths bounced back to 871 on 6/23. Maybe I should leave well enough alone, but decided to use the 7 day moving averages of the deaths to calculate the rates for the least squares analysis to help smooth things out.
Using the revised methodology the projections are 137,500 deaths by 7/15 and 143,300 by 7/31. With cases and hospitalizations currently rising and there seeming to be fairly consistent upward revisions in the death figures, these could turn out to be on the low side.
Your track record continues to be impeccable pj.
Sure you don't want to quit while you're ahead?.......
Just kidding please keep these updates/positive contributions coming!
The most interesting thing to me now is the number of new cases going thru the roof and deaths(which should lag by around 2 weeks) not following..........YET!
The next 2 weeks could tell a different story though and hopefully, your numbers will be close...meaning that deaths don't follow the same path as new cases.
The problem is that people who are rational and people science need to take a stand and need to point out the inherent contradiction and lunacy of modern conservatism especially trumpism.
All of us can agree that you cannot keep the economy shut down forever. That's a fact which all people liberals moderates conservatives agree with.
But if that is your point of PREMISE . surviving the Virus AND keeping the economy functional in some Capacity is the Goal... WHY would you or me or any political leader or group take be AGAINST facemasks?
It's the ultimate form of stupidity. The argument ensures maximum economic destruction and max impact from the virus .
And more importantly as a voter why would anybody think that somebody advocating that strategy for the past 4 months which is essentially been the entire conservative strategy…. why should I support and re-elect any people group or organization that engages in such irrational destructive thinking?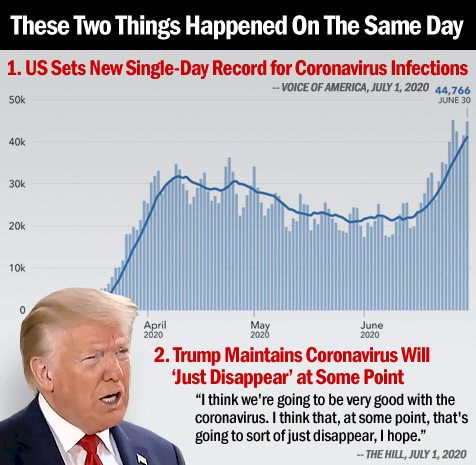
Thanks Dave,
I agree that Trumps position, not pushing for wearing masks(and his rally) have been extremely counterproductive and anti science.
Some of us consider many, many things regarding the Trump agenda for America, not just his loser position on wearing masks....though that one is very important.
Like his support for white supremacy Mike?
https://twitter.com/realDonaldTrump/status/1270787975719391233?s=20
It has been suggested that we should rename as many as 10 of our Legendary Military Bases, such as Fort Bragg in North Carolina, Fort Hood in Texas, Fort Benning in Georgia, etc. These Monumental and very Powerful Bases have become part of a Great American Heritage, and a..history of Winning, Victory, and Freedom. The United States of America trained and deployed our HEROES on these Hallowed Grounds, and won two World Wars. Therefore, my Administration will not even consider the renaming of these Magnificent and Fabled Military Installations...
General Bragg of the CSA fought for freedom? Benning?
There is nothing Honorable about treason. There is nothing honorable about the Confederacy and what they did and what they stood for. They aren't US veterans ...they aren't US soldiers they' were/ are traitors.
" Like his support for white supremacy Mike?"
If there was LEGIT evidence of that, I would never support him.
I have strongly supported civil rights for decades, helped children at 5 inner city schools locally that have the most blacks, have a huge, wonderful extended African American family(my son in law and grandkids are black) and grew up in Detroit, just a few miles from the July 1967 race riots.
And you can tell from my posts that I take this topic serious as a heart attack.
I have yet to find any legit evidence that he SUPPORTS white supremacy Dave.
White Supremacists definitely support him as they are a far right group.
Most anti Trumpers that believe this get it from the twisting of statements of his like "There were very fine people on both sides" while at the same time condemning the white supremacists and other racist groups.............but the MSM conveniently always leaves out that last part...........every single time.
Why is it they won't repeat him condemning white supremacy and racism, do you think Dave?
Because they want YOU to think that he supports it or is one.
You are exactly wrong on this Dave. Here is the evidence of him condemning this numerous times...
https://www.factcheck.org/2020/02/trump-has-condemned-white-supremacists/
Do you have any legit evidence that he supports White Supremacists other than opinions. Please use facts or statements of his.
7/16 update
As could have been expected, given the recent upturn in daily deaths, the projection for the number of deaths by 7/15, which was based on a least squares straight line for the rate of new deaths, that had been dropping more or less steadily since the end of March, turned out to be to low, 137,500 projected vs 140,183 actual.
Yesterday 7/15, the number of deaths was over 1000 for the first time since 6/9.
Given that the "curve" has now distinctly bent back up, I'm trying to decide whether trying to make projections based on the prior data, makes any sense.
I am sorry but how do you make projections using faulty data. So much of what is released is not accurate, seems more every day. Now we find out if a guy is tested 15 times positive that is 15 separate covid cases....I don't think is a very wise piece of data.
mcfarm:
I've been using (daily) deaths not cases. Don't think anyone can die more than once... ;-)
guess I have a question about deaths and faulty data also...many have died from say cancer they have for years, a car wreck, falling down the stairs, and yet the hospitals turn them in as covid deaths...again junk data
mcfarm,
You were on a forum vacation for several months, so we understand that maybe you have not been properly introduced to our MarketForum COVID prediction guru (-:
Seriously, if you have a few minutes, scroll thru all the posts in this thread to catch up on pj's work/death projections. You will be very impressed.
That's one of the cool things here, we have a record of posts going back over 2 years that can be retrieved for useful purposes or to document things that were stated previously.
This particular thread featuring pj's projections makes it nice and easy for you.
I am very impressed and I look at COVID data at least a few times a day.
In March, I thought I could use data to project COVID outcomes but UNDER predicted by such a wide margin on the deaths(and wild guessing at best) told me to stick with meteorology.
I'll leave the coronavirus death projections to pj.
I'm dead serious on this one too. pj's projections have been nothing short of stupendous and better than any I've seen anywhere.
When the death rates leveled off in May, it became easier for the mere mortals to project COVID deaths but it was before then in early April when nobody else had a clue yet, when pj came out from the get go by nailing his first projection.
mm: Thanks as always for your kind words. But have to say I still believe that my earlier projections coming as close as they did, was in all probability more luck than brains. That is, that the rate of decrease of deaths stayed as stable as it did for as long as it did. There easily could have been an earlier blip, like we're having now, that could have thrown them off considerably. Plus using least squares is really pretty simplistic/doesn't take much of a "guru". I'm certain real gurus are using much more sophisticated models.
Can't help saying, and we'll never know for sure, but if the country had opened at a slower pace, there had been fewer protests and rallies and people had adhered to using masks and social distancing, maybe we'd still be more or less on the same slope with the rate of deaths still decreasing and making projections, using the method, still look good.
I strongly agree with that assessment pj.
Those are all factors that we could have done a much better job with.
so PJ are you saying you are comfortable with more of the economy being opened and the mayors and govs trying to shut things back down are off base?
mcfarm: "so PJ are you saying you are comfortable with more of the economy being opened and the mayors and govs trying to shut things back down are off base?"
At this point, no, the opposite.
PJ what about kids going back to school?
Since kids seem least affected, I could see them going back to class in areas where the virus appears under control, with safeguards, monitoring and sufficient testing of teachers and staff, to try to prevent the kids from carrying it home to family and elders.
I agree with pj on the school but us elders need to do our part to be safe, not just the school kids. Grandparents need to do their part. Families need to figure this out on a family by family basis. JMHO
EDIT I guess what I'm saying in part is that us old codgers need to look out somewhat for ourselves, not just put it on the younger ones.
Yup, masks, distancing, staying out of crowded places, keeping hands away from face and eyes and hand-washing, though that (maybe) seems to have dropped down in priority recently.
Also, exercise and keeping occupied to avoid going bat$$ht.
"Plus using least squares is really pretty simplistic/doesn't take much of a "guru". I'm certain real gurus are using much more sophisticated models."
Yes, they are using very sophisticated models with all sorts of variables and assumptions and equations.
Modeling is tremendously useful in almost all fields of science and engineering. This is especially so when you have a ton of KNOWN variables and rock solid assumptions and the physics or science or whatever can be represented accurately with calculus(math equations) .
But in fields/areas that have some uncertainties about variables/parameters, the value plunges as the spread in initial, potential initial assumptions grows.
With COVID, we started with incredible uncertainties.
How contagious is this new virus?
How long does a person remain contagious?
How deadly?
How widespread is it already?
What will be the affect of shutting down?
How will people actually behave?
At the start, you could plug in different numbers that would end up with projections a couple orders of magnitude different. And make a case for the extremes to be possible because of the uncertainties.
In situations like that, I think your more simplistic approach and using what makes common sense based on eye balling the data and seeing a pattern while using an understanding of the the dynamic is pretty good........like what you did.
I can't resist bringing up weather/climate models.
Weather models will always fail with time because errors grow exponentially as the forecast period increases. You can see it with a ensemble solutions for a particular model. At day 3, you usually can't tell a difference between any of the 2 dozen individual solutions. Depending on the pattern, at day 5, you may start to see some differences that diverge quickly with time. By day 10, some solutions will have the complete opposite of others........but in some situations they all line up close enough to give the meteorologist confidence that far out. Day 14 still provides some useful skill in predicting the large scale features(general trends) in that time frame but is totally useless in trying to time out features in the pattern that lead to day to day fluctuations.
We always start each model run with over a million observations/measurements............but there are still places not measured, that get interpolated inaccurately that cause a potential error.....that might grow with time.
We run the data thru a super computer that solves a million mathematical equations(that represent the physics of the atmosphere/oceans/land/sun) ...........EACH SECOND!
It is impossible to accurately represent every relationship in those equations. The topography in the mountains, for instance will cause some funky things to happen that the models will struggle with. Any error or deviation can grow massively with time and sometimes make individual solutions look totally different in just 10 days.
Climate models also use math to represent the known physics of the world and measured data with thousands of variables and assumptions. They don't try to predict daily variations in the atmosphere but instead, determine how overall forcings..........like the sun, and an increase in CO2 affect how much energy goes in and comes out.
Since we can't represent any natural cycles, they are not in there. Warming from natural cycles the past 100 years, for instance would mostly be assumed to be from greenhouse gases increasing.
The time scale difference between weather and climate models causes an accountability problem that can be seen with one of them.
With weather models and 2 weeks forecasts, the predictions are scrutinized, day by day and compared with what actually happens. There is no hiding a bust.
With climate models projecting out the next 100 years, there is NO ACCOUNTABILITY. NONE. If that were not so, climate models would not continue to all be too warm and NOT be adjusted less warm..........down to the what has actually been measured/observations.
The climate scientists/modeler will be dead by the time their 2020 climate forecast is held accountable..........so they stick with the same(too warm) ones and everybody assumes they are right and the atmosphere just has some catching up to do in the decades ahead.
In weather forecasting, if you predicted rain on day 5, people would consider your forecast to be a bust if it was sunny on day 5.
You could tell them the rains had moved to day 6. That could happen of course and people would buy it and your forecast would be salvaged.....if it rained on day 6.
However, if it's sunny on day 6 too and you move the rains to day 7, then 8, then 9, then 10 and this goes on indefinitely with no rain, the forecasters credibility is shot.
Not so in climate science. All the disasters that were predicted in the late 1980's for the year 2000+ never happened. They just got shifted forward. Every 10 years, the same disasters that never happen get shifted forward by 10 years.
PETER JAMES SPIELMANN June 29, 1989
https://apnews.com/bd45c372caf118ec99964ea547880cd0
It's 2020 and using that same marketing strategy(keep moving the goal posts forward in time) the climate apocolypse we NOW expect will happen in 2030.
I am confident that the planet will continue to green up between now and then. The actual global temperature increase will be around .14 deg. C(just over a tenth of a degree) higher. The oceans will be just over 1 inch higher then.
Most life will be doing even better than it is today and world food production will continue higher from the beneficial weather and increase in CO2 caused by the climate optimum.
Thank goodness most of the COVID models seem to be grounded in authentic data using objective science.
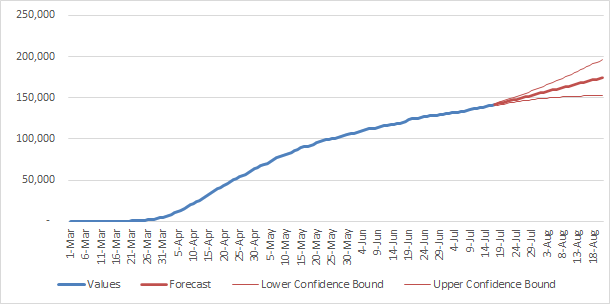
Info for the following charts was gleaned from https://www.worldometers.info/coronavirus/country/us/
This is total deaths.
The first chart was from data to 6-18 -2020
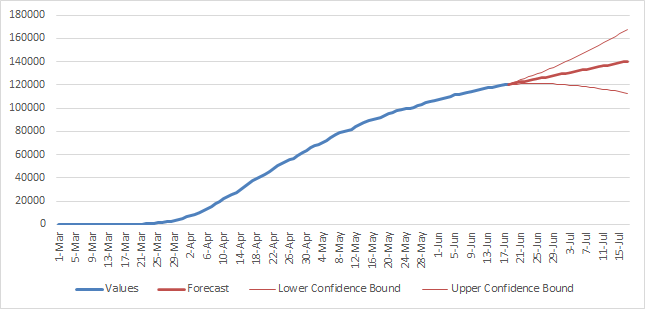
The end point for the forecast is 7-17-2020 Forecast 140,442 lower bound 112898 upper bound 167,986
7-17 total 142,064
The next chart is using data to 1-17-2020 forecast 8-21-2020
Forecast 174,576 lower bound 152,694 upper bound 196,458
PJ, what about herd immunity? I am a big believer in it. By the way I also feel there are ways to open schools. We have to get them open. Have to. When its all said and done this virus has to get thru the herd. I am really starting to see had we protected the old and the sick and done something like send the sick to nursing homes we get this thru the herd. The young are not vulnerable as science has proven so what are we waiting for unless its true iis all political now....as many are coming to realize.
Thanks cutworm!