Coffee used to rally in May, dialing in risk premium for a potential frost/freeze but the last severe one(s) were in 1994 because they moved the coffee plantations farther north, closer to the equator after devastating freezes in the previous decades in far Southern Brazil.
Global warming has helped out a bit too.
This is where they grow coffee in Brazil.....the worlds biggest producer.
The higher the number below, the greater the production. 1=highest.
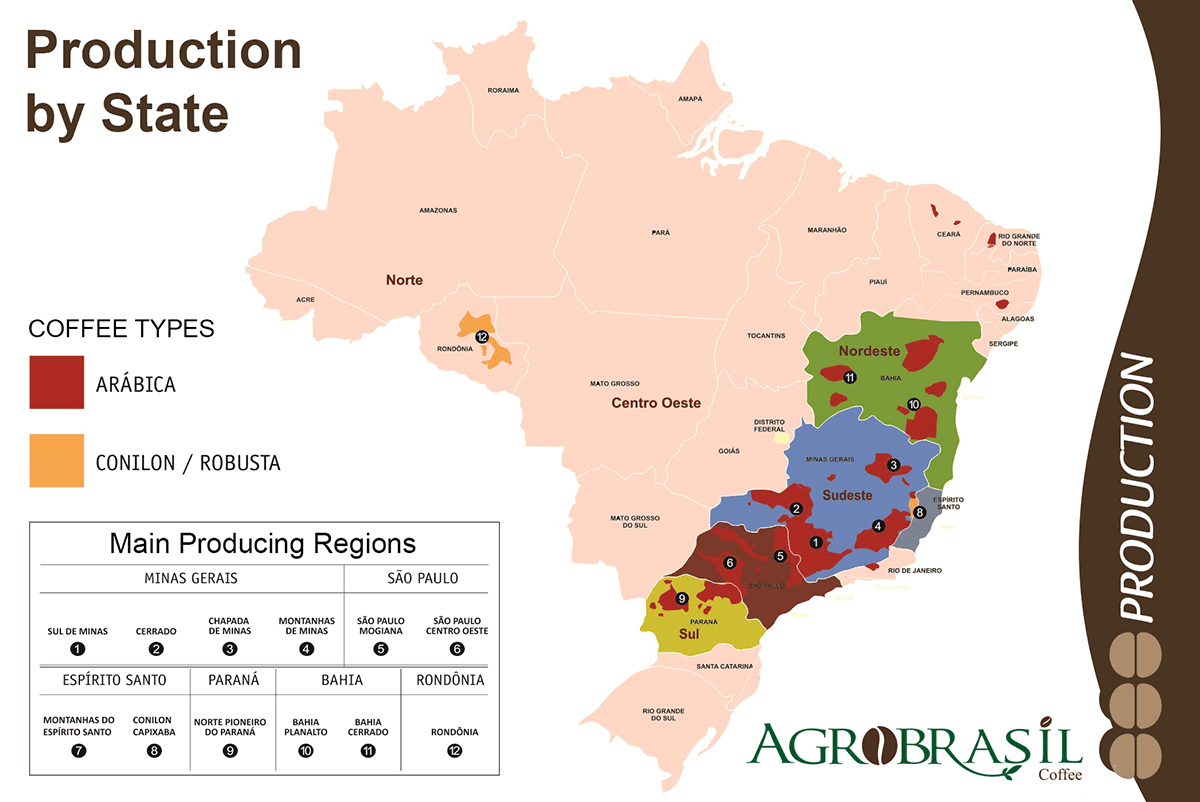
map of coffee production in brazil agrob
History of frosts/freezes and droughts in Brazil thru 2000.
http://www.coffeeresearch.org/market/frost.htm
http://www.coffeeresearch.org/market/frosthistory.htm
| Date | Severity (Damage) | Coffee Frost or Drought |
| 1902 (Late July/early August) | Devastating | F* |
| 1918 (June 24-26) | Severe | F* |
| 1942 (Late June/early July) | Severe | F* |
| 1943 | Moderate | F* |
| 1953 (July 4-5) | Severe | F* |
| 1955 (July 30-August 1) | Severe | slight F |
| 1957 | Severe | F* |
| 1962 (July 25-26) | Minor | F* |
| 1963 (August 5-6) | Moderate | F and D |
| 1965 | Minor | F* |
| 1966 (August 6) | Severe | slight F |
| 1967 (June 8) | Minor | F* |
| 1969 (July 9-10) | Moderate | F* |
| 1972 (July 8-9) | Moderate | F* |
| 1975 (July 17-19) | Very Severe | F* |
| 1978 (August 13-16) | Moderate | F* |
| 1979 (June 1) | Moderate | F* |
| 1981 (July 20-22) | Severe | F* |
| 1984 (August 25) | Minor | F* |
| 1985 (August-November) | Minor | D |
| 1988 | Minor | F* |
| 1994 (June 25-26 and July 9-10) | Severe/Very Severe | F and D |
| 1999 (August to November) | Severe (40% crop lost) | D |
| 2000 (July 17) | Moderate (est) | F* |
* In most cases frost or drought was not indicated by the source. Although only F is written in these cases it is likely a combination of the two forces that caused a devastating coffee crop.
A cold wave is coming thru the next 2 days but should not be cold enough to threaten the coffee. The coffee growing region is in the far, top right of the screen just northeast of where the blues are.
https://www.esrl.noaa.gov/psd/map/images/ens/t850anom_f048_shbg.gif
MIke,
Thanks for posting the map of growing areas. If ever areas 1 & 2 were to be threatened with widespread frost again (you'd think at some point it will happen just due to variability even with global warming), look out! Of course, it may be many more years before that happens. But it will almost certainly happen again as those areas have been hard hit in some previous bad freezes. Areas 5 & 6 are probably more at risk since further SW but they are obviously not as concentrated with coffee. Still, significant damage in those areas would likely lead to price increases. Area 9 in Parana is the most vulnerable and has been hit a number of times even since 2000, but it is only a small portion.
Edit: I know Mike realizes these things. So, my comments are more directed at other readers.
Thanks, Mike, for posting the chart of past frosts and droughts. I clearly remember the moderate frosts of July of 2000. Yourself, Susannah, Office Boy, Cofco, Nagual, myself, and others were closely following this back in the INO days. This was around when I first joined. Do you recall us following it on INO? By the way, where is Susannah?
Larry,
I started in around 2001 I think. Currently, we have less than 100 people registered and none of the old names that you mentioned.
However, I remember all of them and am going to invite them back (the ones that I can) after we provide user friendly access to our NTR forum.
Am thinking that our discussions right now on the Trading Forum are headed down the right path to attract these people back(and others).............they just don't know that we are here.
There are hundreds of other places to go, so we need to keep putting out the unique, trading useful stuff that you are helping hugely to provide.
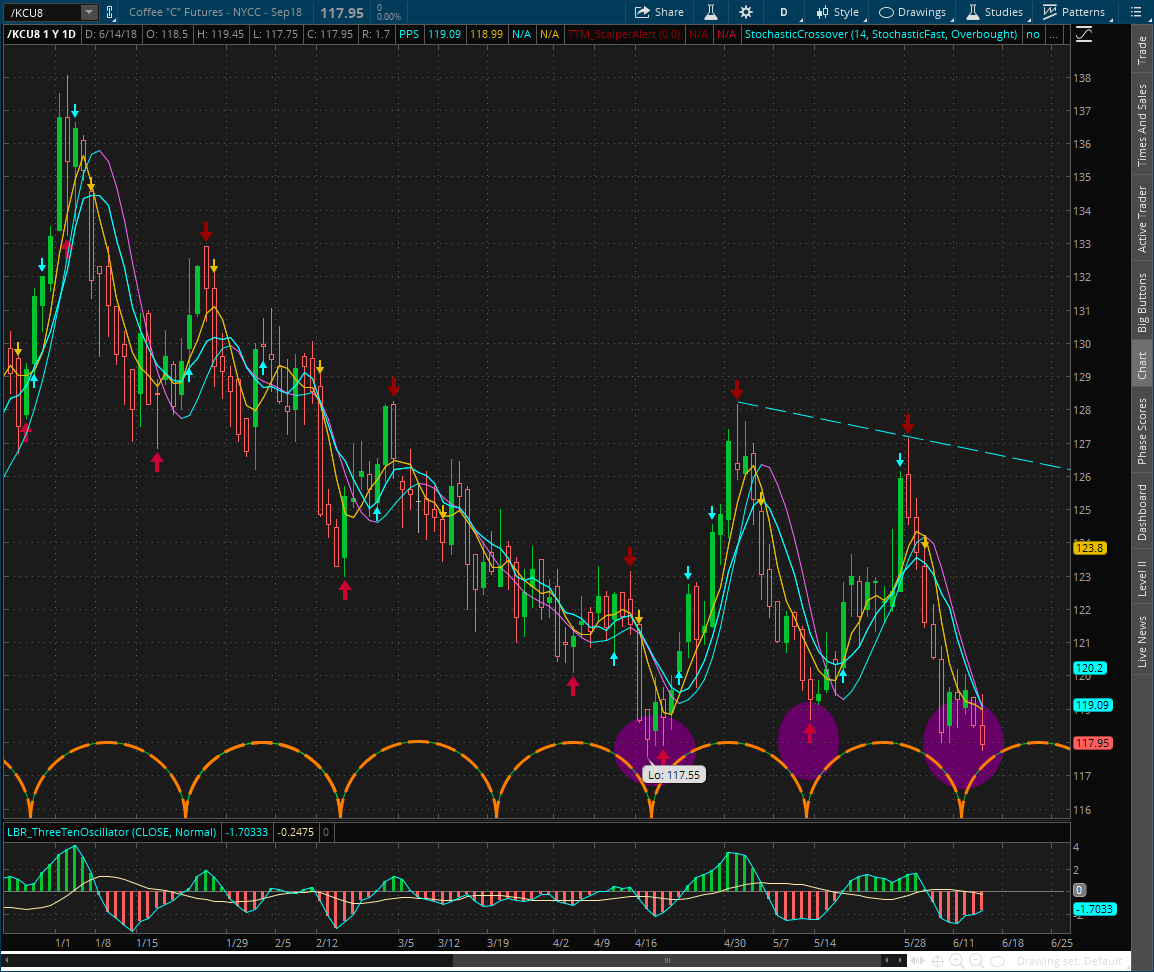
Coffee the last month with candle stick bars

Coffee charts going back 10 years:
The last 7 days:
| |
| |
| |
Drought in Brazil in 2014 caused a spike
Drought in Brazil and bad weather globally in 2010 caused the 2011 spike
| |
You will note(ok, maybe a small fraction familiar with the geography) some pretty cold temp anomolies crossing Argentina into S.Brazil later this week(the blue shades in the top right corner of the map). The center of the map is the South Pole.
However, the cold air mass does not have nearly enough punch northward(towards the equator) to provide a serious threat to coffee-land.
This is why coffee prices have not responded much.
.
Still no cold threat to coffee land this morning!
Triple bottom cute cycle, is this it? September daily. And the final low is a tiny double bottom within itself.