1 day until the New Decade! Keep giving thanks to be living in the best time of human history.......every day of the year!
Scroll down and enjoy the latest comprehensive weather to the max...... occurring because of the natural physical laws in our atmosphere as life on this greening planet continues to enjoy the best weather/climate in at least 1,000 years(the last time that it was this warm) with the added bonus of extra beneficial CO2.
Models overnight were a bit milder.......again. Arctic cold is coming with the most likely entry point pretty far west and also just south of the US border, farther east. Question is how far southeast it will penetrate and how long will it last? The last 2 days has it weaker and weaker.
Merry Christmas present to humanity: https://www.marketforum.com/forum/topic/44802/
Winter Weather Forecasts
Snow in the Great Lakes.
https://www.wpc.ncep.noaa.gov/wwd/winter_wx.shtml
Snowfall the next 7 days below.
Here are the latest hazards across the country.
 |
Purple/Pink/blue on land is cold/Winter weather. Brown is wind, Green is flooding. Gray is fog. Reddish is a red flag advisory.
Go to the link below, then hit the location/county on the map for details.
https://www.spc.noaa.gov/ Go to "hazards"
https://www.mesonet.org/index.php/weather/map/us_air_temperature/air_temperature

https://www.mesonet.org/index.php/weather/map/wind_chill_heat_index1/air_temperature

Current Weather Map
| NCEP Days 0-7 Forecast Loop | NCEP Short-Range Model Discussion | NCEP Day 3-7 Discussion |


Current Jet Stream

| Low Temperatures Tomorrow Morning |

Highs today and tomorrow.


Highs for days 3-7:
The recent well above average temps......cool to just above average temps, then even a bit below briefly!


Temperatures vs average for days 3-7.
Cooling from the recent much above to above to close to average and even a couple of days just below average.
https://www.wpc.ncep.noaa.gov/medr/medr_mean.shtml


Surface Weather features day 3-7:
Turning colder. Several cold fronts.
Moderate development along the fronts in the colder air will make some snow in the Great Lakes.

Liquid equivalent precip forecasts for the next 7 days are below.
South has the most precip. In the colder air farther north(Great Lakes area), some moderate snows.
Day 1 below:
http://www.wpc.ncep.noaa.gov/qpf/fill_94qwbg.gif?1526306199054

Day 2 below:
http://www.wpc.ncep.noaa.gov/qpf/fill_98qwbg.gif?1528293750112

Day 3 below
http://www.wpc.ncep.noaa.gov/qpf/fill_99qwbg.gif?1528293842764

Days 4-5 below:
http://www.wpc.ncep.noaa.gov/qpf/95ep48iwbg_fill.gif?1526306162

Days 6-7 below:
http://www.wpc.ncep.noaa.gov/qpf/97ep48iwbg_fill.gif?1526306162

7 Day Total precipitation below:
https://www.wpc.ncep.noaa.gov/qpf/p168i.gif?1566925971

Last 24 hour precip top map
Last 7 day precip below that
Current Dew Points

Latest radar loop
http://www.nws.noaa.gov/radar_tab.php


| (3400x1700 pixels - 2.2mb) Go to: Most Recent Image |

Go to: Most Recent Image
You can go to this link to see precipitation totals from recent time periods:
https://water.weather.gov/precip/
Go to precipitation, then scroll down to pick a time frame. Hit states to get the borders to see locations better. Under products, you can hit "observed" or "Percent of normal"
Soilmoisture anomaly:
These maps sometimes take a day to catch up to incorporate the latest data(the bottom map is only updated once a week).
https://www.cpc.ncep.noaa.gov/products/Soilmst_Monitoring/US/Soilmst/Soilmst.shtml#
![]()


Drought Monitor maps:
Latest: The first map below is the latest. The 2nd one is from last week.
In july/August/Sept/Oct, it's typical to see some increase in drought because of evaporation, seasonally exceeding low rainfall during those months. However, this year saw a HUGE increase in the Southeast!
December 26: DROUGHT the last 2 months has really shrunk. It's GONE in the Southeast! Wow! One area to watch is sw Kansas and S.Plains for the Winter wheat crop but it's going dormant right now.
The maps below are updated on Thursdays.
https://droughtmonitor.unl.edu/


The top map is the Canadian ensemble average, the maps below are the individual members that make up the average at the end of week 2.
+++++++++++++++++++++++++++++++++++++++++
Each member is like the parent, Canadian model operational model.......with a slight tweek/variation in parameters. Since we know the equations to represent the physics of the atmosphere in the models are not perfect, its useful to vary some of the equations that are uncertain(can make a difference) to see if it effects the outcome and how.
The average of all these variations(ensembles) often yields a better tool for forecasting. It's always more consistent. The individual operational model, like each individual ensemble member can vary greatly from run to run.........and represent an extreme end of the spectrum at times. The ensemble average of all the members, because it averages the extremes.............from opposite ends of the spectrum.........changes much less from run to run.
End of week 2....................0z Canadian ensembles:
Updated 12z maps available this late...........turning colder late week 2 vs previous solutions. Potential for another polar vortex incursion south...on some solutions, mainly this particular model!
Starting with last week below:
Last Wednesday: Still cross polar flow into Alaska(which will be frigid) and Canada. How much of that will make it south with the fairly zonal, mild flow in the US(but with weak troughing)? It will be very difficult to keep a massive very cold air mass in Canada from tracking south of the US border, despite what the models think right now. The question for me is more of a, how much of that cold spurts south and where?
Thursday: Slightly deeper trough in the Rockies, where the best chance for cold to get in from a bitter cold Canada appears to be.
Friday: Deeper trough again Rockies and vicinity(where the cold air is likely to go) enough that we have some modest ridging and warmer temps downstream.........especially Southeast but affecting the East possibly the Midwest. Very wet pattern, likely heavy snow in the cold air.
Saturday: Similar to yesterday. With the upper level ridge Alaska to far eastern Pacific and downstream upper level trough and the amount of frigid air in Canada from cross polar flow, its hard to imagine that alot of that will not penetrate deeply into the US, especially in the West to the Plains and the northern tier farther east. Question is just how far southeast the cold will go. Low level cold air is very dense and often able to undercut the upper level flow...........going farther southeast than the steering currents would imply.
Sunday: Deeper trough West to Rockies to Plains. Ridge Southeast. Very wet with huge snows in the cold air..........some of the air will be frigid and gets farther southeast than forecasts 2 days ago. Huge temp contrast from cold which spreads in and warmth in the Southeast.
Monday: Similar to yesterday but slightly more amplified. Stronger ridge Northeast Pacific, Deeper trough and slightly farther west in the West to Rockies to Plains. Slightly stronger upper level ridge in the Southeast. Arctic air in Canada will come south, favoring the West and northern border states but the stout ridge in the Southeast will provide resistance to the cold and warmth in that region. How far southeast will the frigid air get and how long will it last? Other models have just a brief shot of cold today for the high population centers, especially in the East and Southeast(not much).
Tuesday: Same forecast philosophy as Monday and same amplified pattern but not quite as amplified as yesterday. Tons of precip with massive snow piling up in the colder air. Big Winter storms possible between the contrasting air masses.
360h GZ 500 forecast valid on Jan 15, 2020 00 UTC


Forecasts for the control (GEM 0) and the 20 ensemble members (global model not available)
GFS Ensemble mean(average of all the individual solutions above). The first map is a mid/upper level map. The 2nd one is a temperatures map at around 1 mile above the surface. These are anomalies(difference compared to average).
NCEP Ensemble t = 360 hour forecast

GFS Ensemble mean(average of all the individual solutions above). The first map is a mid/upper level map. The 2nd one is a temperatures map at around 1 mile above the surface. These are anomalies(difference compared to average).
NCEP Ensemble t = 360 hour forecast
Monday: Ridge in the Southeast is stronger and farther west(warmer) today vs Sunday.
Tuesday: Ridge East, trough West.......heavy precip in the middle, huge snows in the colder air. Big Winter storms possible between the contrasting air masses.

Latest, updated graph/forecast for AO and NAO here, including an explanation of how to interpret them...............mainly where they stand at the end of 2 weeks.
Previous analysis, with the latest day at the bottom for late week 2 period.
https://www.marketforum.com/forum/t
Discussions, starting with the oldest.
Last Monday: AO is MUCH more positive today, with most members pretty positive. NAO is also a bit more positive. This has really reduced the threat of turning much colder in January. It suggests that the frigid air will stay locked up to our north in Canada. PNA near 0.
Tuesday: Holy Cow! The AO soars higher in week 2 to the top of the chart and near record levels(drops a bit late but very positive). NAO is positive in week 2. Very low risk for cold to travel from high to mid latitudes. PNA near zero.
Wednesday: AO still gets extremely positive in the next week but tops out and potentially starts plunging lower at the end of 2 weeks(low confidence time frame). If that happens in 2 weeks, the bitter cold in Canada at the time will have a chance to move southward to lower latitudes(USA). NAO is positive but also dropping. PNA near zero. Indications of potential for much colder in parts of the US at the end of the period.
Thursday: AO spikes extremely high then plunges back to near 0 during week 2...........introducing a better chance for frigid temps that will be in Canada at the time of pushing farther south. NAO and PNA near 0, a tad positive.
Friday: AO continues very positive/high into week 2(not quite as high as earlier) but stays above 0 all the way out(though dropping a bit late. NAO stays a tad positive. Both favor making it tough for bitter cold to travel deeply south from high to mid latitudes.........though there will be some that gets south of the US border. PNA near 0.
Saturday: Similar to Friday but extreme changes in the AO during week 2. After spiking to lofty positives, it plunges to 0 and possibly negative after that at the end of the period. NAO goes from positive, crossing to negative territory and the end of 2 weeks. PNA stays around 0. Would rate the chances of cold pushing south during late week 2 as pretty high based on this, considering how cold it will be in Canada.
Sunday: AO way up and stays very positive for longer into week 2 today, with the NAO also more positive. This will make it tough to provide sustained push southward of the frigid air in Canada into the US. It can surge south briefly behind cold fronts but the general flow pattern with a solidly +AO and +NAO are not conducive for air from high latitudes to be transported to the middle latitudes(other than short lived cold snaps).PNA is negative which strongly favors the cold to be aimed at the West and not the East.
Tuesday: AO stays pretty positive for the duration with a wide spread at the end of 2 weeks(outside chance of it going negative). NAO stays positive too. PNA stays negative with low spread. Unfavorable for cold air to remain deeply entrenched in the southern and eastern US. Cold will impact the West/Rockies in a big way though.
National Weather Service 6-10 day, 8-14 day outlooks.
Updated daily just after 2pm Central.
Temperature Probability
 Precipitation Probability

| the 8-14 day outlooks ArchivesAnalogsLines-Only FormatGIS Data | |
Temperature Probability | |
 | |
Threat for extreme cold

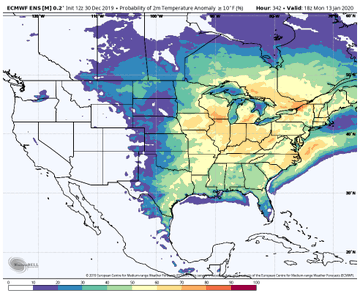
Just for entertainment, let's look at the low skill just updated European model monthly outlook, 850 mb temperatures, which is around a mile up. Starting with January 10th.
Bone chilling cold surges deeply into the eastern half of the country during the last 10 days of January...............however, it will probably look different with the next update in 3 days.
The European model 45 day weeklies were a bit colder than the previous run.
Take these maps and that forecast with a grain of salt.
Previous posts:
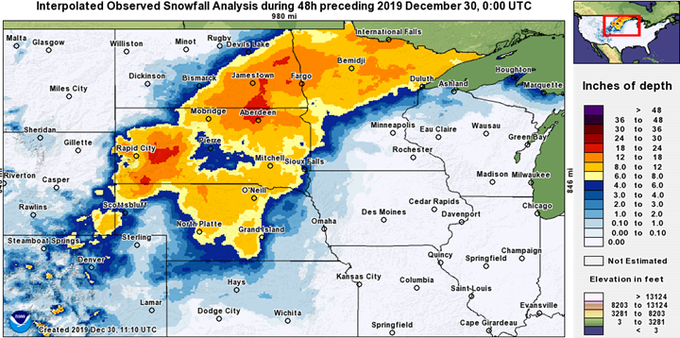
48-hour snowfall totals through 6 PM CST last evening
+++++++++++++++++++++++++++
By metmike - Dec. 30, 2019, 11:13 a.m.
Actual totals...big area with 4-6 feet
+++++++++++++++++++++++
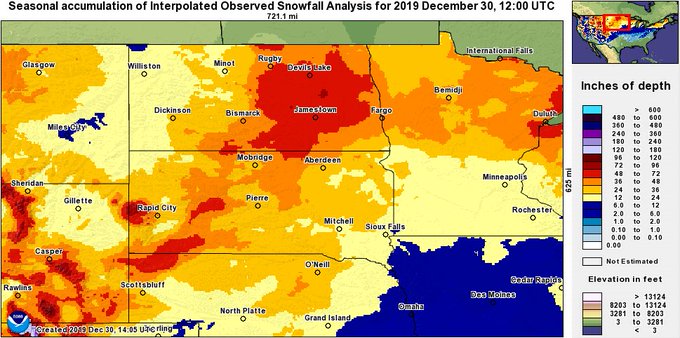
By metmike - Dec. 30, 2019, 11:14 a.m.
More than double the normal snowfall so far this winter for a big part of the Dakotas
+++++++++++++++++++++++++++++++++++++
By metmike - Dec. 30, 2019, 11:17 a.m.
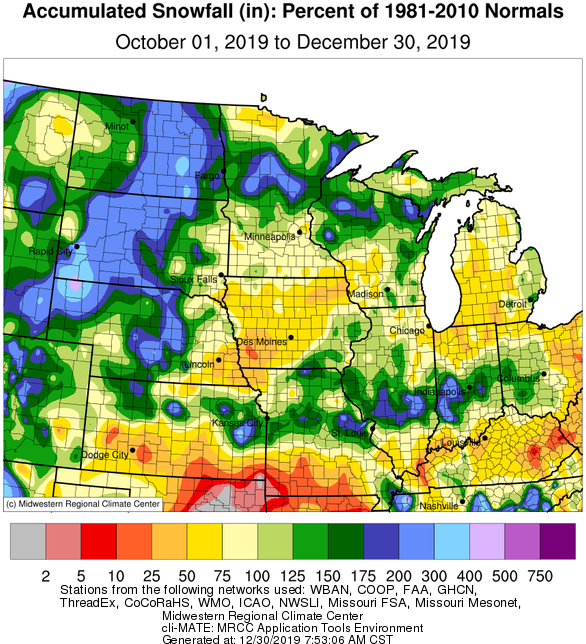
·
This cant be caused by 410 ppm co2, Off the charts warm area, but look to the east, Though smaller, off the charts cold showing up ( pink) has to be something natural occurring, perhaps of sub ocean origin ( thermal bursts from crust) compensating cooling out side of warmth
metmike: The map above with the warmth is the Northeast Pacific.
+++++++++++++++++++++++++++++++++++
By metmike - Dec. 30, 2019, 1:16 p.m.
·
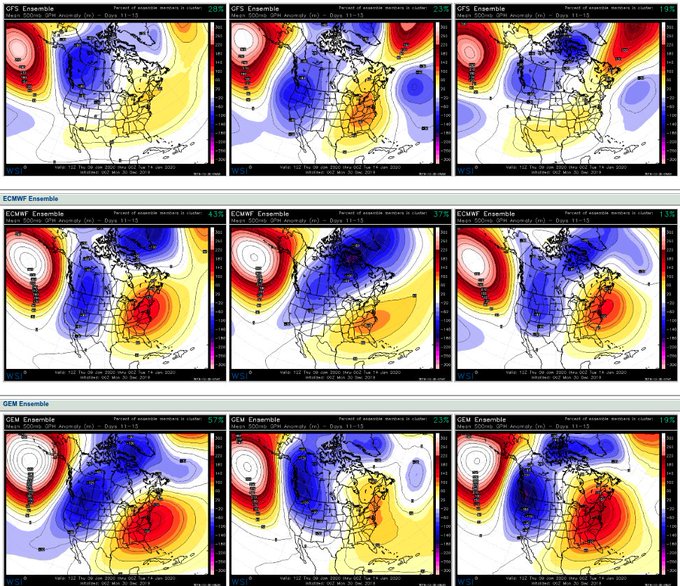
Top 3-Clusters (per http://wsitrader.com) of 500mb geopotential height anomalies averaged over the 11-15d period from the GEFS, ECMWF, and GEM Ensembles. LOCK IT IN: An upcoming high-amplitude ridge over the North Pacific, forcing a downstream -PNA response over the U.S.
++++++++++++++++++++++++++++++++++++++
·
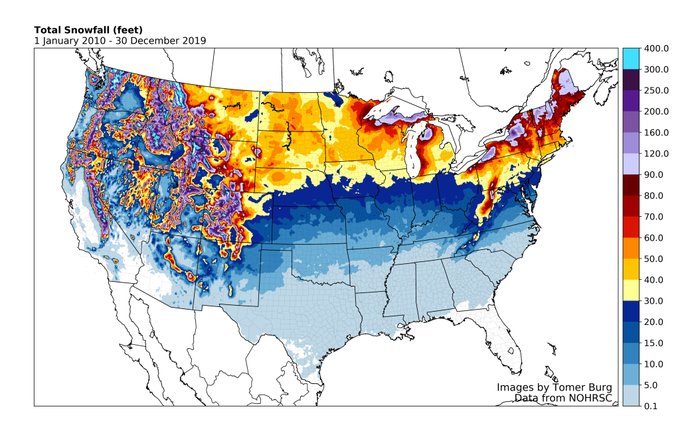
Adding by popular demand a map of estimated snow accumulation throughout the 2010s across the continental US:
·
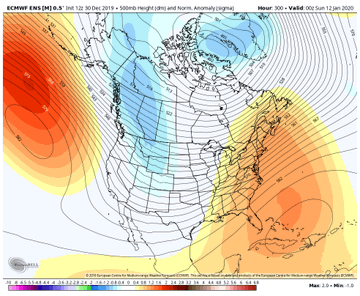
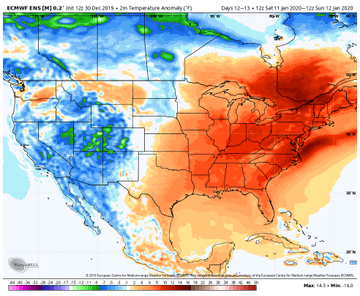
Great agreement on all global ensembles with the development of an anomalous +AO, +NAO and potential for troughing amplifying in the Western US. The result will be the potential for a highly amplified ridge in the Eastern US with well above normal temperatures Jan 10-15.


