From Dr. Roy Spencer's blog:
Dr. Spencer: So, based upon the observed SST data from the Hadley Centre, and hurricane data from the National Hurricane Center, we conclude that warming SSTs have caused a tiny increase in intensity of landfalling major hurricanes by 0.5 mph per decade.
I suspect a statistician (which I am not) would say that this is in the noise level.
In other words, there is no observational evidence that warming SSTs have made landfalling hurricanes on the east coast of Florida any stronger.


From Chris Martz weather:
Posted on February 17, 2019 by curryja
by Judith Curry
https://judithcurry.com/2019/02/17/hurricanes-climate-change-detection/
Below: Figure 3.1 shows the time series since 1981 of total global hurricanes and major hurricanes. On average, each year there are about 47 hurricanes with about 20 reaching major hurricane status. Substantial year-to-year variability is seen, with a slight decreasing trend in the number of hurricanes and a slight increasing trend in the number of major hurricanes.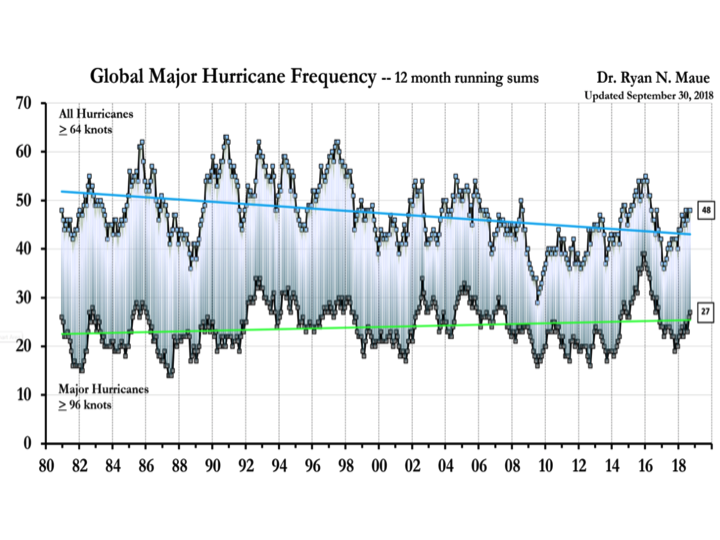 Below: Figure 3.2: Global and Northern Hemisphere Accumulated Cyclone Energy: 24 month running means. Note that the year indicated represents the value of ACE through the previous 24-months for the Northern Hemisphere (bottom line/gray boxes) and the entire global (top line/blue boxes). The area in between represents the Southern Hemisphere total ACE.
Source: Maue (2018)
Below: Figure 3.2: Global and Northern Hemisphere Accumulated Cyclone Energy: 24 month running means. Note that the year indicated represents the value of ACE through the previous 24-months for the Northern Hemisphere (bottom line/gray boxes) and the entire global (top line/blue boxes). The area in between represents the Southern Hemisphere total ACE.
Source: Maue (2018)
metmike: Until we regularly used airplanes to fly into hurricanes/tropical storms in the mid1940s, there was likely an undercounting of them. When the era of satellites began in the 1970's, tracking these system was really fine tuned.
The impact of undercounting is illustrated in Figure 3.7, which compares the raw hurricane counts (green) with adjusted counts (orange) for the period 1878-2015. The sign of the long-term trend depends critically on the adjustment.
