
Happy July 23rd! Do something to make somebody feel lucky today! Congrats to the Integral Heart Family on raising massive funds for their "lucky" children: https://www.marketforum.com/forum/topic/34791/
Scroll down and enjoy the latest comprehensive weather to the max...... occurring because of the natural physical laws in our atmosphere.
Tuesday update:
We continue to trade: "Rain makes Grain"(hot and dry are bullish).
The heat ridge has retrograded(backed up westward) this week....so much cooler right now than last week............similar to market expectation but the heat ridge will be re building across the northern tier later this week.
Forecasts continue to be a bit hotter than the ones at the end of last week, similar to slightly cooler vs Monday. Looks like there will be decent rains with the heat, so bearish the grains but the amount of rains is uncertain.
Here are the latest hazards across the country.
Purple/Pink/blue on land is cold/Winter weather. Brown is wind, Green is flooding. Gray is fog. Reddish is a red flag advisory.
Go to the link below, then hit the location/county on the map for details.
https://www.spc.noaa.gov/ Go to "hazards"

Current Weather Map
| NCEP Days 0-7 Forecast Loop | NCEP Short-Range Model Discussion | NCEP Day 3-7 Discussion |


Wind map Press down on this on the left with your cursor!


Current Jet Stream

| Low Temperatures Tomorrow Morning |

Highs today and tomorrow.
Much cooler.......in line with last weeks forecasts of below average temps to start the work week.


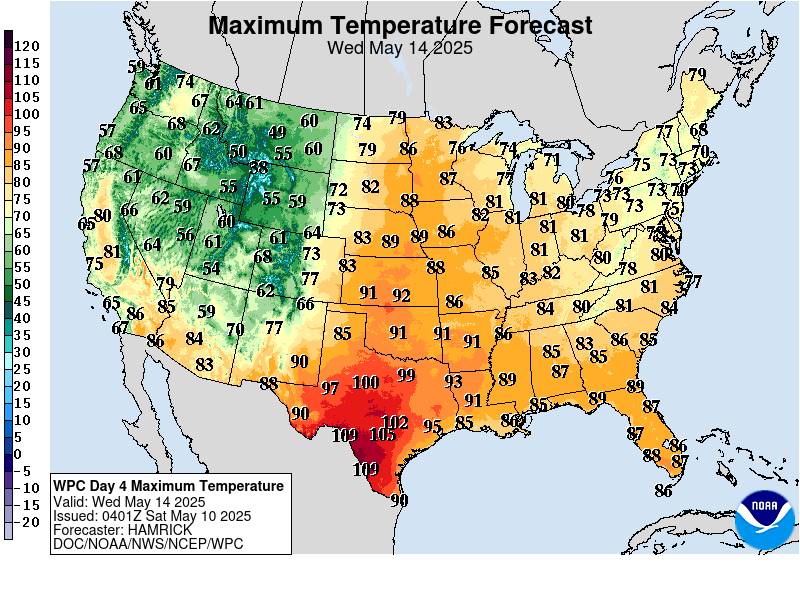
Highs for days 3-7:
Heating back up but not as hot as last week/weekend.



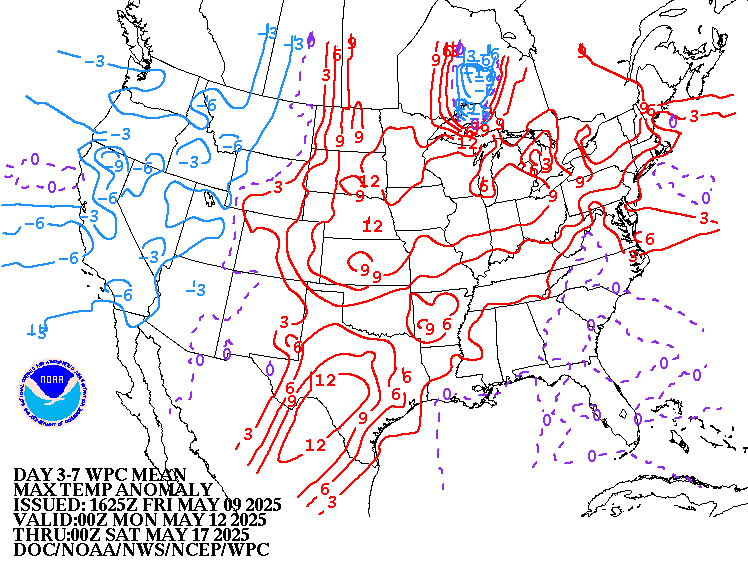
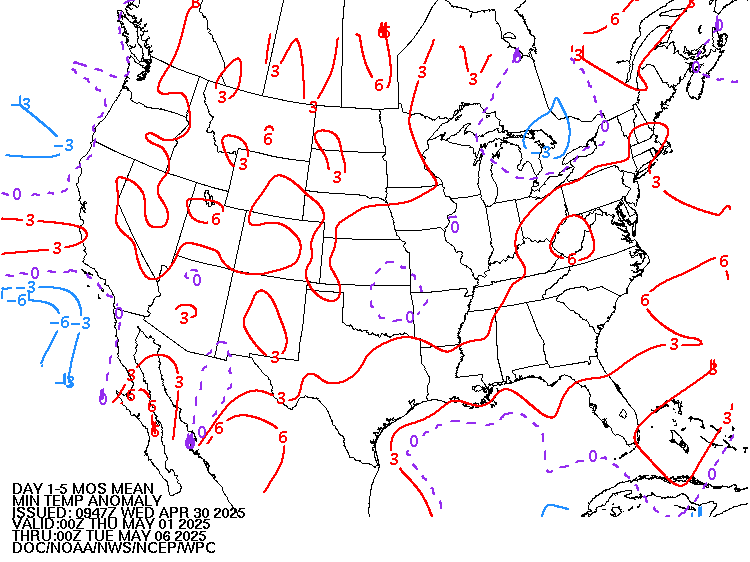
Temperatures compared to average for days 3-7 below
Heat ridge is out West early this week but the heat spreads east late week and continues after that. The South will be coolest compared to average.
https://www.wpc.ncep.noaa.gov/medr/medr_mean.shtml
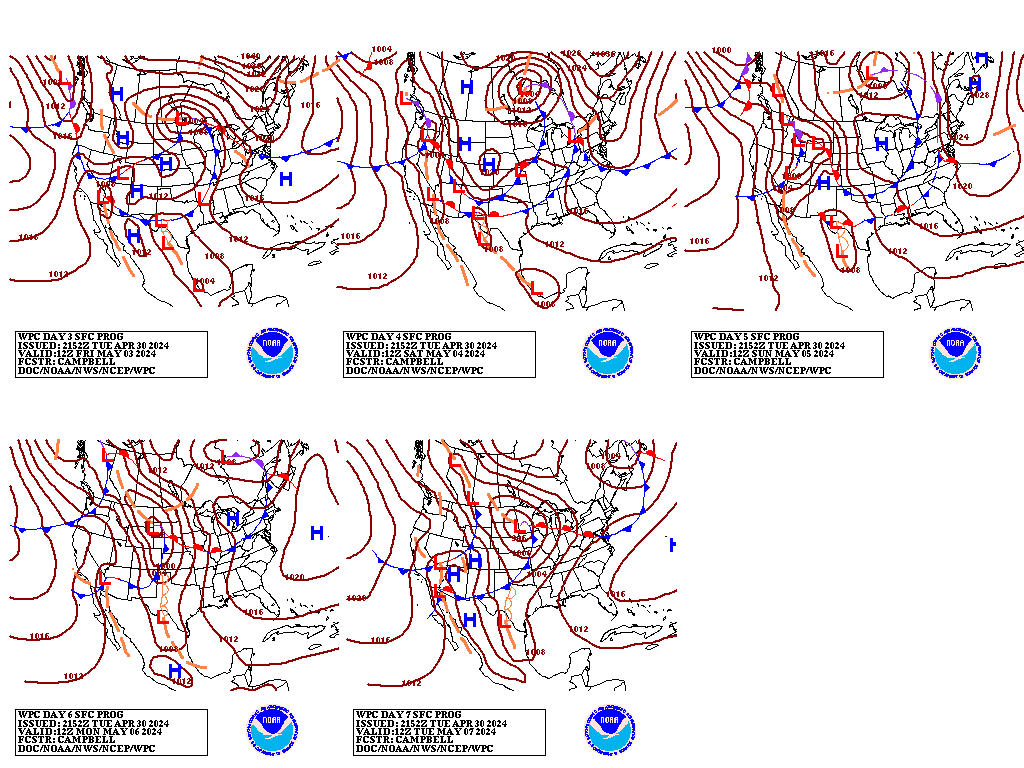
Weather maps for days 3-7 below
Canadian high pressure early this week. ................warming up with southerly winds later in the week on the back side, while staying dry in most of the Cornbelt........then rains with a cold front late this weekend into early next week N.Plains to Upper Midwest, shifting south next week.
Should have some decent heat again by the end of this period.
Liquid equivalent precip forecasts for the next 7 days are below.
Rains return northwest belt late this weekend, then farther south next week.
Day 1 below:
http://www.wpc.ncep.noaa.gov/qpf/fill_94qwbg.gif?1526306199054

Day 2 below:
http://www.wpc.ncep.noaa.gov/qpf/fill_98qwbg.gif?1528293750112

Day 3 below
http://www.wpc.ncep.noaa.gov/qpf/fill_99qwbg.gif?1528293842764

Days 4-5 below:
http://www.wpc.ncep.noaa.gov/qpf/95ep48iwbg_fill.gif?1526306162

Days 6-7 below:
http://www.wpc.ncep.noaa.gov/qpf/97ep48iwbg_fill.gif?1526306162

7 Day Total precipitation below:
http://www.wpc.ncep.noaa.govcdx /qpf/p168i.gif?1530796126

Risk of excessive rains.
Slight Risk today with the cold front in the Southeast....... then LOW risk for the rest of the week except for monsoon rains in the Southwest.
Mesoscale Precipitation Discussions
Current Day 1 Forecast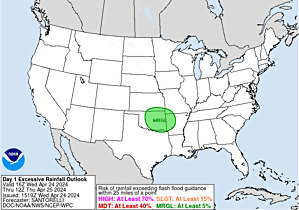 Valid 12Z 04/22/19 - 12Z 04/23/19 |
Day 1 Threat Area in Text Format
| Day 2 and Day 3 Forecasts |
Current Day 2 Forecast Valid 12Z 04/23/19 - 12Z 04/24/19 |
Day 2 Threat Area in Text Format
Current Day 3 Forecast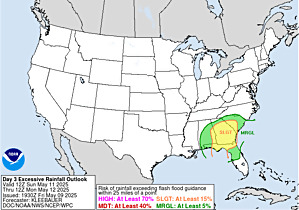 |
Severe Storm Risk
Slight risk today with the cold front along the East Coast............ then some storms with slight risk along the northern tier later this week.
Current Day 1 Outlook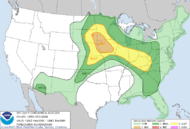 | Forecaster: Thompson/Squitieri Issued: 20/1624Z Valid: 20/1630Z - 21/1200Z Forecast Risk of Severe Storms: No Svr Tstms |
Current Day 2 Outlook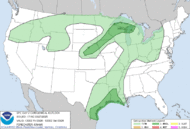 | Forecaster: Broyles Issued: 20/0546Z Valid: 21/1200Z - 22/1200Z Forecast Risk of Severe Storms: Marginal Risk |
Current Day 3 Outlook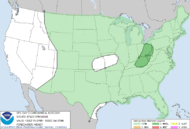 | Forecaster: Broyles Issued: 20/0711Z Valid: 22/1200Z - 23/1200Z Forecast Risk of Severe Storms: Marginal Risk |
Current Day 4-8 Outlook |
Last 24 hour precip top map
Last 7 day precip below that
https://www.wunderground.com/maps/precipitation/daily
Central IA and Northern/Central IL missed the rains.

Current Dew Points
Refreshingly pleasant air with VERY low humidity has spread way far south!

Latest radar loop
http://www.nws.noaa.gov/radar_tab.php


| (3400x1700 pixels - 2.2mb) Go to: Most Recent Image |

Go to: Most Recent Image
You can go to this link to see precipitation totals from recent time periods:
https://water.weather.gov/precip/
Go to precipitation, then scroll down to pick a time frame. Hit states to get the borders to see locations better. Under products, you can hit "observed" or "Percent of normal"
+++++++++++++++++++++++++++++++++++++++++++++++
Precipitation compared to average for the last 7, 14, 30 and 60 days.
Some spots in Iowa and especially N/C Illinois have dried out!
Usually not updated for previous day until late the next day.
https://www.atmos.illinois.edu/~snodgrss/Ag_Wx.html


Soilmoisture anomaly:
These maps sometimes take a day to catch up to incorporate the latest data(the bottom map is only updated once a week).
Parts of Iowa has dried out, along with parts of the central and eastern belt, especially N/C Illinois.
https://www.cpc.ncep.noaa.gov/products/Soilmst_Monitoring/US/Soilmst/Soilmst.shtml#


Currently, there is still 0% of the main Cornbelt/Midwest with long term drought.........but it's been very dry along the Canadian border. There is drought in the Southeast.
Short term dryness is becoming an issue is some spots that might result in a bit of long term drought (flash drought) later this Summer if rains don't pick up in the extended period.
The map below is updated on Thursdays.
The market has turned into a rain makes grain market( any hot/dry in the forecast will be considered as bullish for the next month+).
https://droughtmonitor.unl.edu/

The top map is the Canadian ensemble average, the maps below are the individual members that make up the average at the end of week 2.
+++++++++++++++++++++++++++++++++++++++++
Each member is like the parent, Canadian model operational model.......with a slight tweek/variation in parameters. Since we know the equations to represent the physics of the atmosphere in the models are not perfect, its useful to vary some of the equations that are uncertain(can make a difference) to see if it effects the outcome and how.
The average of all these variations(ensembles) often yields a better tool for forecasting. It's always more consistent. The individual operational model, like each individual ensemble member can vary greatly from run to run.........and represent an extreme end of the spectrum at times. The ensemble average of all the members, because it averages the extremes.............from opposite ends of the spectrum.........changes much less from run to run.
End of week 2....................0z ensembles:
Analysis starting from a week ago, ending with today:
Last week+ of analysis, starting with the day farthest in the past. This is an end of week 2 forecast!
Last Sunday: 12z run. Changes from the last several days continue...............heat ridge shifting west and weakening now. Troughing downstream in the East, back to the Midwest means the heat will be giving way to much cooler air during the last week of July. Half the solutions have this trough very deep........enough to cause much below temperatures if they are correct.
Monday: This model, in contrast to the other ones overnight is actually warmer and drier, with the heat ridge trying to come back east and bumping out the upper level trough in the East (which will bring down cool air) on around half of the solutions.
Tuesday: Midwest to Northeast trough a bit deeper today, so more cooling. Heat ridge in the S.Plains.
Wednesday: Almost a carbon copy of yesterday!
Sunday: Welcome back metmike! After retrograding west in week 1(as was predicted and anticipated by the market last week, Heat ridge is trying to build back east during week 2.........actually starting late in week 1.
Monday: Where will the heat ridge be? This model like the idea of the Southwest to Southern Plains for the center of it but with a wide spread in solutions.
Tuesday: Very similar to Monday.
360h GZ 500 forecast valid on Aug 07, 2019 00 UTC
Analysis, starting with the oldest, ending with the most recent:
Last Monday: Deep trough/cut off low far sw Canada with a downstream heat ridge.......extremely impressive. This was the 0z model. The last run of the US model took out all this heat and the other models added rains in week 2 which has taken out much of the bullish gusto from Sunday evening.
Tuesday: Where will the HUGE heat ridge be at the end of 2 weeks?
Wednesday: Massive heat ridge in week 2. Best location is the middle of the country on this model but uncertain.
Thursday: Massive heat ridge. Will it back up towards the west a bit late in week 2?
Friday: Potential for the massive heat ridge to back up west and allow some northern stream cooling to the east but solutions are going back and forth on this. It's a dry pattern for most of the Corn, regardless.
Saturday: This model also is not sure about the location of the dome of upper level high pressure, favoring the Rockies to points southeast with a potential downstream upper level trough in the Northeast.
Sunday: Upper ridging is rebuilding in Central Canada and connecting to downstream troughing below it that may extend all the way into the Upper Midwest/Northeast. This means MUCH cooler air masses from Canada. Heat ridge backs to the southwest of the position it will be in later this week.
Monday: Most have the ridge/West, trough/East couplet that means cool temps. The last runs also increased rains with this pattern that can often be fairly dry.
Tuesday: Deep trough in the Northeast means cool Midwest.
Wednesday: Bigger spread on this model vs Tuesday, with a few(minority) bringing the heat ridge east.
Sunday: Wide spread on the location of the heat ridge as week 2 progresses.......and the location of a potential upper level trough that might be forced to stay in Canada if the heat ridge bullies its way far enough east.
Monday: Heat ridge out West........how far east can it expand with its heat and how much upper troughing/cooling downstream might try to interfere with that heat in the Northeast.
Tuesday: Northern stream in Canada getting active. How much influence will it have south of the border with cold fronts/how far south will they go?

GFS Ensemble mean(average of all the individual solutions above). The first map is a mid/upper level map. The 2nd one is a temperatures map at around 1 mile above the surface. These are anomalies(difference compared to average). The daily analysis starts with the oldest and ends with the latest.
Last Sunday: Huge change in the positive anomaly center with it massively growing from yesterday in NorthCentral Canada. Weak negative anomaly below it in southeast Canada to around the Great Lake links up to some potential northern stream cold fronts.
Monday: Looks just like Sunday. Positive anomaly N/C Canada extending to W USA with a weak negative anomaly from SE Canada to the Eastern 1/3 of the US that translates to a potential connection with some cooler air from Canada.
Tuesday: Same big positive anomaly in N/C Canada coupled with negative anomaly in the Northeast for cool air delivery south of the border.
Wednesday: Positive anomaly center shifted to NW Canada but positive in the Western US and weakness downstream suggest cool temps............possibly dry. Potential building heights from the W.Atlantic to the East Coast which might bring hot weather back to the East in less than 2 weeks.
Sunday: Welcome back metmike! Positive anomaly heights across the northern tier strongly supports heat. Negative heats in the south favors less heat for this time of year. This is sometimes a dry-ish pattern but the models like the idea of average to above average rains in week 2.
Monday: Band of positive anomalies across the northern tier means very warm temps have a good chance to spread across the country in that location. Very weak negative anomaly in the deep south suggest less heat there.
Tuesday: The change from yesterday is the significant negative anomaly in Southeast Canada. This is associated with an upper level trough which will modulate cold fronts driven south into the Midwest and is also the reason for the forecast to be wet. Take that feature away, and the heat ridge would be more powerful/be able to expand farther northeast.
NCEP Ensemble t = 360 hour forecast
Latest, updated graph/forecast for AO and NAO here, including an explanation of how to interpret them...............mainly where they stand at the end of 2 weeks.
Previous analysis, with the latest day at the bottom for late week 2 period.
Last Sunday: AO a smidgen below 0, PNA bouncing around but I think the noteworthy indices here is the negative NAO which will be associated with the trough in the East which causes the cooler weather later in July.
Monday: AO is near 0, maybe a tad less. NAO is negative with the trough in the east and favors cooler temperatures. PNA is also negative but unstable with some uncertainty in the West.
Tuesday: AO near 0. Negative NAO means cool. Negative but gyrating to 0 PNA, some uncertainty out west.
Wednesday: AO near 0. Huge change in NAO, which is pretty positive in week 2 vs negative previously. Might an upper level ridge try to build along the East Coast???PNA wildly fluctuating around 0.
Sunday: Welcome back metmike! AO close to 0. NAO slightly negative. PNA wildly gyrating still and favoring positive with the exact location of the heat ridge in the West playing a role.
Monday: AO around 0. NAO around 0 but with a wide spread because of uncertainty with a potential trough in the Northeast......or no trough. PNA gyrating from positive to near 0.
Tuesday: AO near 0. NAO a bit negative with the potential upper level trough in Southeast Canada meaning a factor. PNA has an extremely wide spread, much uncertainty out West.
National Weather Service 6-10 day, 8-14 day outlooks.
My comments below are usually made hours before the afternoon update, starting with the oldest comment.
Last
Sunday: Confidence getting pretty high for the pattern change to cooler. This will definitely show up with gusto in the 8-14 day forecasts for the next few days, then the 6-10 day, possibly catching some of it later today. How much rain during that period. Good question. The air masses coming from Canada may not have deep moisture but this pattern in July can be dry or turn much wetter, depending on where upper level troughing sets up in the Midwest to points east.
Monday: Continuing to cool into the 6-10 day period now as the change to the heat ridge shifting west gets closer. How much rain to put in the forecast? The last few days, the case was strong for it to be dry. Today, much of the guidance is a bit wetter than before but not all of it. Rain amounts for the periods below are very uncertain.
Tuesday: Cooler again for sure. The case to increase rains is going up.
Wednesday: Hot West, cool East again, maybe dry Midwest with very low confidence. At the end of 2 weeks, the pattern could morph to ridge building East.......just a chance of that on a few solutions this morning and that won't show us in the NWS forecasts this afternoon.
Sunday: Welcome back metmike: The new location of the heat will be in the northern half of the US, as the heat continues out West but spreads east across the country. Below temps favored in the South. How much rain is the huge question. One factor modulating rains will be the location of the center of the heat ridge. Will it allow fronts on the east side? Will it be a ring of fire pattern with perturbations coming over the top and firing up storm clusters? Will it be farther northeast and shut down rains? Could it be so far east that it allows systems to the west to really increase rains across the Plains and points eastward as deep moisture returns?
Monday: Heat out West, spreading east, especially northern tier. Not as much heat in the deep south. Precip? Historically, the set up can be on the dry side but some of the models have average to above average rains.
Tuesday: The NWS will go hot north and not as hot south again. Probably lots of rain but this pattern could turn dry of the cold fronts coming south of the border stay farther north and the heat ridge is more dominant.
Temperature Probability
| the 8-14 day outlooks ArchivesAnalogsLines-Only FormatGIS Data | |
Temperature Probability | |
 | |