KEY EVENTS TO WATCH FOR:
Wednesday, April 3, 2019
7:00 AM ET. MBA Weekly Mortgage Applications Survey
Composite Idx (previous 424.6)
Composite Idx, W/W% (previous +8.9%)
Purchase Idx-SA (previous 267.5)
Purchase Idx-SA, W/W% (previous +6.4%)
Refinance Idx (previous 1289.5)
Refinance Idx, W/W% (previous +12.4%)
8:15 AM ET. March ADP National Employment Report
Private Sector Jobs, Net Chg (expected +173000; previous +183000)
9:45 AM ET. March US Services PMI
PMI, Services (expected 54.8; previous 56.0)
10:00 AM ET. March Online Help Wanted Index
10:00 AM ET. February Metropolitan Area Employment & Unemployment
10:00 AM ET. March ISM Non-Manufacturing Report on Business
Non-Mfg Composite Idx (expected 58.0; previous 59.7)
Non-Mfg Business Idx (previous 64.7)
Prices Idx (previous 54.4)
Employment Idx (previous 55.2)
New Orders Idx (previous 65.2)
10:00 AM ET. IMF World Economic Outlook analytical chapters
10:30 AM ET. EIA Weekly Petroleum Status Report
Crude Oil Stocks (Bbl) (previous 442.283M)
Crude Oil Stocks, Net Chg (Bbl) (previous +2.8M)
Gasoline Stocks (Bbl) (previous 238.62M)
Gasoline Stocks, Net Chg (Bbl) (previous -2.883M)
Distillate Stocks (Bbl) (previous 130.167M)
Distillate Stocks, Net Chg (Bbl) (previous -2.075M)
Refinery Usage (previous 86.6%)
Total Prod Supplied (Bbl/day) (previous 20.13M)
Total Prod Supplied, Net Chg (Bbl/day) (previous -1.362M)
11:00 AM ET. March Global Services PMI
PMI, Services (previous 53.3)
11:30 AM ET. SEC Closed Meeting
The STOCK INDEXES http://quotes.ino.com/ex changes/?c=indexes"
The STOCK INDEXES:The June NASDAQ 100 was higher overnight as it extends the rally off December's low. The high-range overnight trade sets the stage for a steady to higher opening when the day session begins trading. Stochastics and the RSI are overbought but remain neutral to bullish signaling that sideways to higher prices are possible near-term. If June extends the rally off December's low, last-October's high crossing at 7767.00 is the next upside target. Closes below the 20-day moving average crossing at 7345.61 would confirm that a short-term top has been posted. First resistance is the overnight high crossing at 7576.75. Second resistance is the October 3rd 2018 high crossing at 7767.00. First support is the 20-day moving average crossing at 7345.61. Second support is the 50-day moving average low crossing at 7139.74.
The June S&P 500 was higher overnight as it extended the rally off December's low and tested the 87% retracement level of the September-December-decline crossing at 2879.73.Stochastics and the RSI are overbought but remain neutral to bullish signaling that sideways to higher prices are possible near-term. If June extends the rally off December's low, last-September high crossing at 2957.90 is the next upside target. Closes below the reaction low crossing at 2792.40 would confirm that a short-term top has been posted. First resistance is the 87% retracement level of the September-December-decline crossing at 2879.73. Second resistance is last-September's high crossing at 2957.90. First support is the reaction low crossing at 2792.40. Second support is the 50-day moving average crossing at 2773.68.
INTEREST RATES http://quotes.ino.com/ex changes/?c=interest"
INTEREST RATES: June T-bonds were lower overnight as they extend the decline off March's high. Stochastics and the RSI are neutral to bearish signaling that a short-term top might be in or is near. Closes below the 20-day moving average crossing at 147-13 are needed to confirm that a short-term top has been posted. If June resumes the rally off March's low, weekly resistance crossing at 152-01 is the next upside target. First resistance is March's high crossing at 150-21. Second resistance is weekly resistance crossing at 152-01. First support is the 20-day moving average crossing at 147-13. Second support is the 50-day moving average crossing at 146-03.
June T-notes were lower overnight as they extend the decline off March's high. Stochastics and the RSI are neutral to bearish signaling that sideways to lower prices are possible near-term. Closes below the 20-day moving average crossing at 123.138 would confirm that a short-term top has been posted. If June resumes the rally off March's low, weekly resistance crossing at 125.265 is the next upside target.First resistance is March's high crossing at 124.310. Second resistance is weekly resistance crossing at 125.265. First support is the 20-day moving average crossing at 123.138. Second support is the 50-day moving average crossing at 122.220.
ENERGY MARKETS? http://quotes.ino.com/ex?changes/?c=energy ""
May crude oil was steady to slightly higher overnight as it extends the rally off December's low. The mid-range overnight trade sets the stage for a steady to higher opening when the day session begins trading. Stochastics and the RSI are overbought but remain neutral to bullish signaling that sideways to higher prices are possible near-term. If May extends the rally off December's low, the 62% retracement level of the October-December-decline crossing at 63.39 is the next upside target. Closes below the 20-day moving average crossing at 59.33 are needed to confirm that a short-term top has been posted. First resistance is the overnight high crossing at 62.99. Second resistance is the 62% retracement level of the October-December-decline crossing at 63.39. First support is the 20-day moving average crossing at 59.33. Second support is the 50-day moving average crossing at 56.98.
May heating oil was higher overnight while extending the February-March trading range. The low-range overnight trade sets the stage for a steady to lower opening when the day session begins trading. Stochastics and the RSI are overbought but remain neutral to bullish signaling that sideways to higher prices are possible near-term. If May resumes the rally off December's low, the 62% retracement level of the October-December-decline crossing at 211.17 is the next upside target. Closes below the reaction low crossing at 193.69 would confirm a downside breakout of the February-March trading range. First resistance is the 62% retracement level of the October-December-decline crossing at 211.17. Second resistance is the 75% retracement level of the October-December-decline crossing at 221.89. First support is the 50-day moving average crossing at 196.04. Second support is the reaction low crossing at 193.69.
May unleaded gas was higher overnight as it extends the rally off December's low. Stochastics and the RSI are overbought but remain neutral to bullish signaling that sideways to higher prices are possible near-term. If May extends the rally off December's low, the 62% retracement level of the October-December-decline crossing at 200.45 is the next upside target. Closes below last-Thursday's low crossing at 181.47 would confirm that a short-term top has been posted. First resistance is the overnight high crossing at 194.10. Second resistance is the 62% retracement level of the October-December-decline crossing at 200.45. First support is last-Thursday's low crossing at 181.47. Second support is the 50-day moving average crossing at 176.06.
May Henry natural gas was slightly lower overnight. The mid-range overnight trade sets the stage for a steady to lower opening when the day session begins trading. Stochastics and the RSI are oversold but remain neutral to bearish signaling that sideways to lower prices are possible near-term. If May extends the decline off March's high, the reaction low crossing at 2.620 is the next downside target. Closes above the 20-day moving average crossing at 2.784 would confirm that a short-term low has been posted. First resistance is the 10-day moving average crossing at 2.731. Second resistance is the 20-day moving average crossing at 2.784. First support is last-Friday's low crossing at 2.656. Second support is the Feb. 15th reaction low crossing at 2.620.
CURRENCIEShttp://quotes.ino.com/ex changes/?c=currencies"
CURRENCIES:The June Dollar was lower overnight as it consolidates some of the rally off March's low. Stochastics and the RSI are overbought and are turning neutral to bearish signaling that a double top with March's high might have been posted with Tuesday's high. Closes below the 50-day moving average crossing at 95.95 would confirm that a double top has been posted. If June extends the rally off March's low, March's high crossing at 97.16 is the next upside target.First resistance is March's high crossing at 97.16. Second resistance is weekly resistance crossing at 97.83. First support is the 20-day moving average crossing at 96.35. Second support is the 50-day moving average crossing at 95.95.
The June Euro was higher overnight following Tuesday's spike below the 87% retracement level of the 2016-2018-rally crossing at 112.62 as it consolidates some of the decline off March's high. The high-range trade overnight sets the stage for a steady to higher opening when the day session begins trading. Stochastics and the RSI are oversold but remain neutral to bearish signaling that sideways to lower prices are possible near-term. If June extends the aforementioned decline, the January-2017 low crossing at 110.16 is the next downside target. Closes above the 20-day moving average crossing at 113.64 would confirm that a short-term low has been posted. First resistance is the 20-day moving average crossing at 113.64. Second resistance is the 50-day moving average crossing at 114.34. First support is the 87% retracement level of the 2016-2018-rally crossing at 112.62. Second support is the January-2017 low crossing at 110.16.
The June British Pound was higher overnight. The high-range overnight trade sets the stage for a steady to higher opening when the day session beings trading. Stochastics and the RSI are neutral to bullish signaling that sideways to higher prices are possible near-term. Closes above the 20-day moving average crossing at 1.3222 would temper the near-term bearish outlook. Closes below March's low crossing at 1.3026 would confirm that a short-term top has been posted. First resistance is March's high crossing at 1.3441. Second resistance is the 50% retracement level of the 2018 decline crossing at 1.3603. First support is March's low crossing at 1.3026. Second support is February's low crossing at 1.2854.
The June Swiss Franc was slightly higher overnight. Stochastics and the RSI are neutral to bearish signaling that sideways to lower prices are possible near-term. Closes below the 20-day moving average crossing at 1.0086 would confirm that a short-term top has been posted. If June resumes the rally off March's low, the September-January downtrend line crossing near 1.0224 is the next upside target. First resistance is March's high crossing at 1.0191. Second resistance is the September-January downtrend line crossing near 1.0224. First support is the 20-day moving average crossing at 1.0086. Second support is March's low crossing at 0.9970.
The June Canadian Dollar was higher overnight. Stochastics and the RSI are neutral to bullish signaling that sideways to higher prices are possible near-term. Closes above the 50-day moving average crossing at 75.46 are needed to confirm that a short-term low has been posted. If June renews the decline off February's high, December's low crossing at 73.47 is the next likely downside target. First resistance is the 50-day moving average crossing at 75.46. Second resistance is the late-February high crossing at 76.46. First support is March's low crossing at 74.43. Second support is December's low crossing at 73.47.
The June Japanese Yen was lower overnight as it extends the decline off March's high. Stochastics and the RSI are neutral to bearish signaling that sideways to lower prices are possible near-term. If June extends the decline off March's high, the 87% retracement level of the November-January rally crossing at 0.0900 is the next downside target. Closes above the 50-day moving average crossing at 0.0912 would temper the near-term bearish outlook. First resistance is March's high crossing at 0.0918. Second resistance is the late-January high crossing at 0.0931. First support is the 87% retracement level of the November-January rally crossing at 0.0900. Second support is last-November's low crossing at 0.0893.
PRECIOUS METALS http://quotes.ino.com/ex changes/?c=metals"
PRECIOUS METALS: April gold was steady to slightly higher overnight. Stochastics and the RSI are oversold but remain neutral to bearish signaling that sideways to lower prices are possible near-term. If April extends the decline off March's high, 50% retracement level of the September-February-rally crossing at 1273.20 is the next downside target. Closes above the 50-day moving average crossing at 1309.20 would temper the near-term bearish outlook. First resistance is March's high crossing at 1324.50. Second resistance is February's high crossing at 1349.80. First support is March's low crossing at 1280.80. Second support is the 50% retracement level of the September-February-rally crossing at 1273.20.
May silver was higher overnight. Stochastics and the RSI are turning neutral to bullish signaling that a short-term low might be in or is near. Closes above the 20-day moving average crossing at 15.284 are needed to confirm that a short-term low has been posted. If May extends the decline off February's high, the 75% retracement level of the November-January-rally crossing at 14.644 is the next downside target. First resistance is the 20-day moving average crossing at 15.292. Second resistance is the 50-day moving average crossing at 15.576. First support is the 62% retracement level of the November-January-rally crossing at 14.935. Second support is the 75% retracement level of the November-January-rally crossing at 14.644.
May copper was higher overnight. The high-range trade sets the stage for a steady to higher opening when the day session begins trading. Stochastics and the RSI are neutral to bullish signaling that sideways to higher prices are possible near-term. If May renews the rally off January's low, the 62% retracement level of the April-December-2018 decline crossing at 306.69 is the next upside target. Closes below the 50-day moving average crossing at 286.26 would confirm that a short-term top has been posted. First resistance the 50% retracement level of the April-December-2018 decline crossing at 296.76. Second resistance the 62% retracement level of the April-December-2018 decline crossing at 306.69. First support is the 50-day moving average crossing at 286.26. Second support is the reaction low crossing at 275.95.
GRAINS http://quotes.ino.com/ex changes/?c=grains
May corn was higher overnight as it consolidates some of last-Friday's decline. The high-range trade overnight sets the stage for a steady to higher opening when the day session begins trading. Stochastics and the RSI are turning neutral to bullish signaling that a short-term low might be in or is near. Closes above the 10-day moving average crossing at 3.70 would confirm that a short-term low has been posted. If May extends this year's decline, psychological support crossing at 3.50 is the next likely downside target. First resistance is the 10-day moving average crossing at 3.70. Second resistance is March's high crossing at 3.80 3/4. First support is last-Friday's low crossing at 3.56. Second support is psychological support crossing at 3.50.
May wheat was higher overnight.The high-range overnight trade sets the stage for a steady to higher opening when the day session begins trading. Stochastics and the RSI are turning neutral to bullish signaling that sideways to higher prices are possible near-term. If May resumes the rally off March's low, the 50-day moving average crossing at 4.84 1/4 is the next upside target. Closes below the 20-day moving average crossing at 4.57 1/2 would confirm that a short-term top has been posted. First resistance is the reaction high crossing at 4.75 1/2. Second resistance is the 50-day moving average crossing at 4.84 1/4. First support is March's low crossing at 4.27. Second support is long-term support crossing at 4.19 1/4.
May Kansas City Wheat closed down 1 1/4-cents at 4.33 1/4.
May Kansas City wheat closed lower on Tuesday. The high-range close sets the stage for a steady to higher opening when Wednesday night session begins trading. Stochastics and the RSI are neutral to bearish signaling that sideways to lower prices are possible near-term. If May renews the decline off December's high, weekly support crossing at 4.17 3/4 is the next downside target. If May resumes the rally off March's low, the 50-day moving average crossing at 4.68 1/4 is the next upside target. First resistance is last-Tuesday's high crossing at 4.54. Second resistance is the 50-day moving average crossing at 4.68 1/4. First support is March's low crossing at 4.18 1/4. Second support is weekly support crossing at 4.17 3/4.
May Minneapolis wheat was higher overnight as it consolidates some of the decline off March's high. The high-range overnight trade sets the stage for a steady to higher opening when the day session begins trading. Stochastics and the RSI are oversold but remain neutral to bearish signaling that sideways to lower prices are possible near-term. If May extends the decline off March's high, weekly support crossing at 5.23 3/4 is the next downside target. Closes above the 50-day moving average crossing at 5.63 1/4 would confirm that a short-term low has been posted. First resistance is March's high crossing at 5.76 3/4. Second resistance is February's high crossing at 5.81 1/4. First support is Tuesday's low crossing at 5.40. Second support is weekly support crossing at 5.23 3/4.
SOYBEAN COMPLEX? http://quotes.ino.com/ex?changes/?c=grains "
May soybeans were higher overnight as they consolidate some of last-Friday's decline. The mid-range overnight trade sets the stage for a steady to higher opening when the day session begins trading. Stochastics and the RSI are neutral to bullish signaling that sideways to higher prices are possible near-term. Closes above the 20-day moving average crossing at 8.99 1/4 would confirm that a short-term low has been posted. If May extends the decline off February's high, the 75% retracement level of the September-December 2018 rally crossing at 8.78 is the next downside target. First resistance is the 20-day moving average crossing at 8.99 1/4. Second resistance is the reaction high crossing at 9.12. First support is last-Friday's low crossing at 8.83. Second support is the 75% retracement level of the September-December 2018 rally crossing at 8.78.
May soybean meal was steady to slightly higher overnight as it consolidates some of last-week's decline. The mid-range trade sets the stage for a steady to higher opening when the day session begins trading. Stochastics and the RSI are turning neutral to bullish signaling that a low might be in or is near. Closes above the 50-day moving average crossing at 310.40 would temper the near-term bearish outlook. If May resumes last week's decline, March's low crossing at 300.30 is the next downside target. First resistance is March's high crossing at 316.50. Second resistance is February's high crossing at 321.30. First support is last-Wednesday's low crossing at 303.60. Second support is March's low crossing at 300.30.
May soybean oil was higher overnight as it consolidates some of this year's decline. The high-range overnight trade sets the stage for a steady to higher opening when the day session begins trading. Stochastics and the RSI are turning neutral to bullish signaling that sideways to higher prices are possible near-term. Closes above the 20-day moving average crossing at 29.17 are needed to confirm that a short-term low has been posted. If May extends the decline off February's high, the 87% retracement level of the November-February-rally crossing at 28.17 is the next downside target. First resistance is the 20-day moving average crossing at 29.17. Second resistance is the reaction high crossing at 30.64. First support is last-Friday's low crossing at 28.34. Second support is the 87% retracement level of the November-February-rally crossing at 28.17.
LIVESTOCKhttp://quotes.ino.com/exchanges/?c=livestock
June hogs closed up $3.00 at $91.50.
June hogs closed limit up on Tuesday as it rebounded off support marked by the 20-day moving average. The high-range close sets the stage for a steady to higher opening when Wednesday's night session begins trading. Stochastics and the RSI are poised to turn neutral to bullish with additional strength on Wednesday. If June renews the rally off February's low, weekly resistance crossing at 98.17 is the next upside target. Closes below the 20-day moving average crossing at 87.11 would confirm that a short-term top has been posted. First resistance is March's high crossing at 97.82. Second resistance is weekly resistance crossing at 98.17. First support is the 20-day moving average crossing at 87.11. Second support is the 50-day moving average crossing at 80.55.
April cattle closed up $0.10 at 126.28.
April cattle closed higher on Tuesday. Stochastics and the RSI are oversold but remain neutral to bearish signaling that sideways to lower prices are possible near-term. If April extends the decline off March's high, the 25% retracement level of the 2018-2019 rally crossing at 125.45 is the next downside target. Closes above 20-day moving average crossing at 127.92 are needed to confirm that a short-term low has been posted. First resistance is the 20-day moving average crossing at 127.92. Second resistance is March's high crossing at 130.45. First support is the 25% retracement level of the 2018-2019-rally crossing at 125.45. Second support the 38% retracement level of the 2018-2019-rally crossing at 122.80.
April Feeder cattle closed down $0.60 at $144.85.
April Feeder cattle closed lower on Tuesday as it extends the decline off March's high. The low-range close sets the stage for a steady to lower opening when Wednesday's session begins trading. Stochastics and the RSI are neutral to bearish signaling that sideways to lower prices are possible near-term. If April extends the decline off March's high, March's low crossing at 143.50 is the next downside target. Closes above Monday's high crossing at 147.20 would confirm that a low has been posted. First resistance is March's high crossing at 150.80. Second resistance is last-October's high crossing at 155.70. First support is March's low crossing at 143.50. Second support is January's low crossing at 142.62.
FOOD & FIBERhttp://quotes.ino.com/ex changes/?c=food
May coffee closed lower on Tuesday as it extends this year's decline. The low-range close sets the stage for a steady to lower opening on Wednesday. Stochastics and the RSI are oversold but remain neutral to bearish signaling that sideways to lower prices are possible near-term. If May extends this winter's decline, weekly support crossing at 9.12 is the next downside target. Closes above the 20-day moving average crossing at 9.56 are needed to confirm that a low has been posted.
May cocoa closed higher on Tuesday as it extends the rally off March's low. The high-range close sets the stage for a steady to higher opening on Wednesday. Stochastics and the RSI are neutral to bullish signaling sideways to higher prices are possible near-term. If May extends the rally off March's low, December's high crossing at 24.64 is the next upside target. Closes below the 20-day moving average crossing at 22.21 would temper the near-term friendly outlook.
May sugar closed lower on Tuesday as it extends this year's trading range. The mid-range close set the stage for a steady opening on Wednesday. Stochastics and the RSI are neutral to bullish signaling that sideways to higher prices are possible near-term. If May resumes the rally off March's low, February's high crossing at 13.42 is the next upside target. May renews the decline off February's high, January's low crossing at 11.82 is the next downside target.
May cotton closed lower on Tuesday. The high-range close sets the stage for a steady to higher opening on Wednesday. Stochastics and the RSI are neutral to bullish signaling that sideways to higher prices are possible near-term. If May extends the rally off February's low, the 38% retracement level of the 2018-2019-decline crossing at 79.88 is the next upside target. Closes below the 20-day moving average crossing at 75.76 would confirm that a short-term top has been posted.
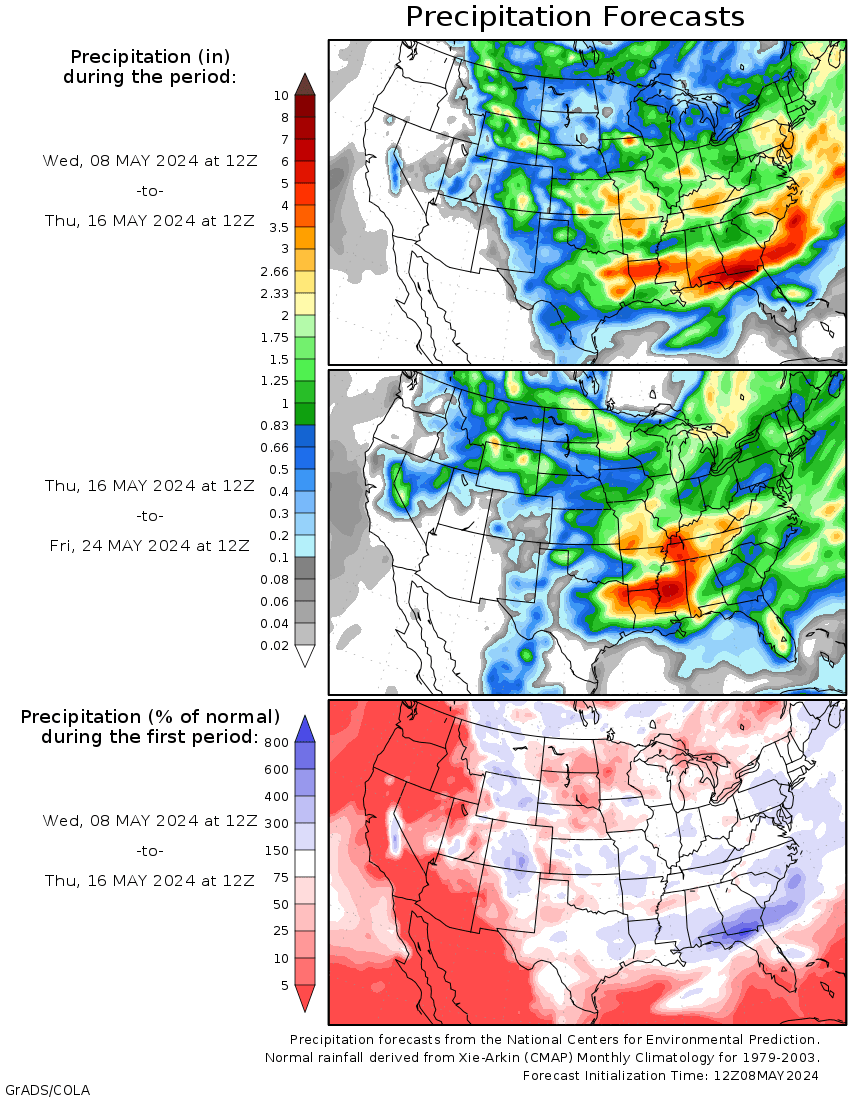
Thanks tallpine, watching the one below with interest during April because of soggy soils and producers needing to start planting in the next month.
If we stay wet...........corn will go higher.
If we dry out............corn will go lower.
"May corn was higher overnight as it consolidates some of last-Friday's decline. The high-range trade overnight sets the stage for a steady to higher opening when the day session begins trading. Stochastics and the RSI are turning neutral to bullish signaling that a short-term low might be in or is near. Closes above the 10-day moving average crossing at 3.70 would confirm that a short-term low has been posted. If May extends this year's decline, psychological support crossing at 3.50 is the next likely downside target. First resistance is the 10-day moving average crossing at 3.70. Second resistance is March's high crossing at 3.80 3/4. First support is last-Friday's low crossing at 3.56. Second support is psychological support crossing at 3.50. "
This comes from the GFS operational model, updated every 12 hours.