March has started extremely cold! Do something to warm somebody's heart today. Don't just think about it........do it. Then think about it.............and how you just made somebody's world a tiny bit better.
Scroll down and enjoy the latest comprehensive weather to the max. Here's the latest weather..... occurring because of the natural physical laws in our atmosphere. When will we warm up?
Here are the latest hazards across the country.
Purple/Pink/blue on land is cold/Winter weather. Brown is wind, Green is flooding. Gray is fog. Reddish is a red flag advisory.
Go to the link below, then hit the location/county on the map for details.
https://www.spc.noaa.gov/ Go to "hazards"

Wind map Hit this with your cursor:


Wind map Press down on this on the left with your cursor!


Current Jet Stream

Winter Weather
https://www.wpc.ncep.noaa.gov/wwd/winter_wx.shtml

Snowfall the next 3 days:
Forecast Hour: 084
Image URL: http://mag.ncep.noaa.gov/data/nam/12/nam_namer_084_snodpth_chng.gif

| Low Temperatures Tomorrow Morning |

Highs for days 3-7:
The cold moderates late this week..


How do these days 3-7 temperatures compare to average at this time of year?
Lots of cold blues but they represent less intense cold blues from previous maps, which will continue to shrink and become less intense as March goes on.
https://www.wpc.ncep.noaa.gov/medr/medr_mean.shtml


Weather maps for days 3-7 below
Cold Arctic High pressure moderating. Pacific energy and weather systems make the scene late week and afterwards with some southern stream actions.
How much cold will be left for snow?

Liquid equivalent precip forecasts for the next 7 days are below.
California gets bombed with strong Pacific flow kicking in. Precip increases east of the Rockies, starting late this week.
Day 1 below:
http://www.wpc.ncep.noaa.gov/qpf/fill_94qwbg.gif?1526306199054

Day 2 below:
http://www.wpc.ncep.noaa.gov/qpf/fill_98qwbg.gif?1528293750112

Day 3 below
http://www.wpc.ncep.noaa.gov/qpf/fill_99qwbg.gif?1528293842764

Days 4-5 below:
http://www.wpc.ncep.noaa.gov/qpf/95ep48iwbg_fill.gif?1526306162

Days 6-7 below:
http://www.wpc.ncep.noaa.gov/qpf/97ep48iwbg_fill.gif?1526306162

7 Day Total precipitation below:
http://www.wpc.ncep.noaa.govcdx /qpf/p168i.gif?1530796126

Current Dew Points
Bone dry air Plains/Midwest.

Latest radar loop
http://www.nws.noaa.gov/radar_tab.php

| Full resolution version loop (3400x1700 pixels - 2.2mb) |

Go to: Most Recent Image
Precipitation the past 24 hours
![]()
You can go to this link to see precipitation totals from recent time periods:
https://water.weather.gov/precip/
Go to precipitation, then scroll down to pick a time frame. Hit states to get the borders to see locations better. Under products, you can hit "observed" or "Percent of normal"
+++++++++++++++++++++++++++++++++++++++++++++++
+++++++++++++++++++++++++++++++++++++
Precipitation compared to average for the last 7, 14, 30 and 60 days.
Usually not updated for previous day until late the next day.
https://www.atmos.illinois.edu/~snodgrss/Ag_Wx.html


The top map is the Canadian ensemble average, the maps below are the individual members that make up the average
+++++++++++++++++++++++++++++++++++++++++
Each member is like the parent, Canadian model operational model.......with a slight tweek/variation in parameters. Since we know the equations to represent the physics of the atmosphere in the models are not perfect, its useful to vary some of the equations that are uncertain(can make a difference) to see if it effects the outcome and how.
The average of all these variations(ensembles) often yields a better tool for forecasting. It's always more consistent. The individual operational model, like each individual ensemble member can vary greatly from run to run.........and represent an extreme end of the spectrum at times. The ensemble average of all the members, because it averages the extremes.............from opposite ends of the spectrum.........changes much less from run to run.
End of week 2....................0z ensembles from MONDAY:
Analysis starting from a week ago, ending with today:
Last Sunday: The average looks somewhat zonal but the individual solutions vary, with the ridge in the far Southeast, a long lived recent pattern, rebuilding. Also, troughing farther west may return.
Monday: A bit colder to me. Slightly more ridging in Alaska leads to a bit more high latitude flow in W.Canada southward, aimed towards a trough with a base somewhere in the US. Southeast ridge is weaker today. Less zonal look to the average but still several members have zonal, mild flow.
Tuesday: Alot of members have a trough in the vicinity of the Plains to just west but some are also farther east. Very cold air supply is cut off so the cold from Canada, will not be like the extreme cold coming early in week 2.
Wednesday: Very similar to yesterday. Big question remains.......how deep will the upper level trough be and where will it be located?
Thursday: The trough in the middle of the country is not as deep and on numerous solutions is in Southeast Canada and connected to some northern stream flow. The western 2/3rds of the US look to have more zonal, west to east Pacific flow.
Friday: The zonal west to east, mild Pacific flow, now across the entire country is almost universal....very strong agreement.
Saturday: VERY MILD. Zonal west to east Pacific flow.
Sunday: VERY MILD, zonal, west to east Pacific flow.
Monday: Still very mild, zonal Pacific flow. Some minor/subtle changes in the Northeast(from a few solutions) that might cause more troughing/cooling that need to be watched to see if they amount to anything down the road.
360h GZ 500 forecast valid on Mar 19, 2019 00 UTC


0Z GFS Ensembles at 2 weeks:
Analysis, starting with a week ago:
Last Sunday: Ridge in the far Southeast coming back on many solutions. Potential for upper level trough farther west, close to the recent position on a slight majority. Increased chances for warmth in the East, especially the Southeast.
Monday: Milder than the Canadian model because it lacks much northern stream and pretty big changes from run to run...........so uncertainty. Zonal type flow with across much of the country with many solutions having an upper level low in the West.
Tuesday: Trough in the Plains to west, potential ridging southeast to east favored. Lots of precip. Cold will be connected to the trough. Very mild southeast.
Wednesday: Similar to yesterday. Most solutions have a decent upper level ridge in the far Southeast.
Thursday: Will there be a ridge in the Southeast that extends northward from the southern stream or will there be an upper level low in Southeast Canada from the northern stream that has influence southward? The ridge wins on this model.
Friday: Cold air supply cut off. Mild west to east or even southwest to northeast steering currents. Possible weak intrusions of cold in the Northeast.
Saturday: Mild.
Sunday: The source for the bitter cold that we are currently experiencing is completely cut off. Cold fronts will not be that cold.
Monday: Unlike the Canadian ensembles, the GFS ensembles are more bullish with the northern stream. Some of them build a ridge/west, trough/east(downstream) couplet that would usher in the cold from Canada. This was mentioned on Sunday afternoon in a special update when it first started showing up............but that doesn't mean that it will happen. Just an interesting new development for what the models think(guess) will be happening in 2 weeks.

nsemble mean(average of all the individual solutions above)
Wednesday: Upper level low, north of the Great Lakes in the northern stream, has plenty of plenty of cold for the northern tier earlier in week 2.........but weakens on the product below.
The northern stream cold on this 0z solution overnight shows the cold air supply running out at the end of week 2.
However, heights are rebuilding from Alaska to Northwest Canada to the North Pole associated with an upper level ridge...........will that spell more cold in March, with a renewed supply of cold air?
Thursday: Looking MUCH milder(less cold) for 2 weeks out on this product, for the same forecast philosophy above.
Friday: By the end of week 2, all the cold blues that were present up to this period in previous days have vanished, which would be expected with yesterdays big changes and more zonal flow as discussed in the forecast philosophy then. But this is not etched in stone at 2 weeks because of great uncertainty then.
Saturday: Colder Plains, milder southeast.
Sunday: More of yesterday. Upper level ridging returns to the East/Southeast, with warmth. Upper level troughing Plains to West where is will be cold. Precipitation increases again at this end of week 2 period.
Monday: Coldest anomalies in the Plains, warmest in the Southeast to East as we get out to late week 2. Low confidence. Probably a lot of precip.
Tuesday: Same as yesterday. There is some modest upper level ridging in far Northwest Canada that might be able to connect to a northern stream aimed downstream and farther south IF there were amplification of the tough downstream but that's speculative. East looks mild.
Wednesday: Height anomalies growing in the East, favoring ridging, with mostly southern stream troughing farther west.
Thursday: Cold air supply completely cut off!!!
Friday: Cold air supply completely cut off!!! Mid March looks very mild.
Saturday: Same as previous days.
Monday: Upper level ridge building along the West Coast into Canada with troughing and coolingdownstream......at the end of 2 weeks. This is cooler for that period than the last several days. The Euro ensembles started this on Saturday Night and the Sun PM GFS ensembles caught on as noted on the special Weather Sunday update yesterday ahead of the natural gas open, then following it. This doesn't mean it will happen........just that a few more model solutions show it.........while others still do not.
NCEP Ensemble t = 360 hour forecast 
Latest, updated graph/forecast for AO and NAO here, including an explanation of how to interpret them.
Previous analysis, with the latest day at the bottom for late week 2 period.
Last Saturday: Positive AO and NAO, slight negative PNA not favorable for widespread cold to penetrate deeply in the the US.
Sunday: Noteworthy changes in these indices continue. AO now even more strongly positive.........unfavorable for cold to be transported from high latitudes to low latitudes. NAO is positive and PNA a bit negative, also not favorable for cold in the East. This makes cold air outbreaks late in week 2 and beyond to be less likely in the East.
Monday: More changes. The AO is still solidly positive(not good for cold) but dropping late now. The NAO stays positive, not good for cold in the East but the PNA, which is negative, increases toward zero late in week 2. Tomorrow will likely bring more changes.
Tuesday: AO is positive but falling during week 2 but still just above 0 at the end. NAO stays a bit positive. PNA is negative but almost gets back to 0 at the end. Nothing to use as a strong indicator at the end of week 2..........and these indices are best as indicators during the Winter............which is winding down.
Wednesday: AO now goes from very strongly positive in week 1 to plunging in week 2..........all the way back to 0 at the end of the period............opening the door for slightly better chances of cold going from higher to mid latitudes. NAO stays slightly positive(makes it tough for cold to penetrate very far south along the East Coast. PNA increases back to 0 in week 2. Still not anything powerful.
Thursday: AO which is strongly positive.............as previously, drops in week 2 and is close to zero at the end. NAO stays a bit positive, PNA close to 0 at the end of 2 weeks. Nothing substantive to provide a clue on the pattern for later in March.
Friday: AO which is strongly positive .................similar to yesterday drops close to zero at the end of 2 weeks. NAO slightly positive, PNA a bit negative going to near zero at the end of 2 weeks. Nothing big.
Sunday: AO slowly drops from a stout positive to near 0 at the end of week 2. NAO slightly positive, PNA around 0. Nothing substantive, except to say that extreme cold outbreaks are not likely.
Monday: AO drops faster in week 2, now with numerous solutions solidly negative..........increasing chances for cold in the high latitudes to be transported towards the mid latitudes during the 2nd part of March. However, the very wide spread indicated uncertainty/low confidence. NAO has increasing spread and uncertainty on both sides of zero. PNA too but the trend for the PNA is up and most solutions are now positive at the end of 2 weeks vs previously around zero. This has also elevated the chances for cold to penetrate south vs the last few days using these indices.
The link below, now has the PNA index added at the bottom:
National Weather Service 6-10 day, 8-14 day outlooks.
Updated this afternoon:
As expected, these maps have started warming up late in this period in the Southeast. The warming should continue on these maps the next numerous days.
Monday update: Late week 2 and beyond uncertainty prevails today.
Temperature Probability | |
Precipitation Probability | |
| the 8-14 day outlooks ArchivesAnalogsLines-Only FormatGIS Data | |
Temperature Probability | |
 | |
Previous posts:
Re: Re: Re: Re: Weather Saturday
By wxgrant - March 2, 2019, 12:37 p.m.
The EURO Ensembles really warm up the Southeast next weekend and then all of Canada and the eastern seaboard the following week. The GFS warms as well but not as much as the EURO.
++++++++++++++++++++++
By mikempt - March 2, 2019, 2:51 p.m.
Thurs evening into Friday we had four inches of snow here in Valley forge. We had sleet and freezing rain Friday night. Its cold and gray here today,more snow tomorrow evening!
Email: meteormike@msn.com | IP Address: None | Cookie ID: None
0 likes
By metmike - March 3, 2019, 10:14 a.m.
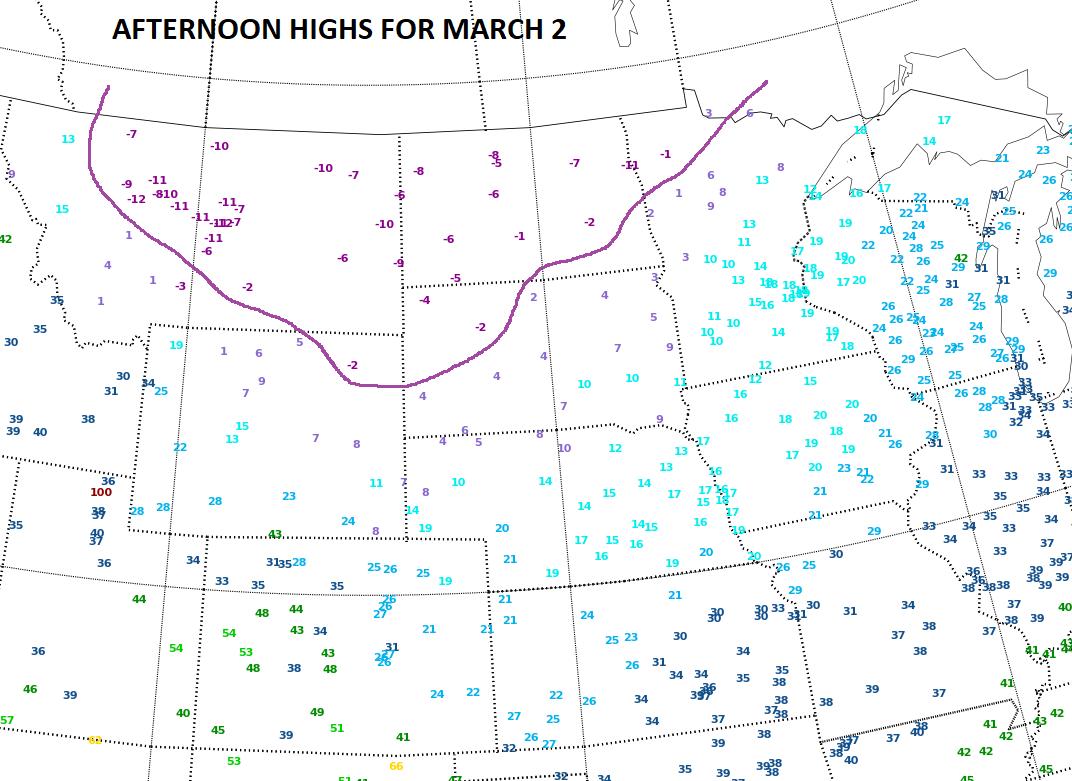
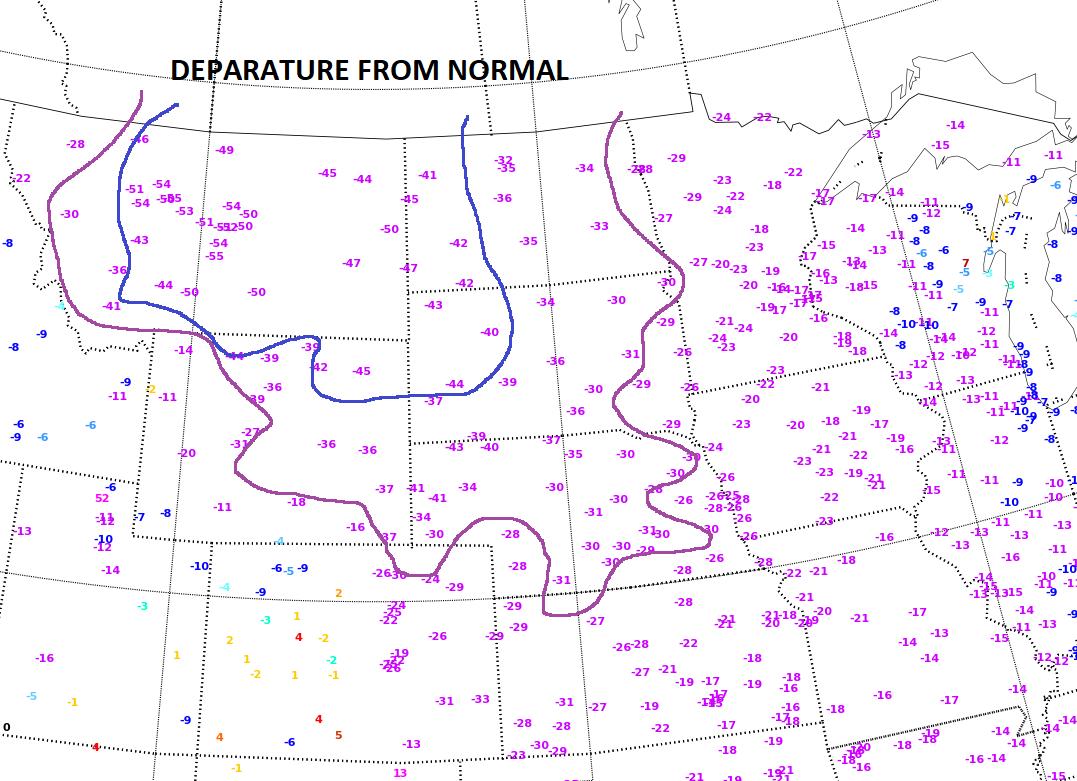
Afternoon highs yesterday and their departure from normal for the northern Plains HUGE are seeing temperatures 30+, 40+, even 50+ degrees below normal "Stupid" cold for any time of year...but especially for March 2
++++++++++++++++++++++++++++++++++++++++++++++++++
By WxFollower - March 3, 2019, 3:24 p.m.
There's a serious tornado threat ongoing as I type this in parts of south-central AL eastward into central GA in places in or near locations such as Montgomery, AL, and Macon, GA! Several tornadoes have at least been radar suggested, including at least one large one!
+++++++++++++++++++++++++++++++++++++++++++++
By metmike - March 3, 2019, 3:36 p.m.
Thanks Larry!

++++++++++++++++++++++++++++++++++++++
By metmike - March 3, 2019, 4:07 p.m.
Special Weather update:
An interesting change during the late week 2 period is the Euro ensembles want to build some ridging in the West with downstream troughing and cooling. They've shown this for the past 2 model runs.
The last 12z operational GFS is never to be trusted in week 2 but it has an extreme version, with high latitude, upper level ridging/blocking and a deep low underneath that which tracks across the northern tier and is in the East at the end of the period.
This, however is NOT an outlier. The ensemble mean is mild but misleading. Around half the solutions try to build a ridge/west, trough downstream couplet late in week 2, similar to the European model ensembles. This would cause the East and Midwest to be colder than most of the runs for the last few days have suggested as we hit 2 weeks out.
This is a new development but still just something to watch to see if it continues...........or reverts back to a continuation of mild flow.
The solutions below are day 15, which is at 384 hours....for the last 12z GFS ensembles


