Only 4 days until Christmas! Just another day? Do something special for somebody today. Seriously, don't just think about it for a moment......do it now.
Scroll down and enjoy the latest comprehensive weather to the max. Mild weather pattern. Big Winter storm in the middle of the country in the middle of next week. Very active and changeable starting then. Heavry snow is back in the picture on the cold side of the storms.
Here are the latest hazards across the country.
Purple/Pink/blue is cold/Winter weather. Brown is wind, Green is flooding. Gray is fog. Reddish is a red flag advisory.
Go to the link below, then hit the location/county on the map for details.
https://www.spc.noaa.gov/ Go to "hazards"

Winter Weather
https://www.wpc.ncep.noaa.gov/wwd/winter_wx.shtml

Snowfall the next 3 days from the NAM model
Forecast Hour: 069
Image URL: http://mag.ncep.noaa.gov/data/nam/12/nam_namer_069_snodpth_chng.gif

| Low Temperatures Tomorrow Morning |

High Temperatures today and tomorrow.
Remaining MILD for this time of year-mid December!


Highs for days 3-7:
Warming up south and east, cooling off northcentral to points west.
Major temperatures disparity/contrast from northwest to southeast.


How do these days 3-7 temperatures compare to average at this time of year?
Above average everywhere but the warmth shifts farther southeast than where is has been located.

The latest liquid equivalent precip forecasts for the next week are below.
More active, starting in the middle of next week. Snow in the colder air.....northwest part of storms for the next 2 weeks.
Day 1 below:
http://www.wpc.ncep.noaa.gov/qpf/fill_94qwbg.gif?1526306199054

Day 2 below:
http://www.wpc.ncep.noaa.gov/qpf/fill_98qwbg.gif?1528293750112

Day 3 below
http://www.wpc.ncep.noaa.gov/qpf/fill_99qwbg.gif?1528293842764

Days 4-5 below:
http://www.wpc.ncep.noaa.gov/qpf/95ep48iwbg_fill.gif?1526306162

Days 6-7 below:
http://www.wpc.ncep.noaa.gov/qpf/97ep48iwbg_fill.gif?1526306162

7 Day Total precipitation below:
http://www.wpc.ncep.noaa.govcdx /qpf/p168i.gif?1530796126

Current Dew Points
Moisture in the eastern 1/3rd. Very dry to the west.

Latest radar loop
http://www.nws.noaa.gov/radar_tab.php

| Full resolution version loop (3400x1700 pixels - 2.2mb) |

Go to: Most Recent Image
Precipitation the past 24 hours
![]()
You can go to this link to see precipitation totals from recent time periods:
https://water.weather.gov/precip/
Go to precipitation, then scroll down to pick a time frame. Hit states to get the borders to see locations better. Under products, you can hit "observed" or "Percent of normal"
+++++++++++++++++++++++++++++++++++++++++++++++
Soil moisture anomaly:
Still wet on this particular metric in an enormous area.

+++++++++++++++++++++++++++++++++++++
Precipitation compared to average for the last 7, 14, 30 and 60 days.
Usually not updated for previous day until late the next day.
https://www.atmos.illinois.edu/~snodgrss/Ag_Wx.html


The top map is the Canadian ensemble average, the maps below are the individual members that make up the average
End of week 2....................0Z ensembles from FRIDAY:
Last week progressing to today:
Last Saturday: Majority remain mild but several members on this model won't give up the idea of the polar vortex shifting south/northern stream bringing down frigid air, which will be getting charged up in Canada during week 2.
Sunday: Colder solution than yesterday(which was pretty mild). Much agreement on cross polar flow and Canada getting charged up with bitterly cold air. The question is how much of that, if any will be delivered across the border and where will the intrusions be?
Monday: Mllder than yesterdays solutions. Not the numerous members with the northern stream plunging south like Sunday. Very cold in Canada however, and some of that gets south of the border.
Tuesday: Similar to Monday. A mix of mild and a few brutally cold members.
Wednesday: Colder than the last 2 days but the Canadian model has been the worst performer and too cold recently. This run has some extremely cold solutions.
Thursday: Very close to yesterdays solution. You can hardly tell them apart.
Friday: Not as cold as yesterday. More zonal average. Still some very cold members.
++++++++++++++++++++++++++++++++++++++++++++++++++++++++++++++
Each member is like the parent, Canadian model operational model.......with a slight tweek/variation in parameters. Since we know the equations to represent the physics of the atmosphere in the models are not perfect, its useful to vary some of the equations that are uncertain(can make a difference) to see if it effects the outcome and how.
The average of all these variations(ensembles) often yields a better tool for forecasting. It's always more consistent. The individual operational model, like each individual ensemble member can vary greatly from run to run.........and represent an extreme end of the spectrum at times. The ensemble average of all the members, because it averages the extremes.............from opposite ends of the spectrum.........changes much less from run to run.
360h GZ 500 forecast valid on Jan 05, 2019 00 UTC


0Z GFS Ensembles
Last week progressing to today:
Last Saturday: Mild solutions have the vast majority.
Sunday: The milds win, mainly because a southern stream upper level trough is far enough west to bring warm moist air eastward. Not much northern stream, that the Canadian model is gung ho on with numerous members/solutions.
Monday: The milds win again...........especially warm in the Southeast and wet for much of the country...............snowy in the colder air in the Plains/Upper Midwest.
Tuesday: Mild majority but several strengthen the northern stream now, which might come into play just beyond 2 weeks.
Wednesday: Mild majority still. Even less northern stream than yesterday.
Thursday: Still more mild members than not but the northern stream cold air has a bit more southerly push on than yesterday.
Friday: Mild and cold members evenly split.

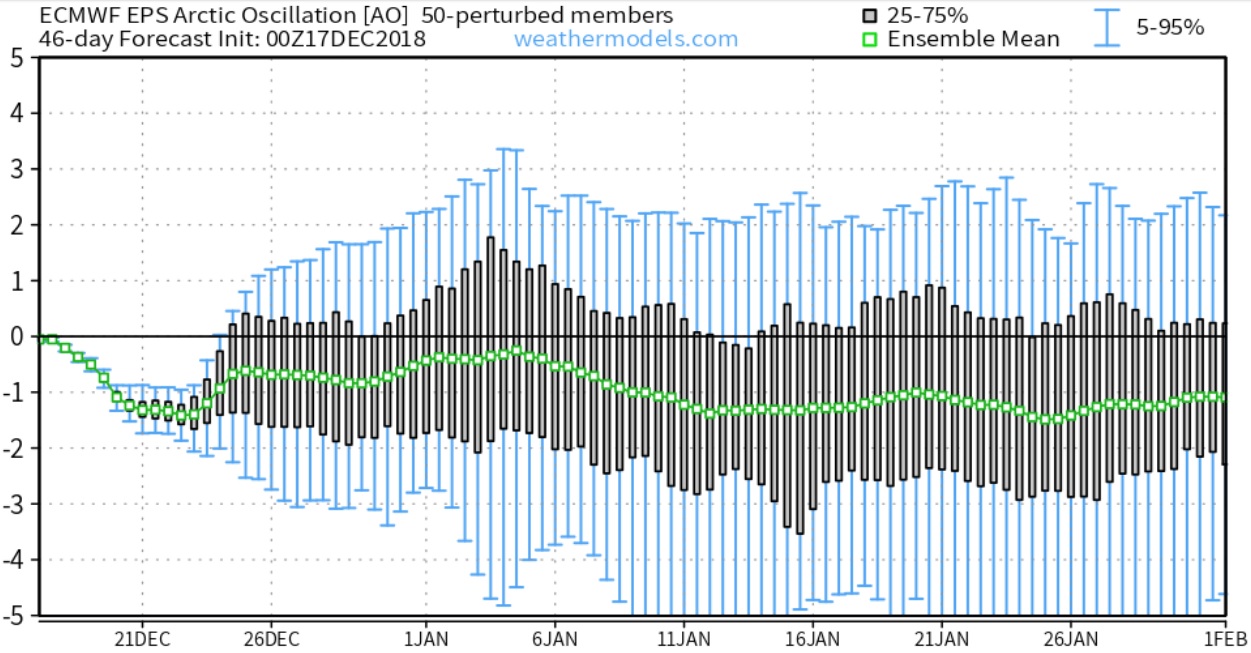
Latest, updated graph/forecast for AO and NAO here, including an explanation of how to interpret them.
Last week at the top, progressing to today:
Last Saturday: AO a bit negative. NAO is positive. Flow pattern thru late week 2 is generally unfavorable for cold air to work south. Most models have a mild, zonal flow.
Sunday: Tiny changes since Saturday. AO close to zero but a few negative and one outlier strongly negative. Probably not worth noting, except for the fact that this is what we might look for(if there was more support than outliers) if the pattern was going to morph to much colder at the end of the month.
Monday: AO is negative which favors cold air making it south. NAO is a bit positive which favors milder weather along the East Coast and for the cold air entry point to be farther west(Plains and westward)
Tuesday: AO is a bit more negative, increasing odds of cold going south in January. NAO is near 0.
Wednesday: AO is not as negative, less threat for extreme cold in 2 weeks.
Thursday: AO close to zero with an extreme outlier very negative. NAO is actually lower today with chances of the cold reaching the Northeast in 2 weeks increasing.
Friday: AO is more negative today(better chance for cold to move from high to mid latitudes) with a very wide spread. The NAO is much more negative by then end of week 2, suggesting the new entry point for cold will be towards the Northeast US.
https://www.marketforum.com/forum/topic/15793/
National Weather Service 6-10 day, 8-14 day outlooks.
Updated early this afternoon.
Temperature Probability | |
Precipitation Probability | |
| the 8-14 day outlooks ArchivesAnalogsLines-Only FormatGIS Data | |
Temperature Probability | |
 | |
Previous posts:
By cliff-e - Dec. 15, 2018, 3:32 p.m.
Very mild and warm for us in W.Mn with temps. In upper 30s to mid 40s for a few days and a few more to come. We've seen people in boats on rivers enjoying some fishing and also on shore angling when usually there is ice fishing by now. Winter sports enthusiasts are disappointed but we know the weather can turn on a dime so we'll just enjoy it for now. :-)
++++++++++++++++++++++++++++++++++++++++++++++++++++
By metmike - Dec. 15, 2018, 4:09 p.m.
Thanks cliff!
Temperatures compared to average are some of the mildest in your neck of the woods.
++++++++++++++++++++++++++++++
By WxFollower - Dec. 15, 2018, 9:20 p.m.
Mike,
Thanks very much for doing these daily updates!
++++++++++++++++++++++++++++
By metmike - Dec. 15, 2018, 11:30 p.m.
YW Larry!
Thank YOU for all your valuable contributions.
By metmike - Dec. 17, 2018, 6:29 p.m.
The European 30 day forecast came out very late this afternoon and is lending some support to natural gas prices with it frigid maps for early January.
This product does not have a lot of skill but lately the market has traded off of it because the ng in storage is at 15 year lows:
The first map is late on New Years Day, then every 24 hours after that:
MAPS WERE ALL UPDATED ON DECEMBER 20 and don't correspond to the discussion above any longer.
+++++++++++++++++++++++++++++++++++++++++++++++
By WxFollower - Dec. 17, 2018, 7:39 p.m.
Yeah, Mike, a 3 cent gap up likely influenced by this is also my guess. Of course, it was extra primed to bounce on anything after such a huge drop the last week. Weeks 3-5 are sig colder while week 6 is slightly colder than the prior run. It is like a reversal of the last run's much warmer run and shows how low the skill is with every week changing heavily. The next run could easily reverse again. However, based on it being a weakish El Nino and assuming the MJO will likely be coming around into the colder phases by mid-Jan, I actually think this newest Euro weeklies is on the right track though it will probably be a rather slow transition. Week 3, though colder than the prior run, is still warm in the E 1/3 of the US though not nearly as warm as week 2. Week 4 is near normal for most of the US though it was very warm on the prior run and it is coolest SE. Week 5 is the coldest of the 6 weeks with a few degrees below normal in the E US but centered on the SE US, consistent with El Nino climo. Week 6 averages near normal in the E US but is slightly colder than normal SE. Overall, it appears the real pattern change to colder for the E US would occur ~1/10 based on this run.
++++++++++++++++++++++++++++++++++++++++++++++++++++++
By wxgrant - Dec. 17, 2018, 10:28 p.m.
If this is correct there will be a very good chance of below average temperatures during January. I know it is a 46 day ensemble but this seemed to do well during November. It was our 3rd coldest November on record in Cape. The Ensemble NAO shows a negative pattern all month as well.
++++++++++++++++++++++++++++++++++++++++++++++++++++++++++++++
By metmike - Dec. 17, 2018, 11:50 p.m.
Thanks much Grant!
Sustained -AO for the entire month of January (and -NAO based on your comment) with some pretty frigid air built up in the higher latitudes will provide the potential for a very cold January.
If this comes to pass, then natural gas is a buy here.............if it starts showing up on 2 week model forecasts.
If 2 week maps continue to hold off the cold, then we can still go lower......until major cold, at the very least starts showing up in that part of the forecast.
++++++++++++++++++++++++++++++++++++++++++++
By metmike - Dec. 20, 2018, 6:39 p.m.
The new European model 30 day outlook came out today(its updated on Mon and Thu, late afternoons).
Still has some major cold hitting to start the new year and another wave after that.
However the real frigid air does not penetrate very far south. The real cold air will be aimed farther east in the US with time(on this model).
The first wave hits the N.Plains, then after that the next 2, later in January will hit the Great Lakes and Northeast.
Maps below start on January 1st and continue every 24 hours thru Jan 19th.
The GFS ensembles was the much milder model and European ensembles the colder one later in week 2 but they have completely flipped.
The 12z GFS is the colder one and the 12z European ensembles much milder than the previous solution.
The Canadian ensemble model was colder at 12z during the 11-15 day period.
Extreme weather next week.
Huge precip event for a few days after Christmas.
"Speculative" Week 3 and 4 forecast.
The pattern shifts and the cold is in the south and east, effecting some high population centers. In addition, there will be an "El Nino" storm track in the Southeast, possibly up the coast. In the colder air, this could lead to some heavy snows.
http://www.cpc.ncep.noaa.gov/products/predictions/WK34/
Temperature Probability | Precipitation Probability (Experimental)  |
