The NASDAQ suffered it's 3rd worst point drop and 10th worst % drop in history. Today's drop the equivalent of 1100 pts on the Dow. Today's drop worse than the one 2 weeks ago and the ones this past Feb. The Dow and the other averages weren't (relatively) quite as bad, but bad enough. The S&P took out its 2700 "support level" with a vengeance.
Where's Jean N and her prediction of 6500 on the Dow?
First - any comments are merely guesses.
But, I have to think this is a normal four year (election) cycle correction. The timing is perfect, as 2018 is the perfect time for this cycle to come back into phase - after gyrations in recent years. An argument for this to be the four year cycle is interest rates - the central bankers appear to be trying to cover their rears, don't they? Notice, when the cycle could not put in a normal cycle correction low in 1986 how it reverted right back into normal phase when the next low was due.
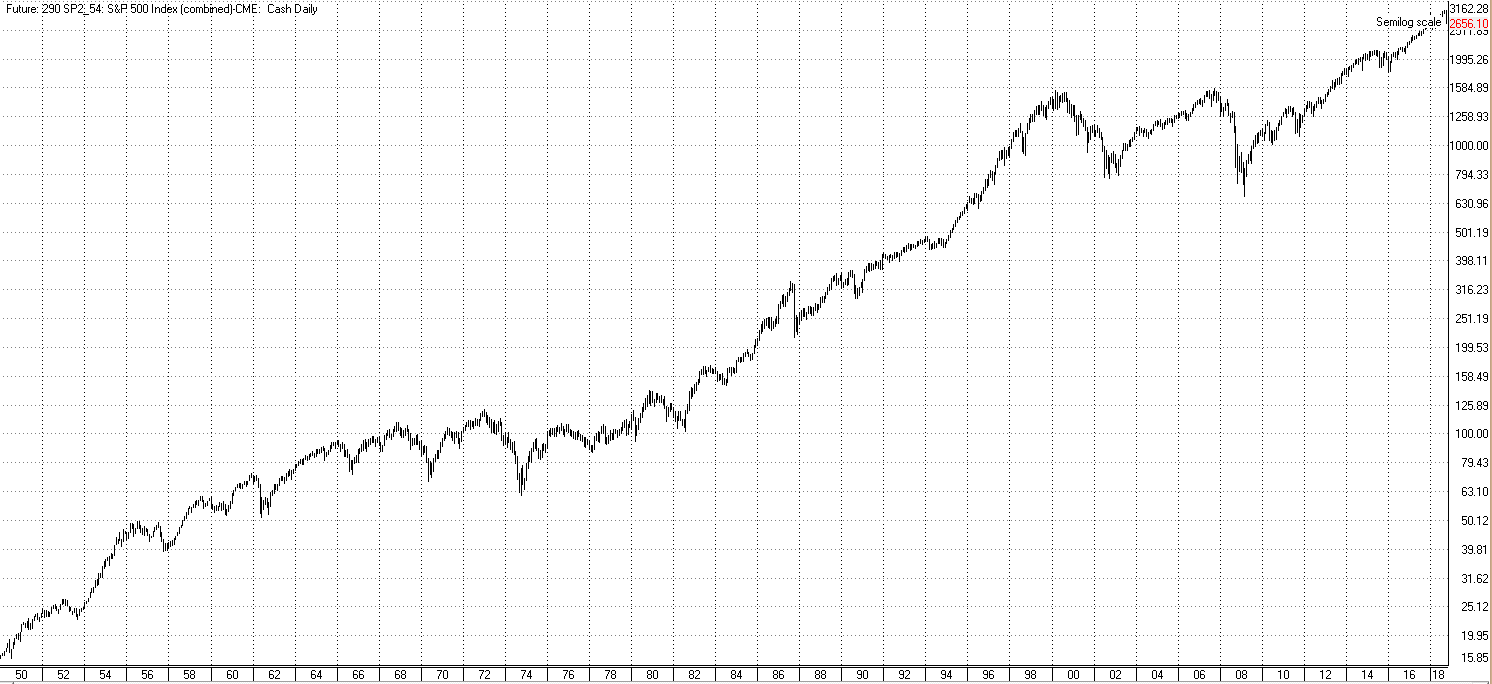
This is the S&P500 cash since 1950. Notice how regular the cycles are. Also notice how (so far) mild this correction has been.
This is plotted in semilog scale - the only way, IMHO, to look at this correction compared to previous ones.
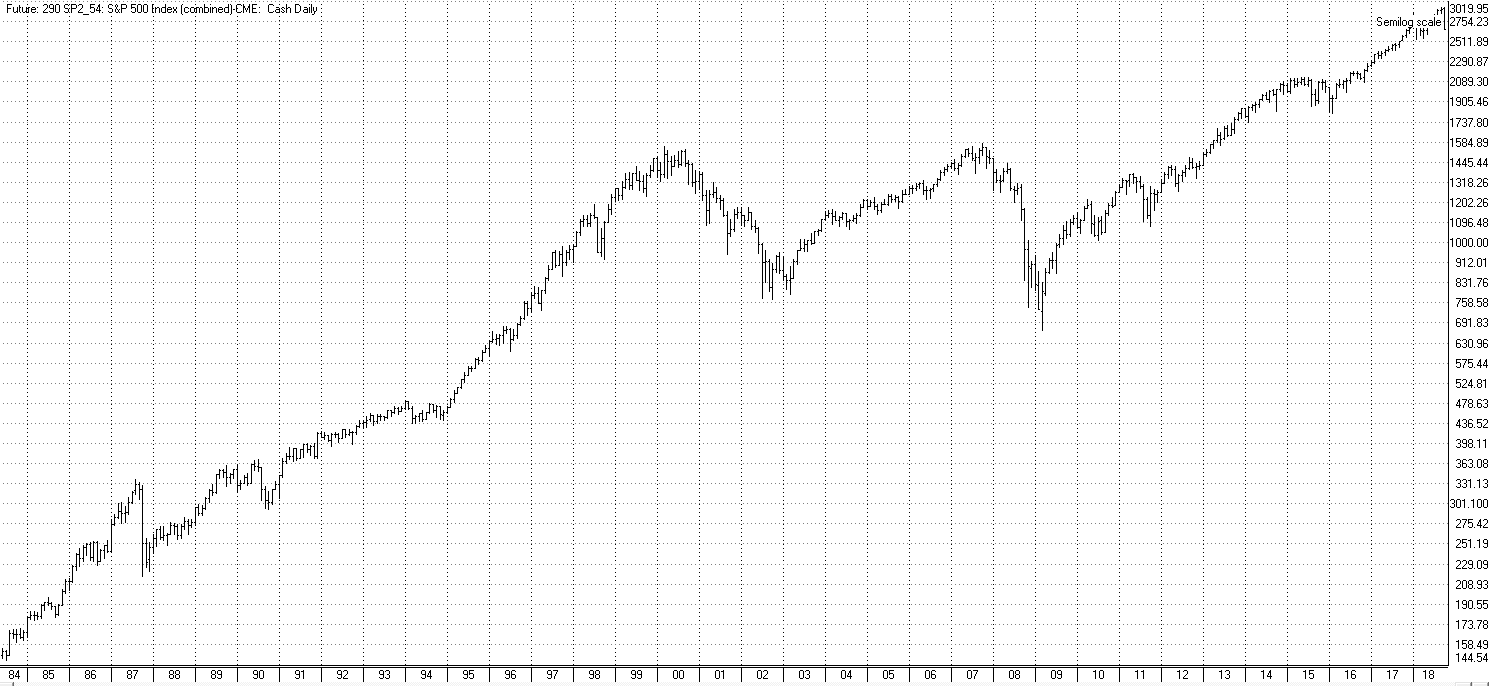
Here is the same chart, but zoomed in to 1984 - 2018. (Compare it to the 87 crash.)
One more - zoomed to 1996 to 2018.
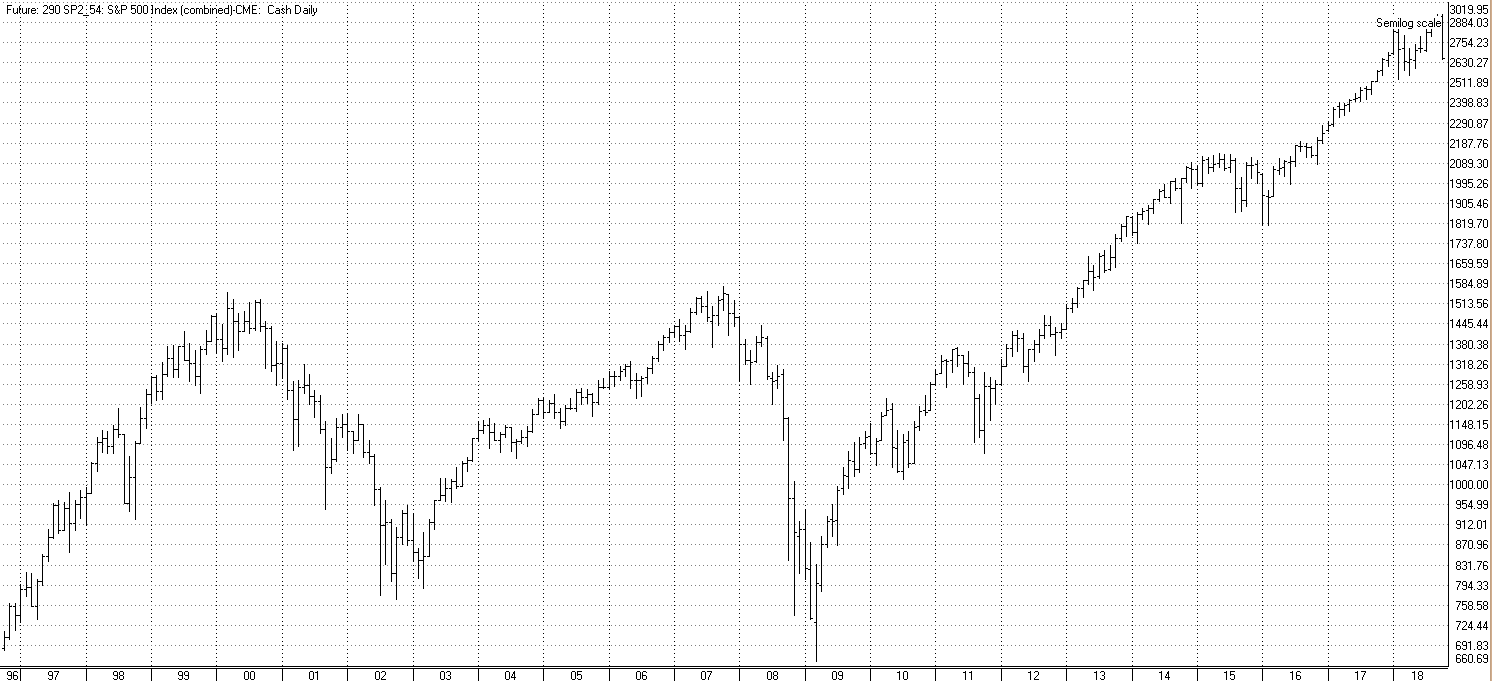
Looks pretty minor so far.
Charts look pretty bad quality - but if you open them in a new window or tab, they look ok.
Hard for me to see the 4-yr cycle you see particularly after 2006? Maybe this is what you're talking about with the "gyrations in recent years"?
Yup so far "mild". Not predicting this one will be anything like '08-'09 or even '01-'02, but (obviously) every sizable correction starts off looking mild.
Yes, with the big move into early 2009, the cycle was disrupted. If you look at when the cycle should have bottomed in 06, it looks very much like the low in 86. The psychology was just too bullish for a "normal" cycle low. Back then, it "couldn't wait" for a decent correction - and the enthusiasm pushed it up into new highs - and the crash came in 87. This past 2006 was similar, with a token low followed by the new highs and a crash into early 2009. Back to the low in 87 again - you can see that the cycle reverted immediately into its normal phasing following that crash. Should we expect something similar now? Who knows, but it sure looks likely with this action just when the cycle low is due - and with the FED raising rates.
Of course, this could be the start of a major bear - but - at this point I think we need to assume the simplest - that this could very well be the normal corrective low the market needs to remain healthy. A market that does not have normal corrective moves soon becomes a very unhealthy market.
James Gleick talks about cycles in a chaotic system in his excellent book "CHAOS: The Making of a New Science." What is so interesting is that in the chapter "The Experimenter" he was describing the behavior of a small tube of liquid helium with a tiny heater under it. The market cycles I have studied for so long behave exactly the same way as that cylinder of helium. This appears to be one of the cycles that can disappear for a bit - but come back strong time and time again. Of course, it appears to have a driver in the FED too - not wanting to apply the brakes ahead of major elections - so they apply them in the off years.