It's September 26th. Do something special for somebody to remember today! Seriously, don't just think about it for a moment......do it.
Scroll down and enjoy the latest comprehensive weather to the max!!
The latest rain forecasts for the next week are below. Mostly dry for a couple of days. Rains increase in the Upper Midwest late this week.
Day 1 below:
http://www.wpc.ncep.noaa.gov/qpf/fill_94qwbg.gif?1526306199054

Day 2 below:
http://www.wpc.ncep.noaa.gov/qpf/fill_98qwbg.gif?1528293750112

Day 3 below:
http://www.wpc.ncep.noaa.gov/qpf/fill_99qwbg.gif?1528293842764

Days 4-5 below:
http://www.wpc.ncep.noaa.gov/qpf/95ep48iwbg_fill.gif?1526306162

Days 6-7 below:
http://www.wpc.ncep.noaa.gov/qpf/97ep48iwbg_fill.gif?1526306162

7 Day Total precipitation below:
http://www.wpc.ncep.noaa.govcdx /qpf/p168i.gif?1530796126

Excessive Rain threat
Moving east then out the next day..........until the next system in the Upper Midwest over the weekend.
Current Day 1 Forecast
Day 1 Threat Area in Text Format
Current Day 2 Forecast |
Day 3 forecast below

Severe Storm Risk.
Northeast on Wednesday, then getting quiet.
https://www.spc.noaa.gov/products/outlook/
Current Day 1 Outlook | |
Current Day 2 Outlook | |
Current Day 3 Outlook | |
Current Day 4-8 Outlook |
High Temperatures today and Thursday
Cool air pushes southeast......stays very warm far southeast.


Highs days 3-7.
Very warm in the South but chilly to cold air in the North. Warmth battles back. The warmth may win the battle this period in the East. CDD's from heat still in the southeast. But most significant HDD's of the season in the north. This is what rallied natural gas last week and Monday.


How do these days 3-7 temperatures compare to average at this time of year?
Above average Southeast. Well below normal N.Plains.
Huge contrast between cold blue anomalies N.Plains and very warm red anomalies southeast. Residential heating in the N.Plains/Upper Midwest/ blue, Residential cooling in Southeast. This has been bullish for natural gas for the past week+ because of the extreme temperature departures:

Low Temperature Departures:

Surface features for the same 3-7 day period:
Initially strong cold fronts coming from Canada, moving southeast and stalling/dying (as they encounter a stout and building upper level ridge), that trigger rains.......more rain as they encounter higher moisture and slow down.

Dew points.
70+ on this scale makes it feel uncomfortable(sticky air)!
Higher dew points are being swept away today by the big cold front.
Much, MUCH drier air coming in behind the front.

Current Surface features:
Strong system with its cold front is racing east/southeast. Big Canadian High Pressure behind it.
https://weather.com/maps/currentusweather

Satellite picture.

Rains the past 24 hours.
Plenty of it.
![]()
You can go to this link to see rain totals from recent time periods:
https://water.weather.gov/precip/
Go to precipitation, then scroll down to pick a time frame. Hit states to get the borders to see locations better. Under products, you can hit "observed" or "Percent of normal"
Soil moisture anomaly:
Too wet in a large area from one of our wettest Septembers in history!
The 2nd map gets updated once a week.


Rains compared to average for the last 7, 14, 30 and 60 days.
Usually not updated for previous day until late the next day.
Note how wet it's been over the past 60 days over eastern 2/3rds of the country!
https://www.atmos.illinois.edu/~snodgrss/Ag_Wx.html


The top map is the Canadian ensemble average, the maps below are the individual members that make up the average
End of week 2....................0Z ensembles from Wednesday. There will be a deep upper level low/trough in Canada with widespread cold extending south into the northern parts of the US. There still is pretty UNIVERSAL agreement for this product that the trough will take over in the Central US.........but some members today have the upper level ridge in the far Southeast trying to hold on! In addition, there is a more zonal, west to east component to the air in the northern states at the end of the period which may start to erode the cold eventually.
++++++++++++++++++++++++++++++++++++++++++++++++++++++++++++++
Each member is like the parent, Canadian model operational model.......with a slight tweek/variation in parameters. Since we know the equations to represent the physics of the atmosphere in the models are not perfect, its useful to vary some of the equations that are uncertain(can make a difference) to see if it effects the outcome and how.
The average of all these variations(ensembles) often yields a better tool for forecasting. It's always more consistent. The individual operational model, like each individual ensemble member can vary greatly from run to run.........and represent an extreme end of the spectrum at times. The ensemble average of all the members, because it averages the extremes.............from opposite ends of the spectrum............changes much less from run to run.
384h GZ 500 forecast valid on Oct 12, 2018 00 UTC


Temperature Anomalies from GFS ensembles(fairly reliable product) going out 2 weeks. These maps show the Northern Hemisphere. The map of the US is front center. Look for the state borders in white.
Today: Cool surge spreads southeast. 
In 5+ days:
Heat ridge builds back in from the southeast and dams up the lions share of cold along the Canadian border and north.
In 10+ days:
Chilly air is released? How quickly will is dive south, how much will dive south?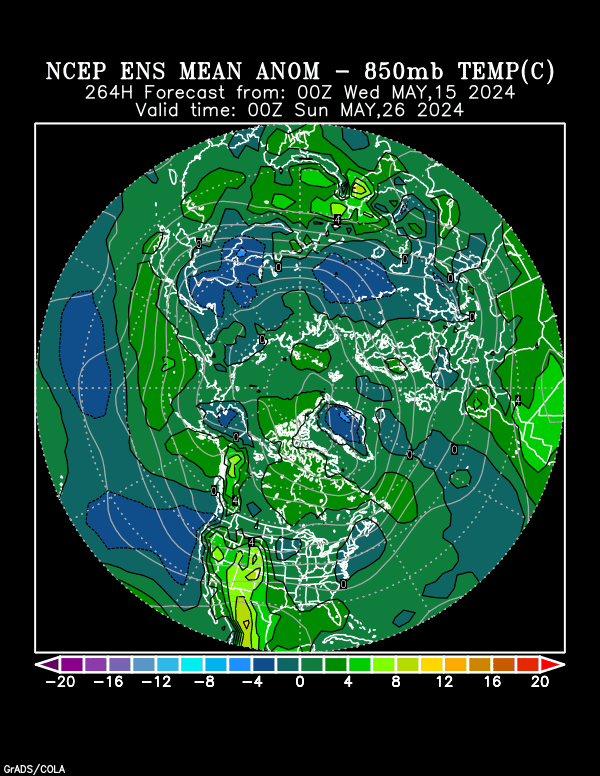
Day 15: Cold anomalies greatest N.Plains/Upper Midwest. How far southeast will they be? The latest guidance still has some support for an upper level ridge in the far southeast.
The low skill, longer range CFS model for weeks 3-4.
Extreme Upper level ridging Alaska to West Coast has been a constant for the past week as well as the downstream cold air in Canada that gets into the Northern US. Todays run shows that this may be weakening. Also, the cold in Canada will be running out/modifying with time.......... in week 4, the cold pattern has run its course.
Precip is very uncertain.
Heating degree days(from cold weather) are replacing cooling degree days(from hot weather) as being the most important as we get into October.
Check in tomorrow to read something different............."low skill" (-:

Precip below:

12z Canadian ensembles for the end of week 2 have a much more zonal, west to east flow which would be much milder vs the meridional/extreme in temps.
Less cold in the north, less heat in the south.
360h GZ 500 forecast valid on Oct 11, 2018 12UTC


National Weather Service 6-10 day, 8-14 day outlooks.
The forecasts below are similar to the last 10 days or so. Cold Northern Plains, very warm Southeast and wet everywhere.
However, the weather models to me look to be moving in the direction of a pattern change later in week 2 that features less meriodional(north to south/south to north) flow and becoming more zonal with milder Pacific air masses spreading from west to east across the country.
This would result in potentially less cold and less heat.......but this is at a period of time with low confidence. Also the jet stream may still be fairly active............so wet weather could continue.
Temperature Probability | |
Precipitation Probability | |
| the 8-14 day outlooks ArchivesAnalogsLines-Only FormatGIS Data | |
Temperature Probability | |
Precipitation Probability | |
Extreme weather days 3-7
Heavy rain and cold this weekend into early next week. This has been on weather models for over a week now.

Speculative heavy rain events in the 8-14 day period.........on top of Iowa.

