
This post demonstrates how to use the weather in order to position yourself in the natural gas market as a speculator to make money.
It's NOT easy!!!!!!!!!!
The natural gas market will do its best, with wild gyrations/swings up and down from big traders using algoriths to stop you out or throw you off.
1 outlier model solution can come out and cause a knee jerk reaction of thousands/contract, then reverse that on the next run.
Re: Re: Re: Re: Natural gas 9-19-26
By metmike - Oct. 22, 2026, 2:04 p.m.
Slightly bullish EIA # compared to the forecast but the temperature forecast remains extremely bearish. The blue line on the graph below that had been comfortably above the 5 year average, thanks to our mild 2026 Spring, has been eroded by late Summer/early Fall heat which caused it to converge with the 5 year average. Storage is now just +35 Bcf vs the 5 year average and -152 Bcf vs last year.
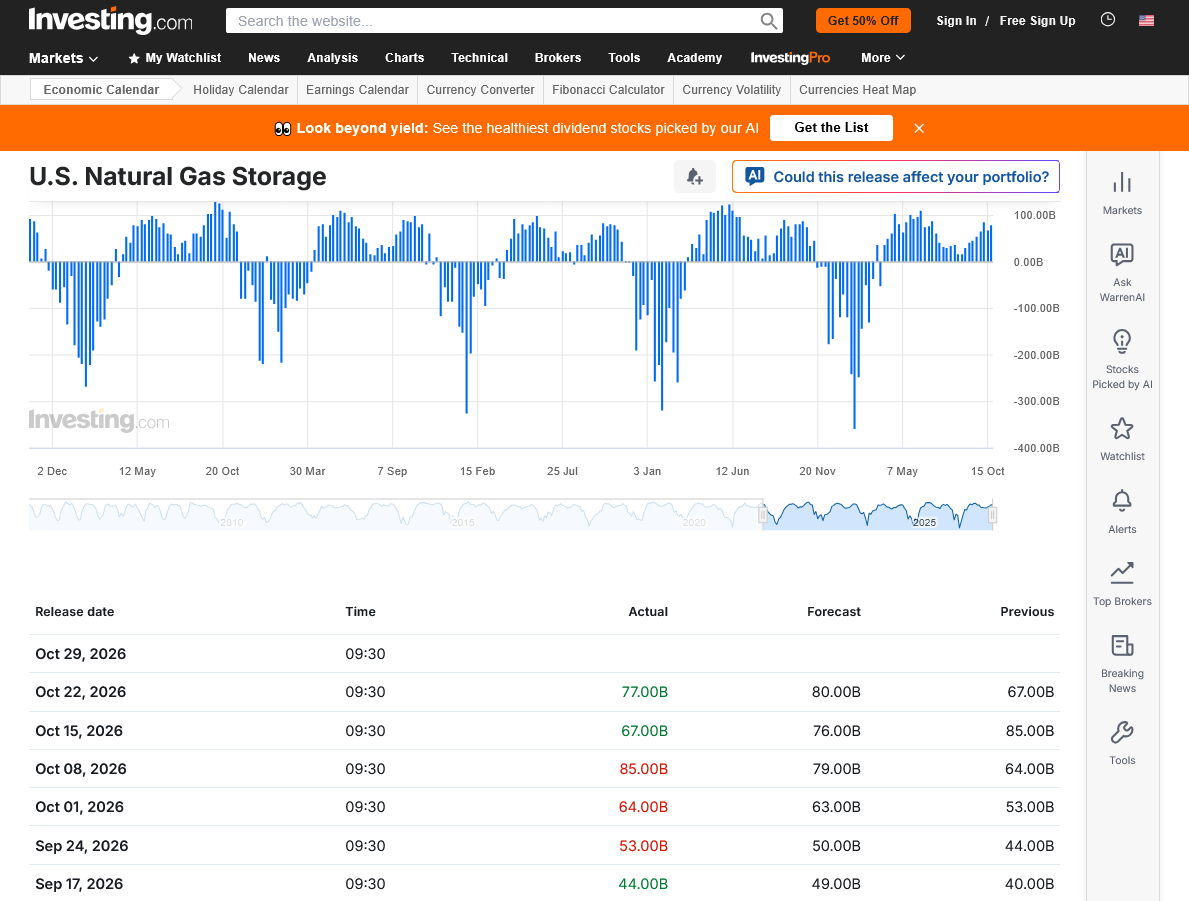
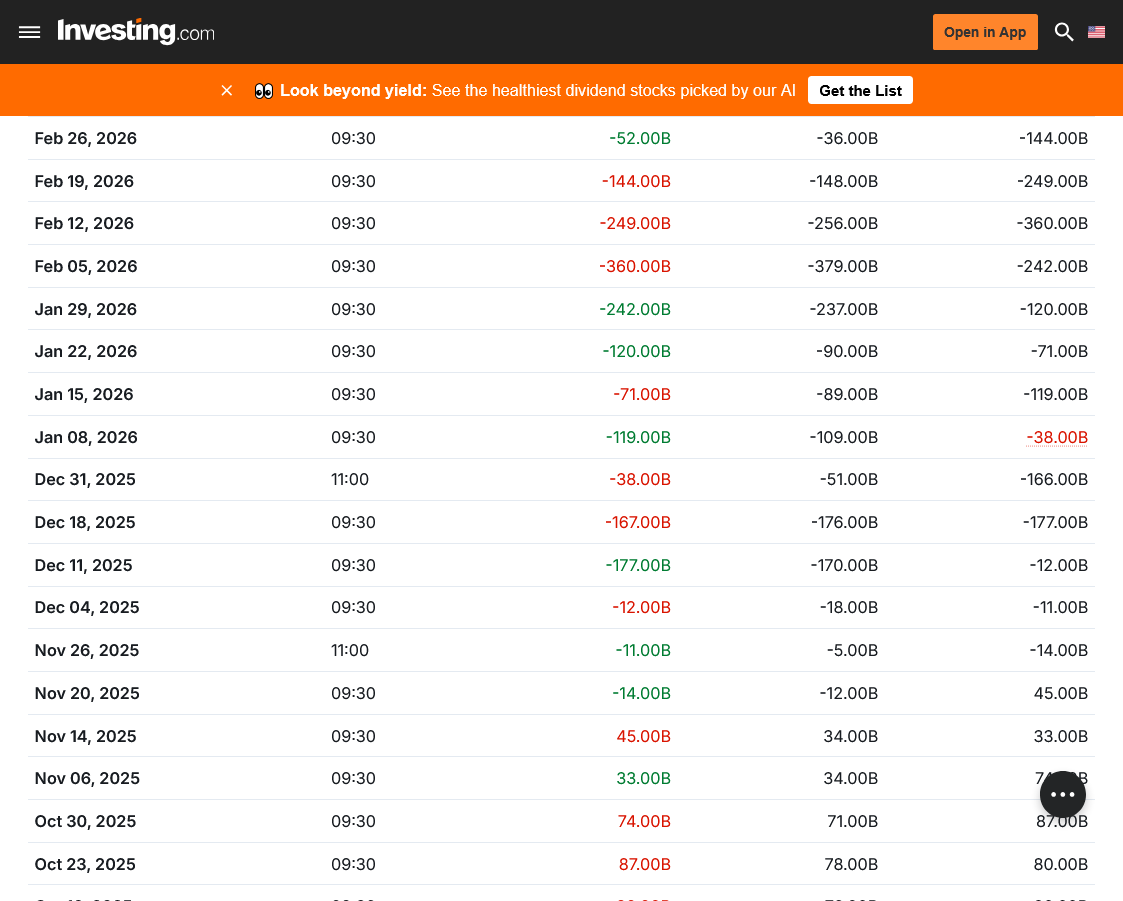
At the bottom of this post, I copied the EIA numbers for the next 18 reports issued on Thursday's at 9:30am to use for comparing the upcoming numbers with last years numbers. Next week, for instance we will be comparing it with the +74 Bcf injection for the same week in 2025.
Thanks to the upcoming mild weather coming up, that blue line should again establish a greater surplus(with the 5 year average) with a steeper upslope to the injections for numerous upcoming weeks. It will take along time to catch up to the levels of last year at this time. Considering the HUGE December 2025 drawdowns, we could could do it in December 2026!

for week ending October 16, 2026 | Released: October 22, 2026 at 10:30 a.m. | Next Release: October 29, 2026
| Working gas in underground storage, Lower 48 states Summary textCSVJSN | |||||||||||||||||||||||||
|---|---|---|---|---|---|---|---|---|---|---|---|---|---|---|---|---|---|---|---|---|---|---|---|---|---|
| Historical Comparisons | |||||||||||||||||||||||||
| Stocks billion cubic feet (Bcf) | Year ago (10/16/25) | 5-year average (2021-25) | |||||||||||||||||||||||
| Region | 10/16/26 | 10/09/26 | net change | implied flow | Bcf | % change | Bcf | % change | |||||||||||||||||
| East | 900 | 884 | 16 | 16 | 897 | 0.3 | 876 | 2.7 | |||||||||||||||||
| Midwest | 1,065 | 1,037 | 28 | 28 | 1,056 | 0.9 | 1,044 | 2.0 | |||||||||||||||||
| Mountain | 257 | 255 | 2 | 2 | 282 | -8.9 | 246 | 4.5 | |||||||||||||||||
| Pacific | 297 | 294 | 3 | 3 | 310 | -4.2 | 279 | 6.5 | |||||||||||||||||
| South Central | 1,125 | 1,097 | 28 | 28 | 1,250 | -10.0 | 1,165 | -3.4 | |||||||||||||||||
| Salt | 251 | 236 | 15 | 15 | 318 | -21.1 | 295 | -14.9 | |||||||||||||||||
| Nonsalt | 875 | 861 | 14 | 14 | 933 | -6.2 | 871 | 0.5 | |||||||||||||||||
| Total | 3,644 | 3,567 | 77 | 77 | 3,796 | -4.0 | 3,609 | 1.0 | |||||||||||||||||
| Totals may not equal sum of components because of independent rounding. | |||||||||||||||||||||||||
Working gas in storage was 3,644 Bcf as of Friday, October 16, 2026, according to EIA estimates. This represents a net increase of 77 Bcf from the previous week. Stocks were 152 Bcf less than last year at this time and 35 Bcf above the five-year average of 3,609 Bcf. At 3,644 Bcf, total working gas is within the five-year historical range.
For information on sampling error in this report, see Estimated Measures of Sampling Variability table below.
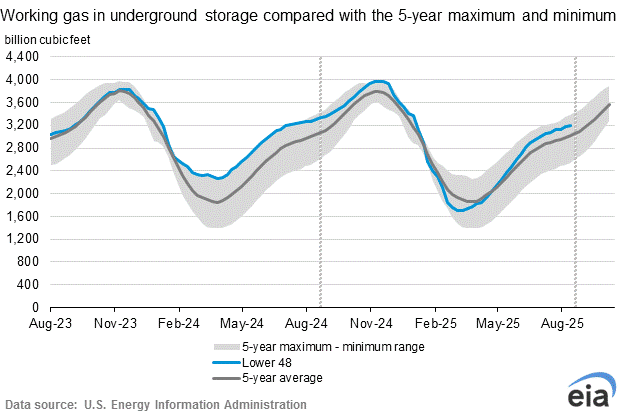
Note: The shaded area indicates the range between the historical minimum and maximum values for the weekly series from 2021 through 2025. The dashed vertical lines indicate current and year-ago weekly periods.
https://www.investing.com/economic-calendar/natural-gas-storage-386
+++++++++++
Below are the numbers for the next 18 injections/withdrawals from 1 year ago to use in order to compare them with last year. Starting with the bottom up for next week. The first number was the ACTUAL number for that week. (2nd number was the estimate, 3rd number the previous week).
Next week, we will be comparing the injection with the +74 Bcf from October 30, 2026.
++++++++++++++++
https://tradingeconomics.com/commodity/natural-gas
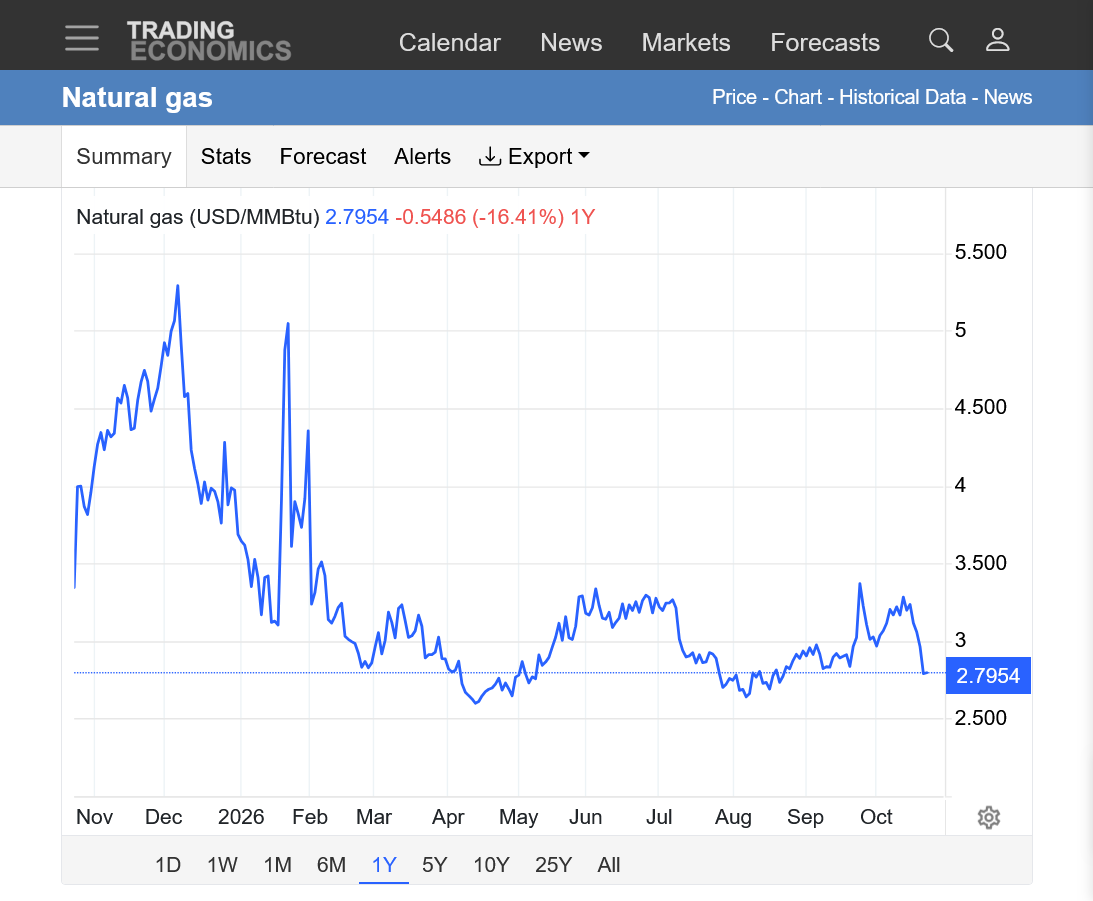
2 things to note on the graph below in comparing it with the data above.
1. The huge rally in November/early December 2025 and HUGE early Winter drawdowns above that caused it. Early Winter drawdowns are always more powerful (and overdone) when driving prices because the entire Winter still lies ahead and more speculators will buy into them.
2. The 2nd, extremely intense spike straight up on the price chart below. This was from the massive drawdowns at the end of January and the first 2 weeks of February 2026. After that, we had MILD weather into April which pressured natural gas to a late seasonal low earlier this year.
3. These are textbook, classical examples of how the weather impacts natural gas futures prices. The market will ALWAYS start reacting long before the actual weather hits. Often 2 weeks before the weather pattern change when it's a flip to the opposite pattern for temperatures in the high population centers with their huge residential heating demand.
https://naturalgasintel.com/news/natural-gas-sell-off-masks-a-troubling-storage-shortfall/