so next line is CPI and see how it unfolds 4405 or 4240 ish -- unable to break MB area 
4405**4240 4403High down it goes 4253 ish Print -- and waiting FOMC
Thanks, fayq!
More later.
We appreciate your pretty colors and squiggly lines on the price chart but please provide some explanation.
Previous thread:
Bot 1 Aug Gold 4133.2
15 responses |
Started by joj - July 9, 2026, 5:02 p.m.
https://www.marketforum.com/forum/topic/121454/
Gold price charts.
https://tradingeconomics.com/commodity/gold
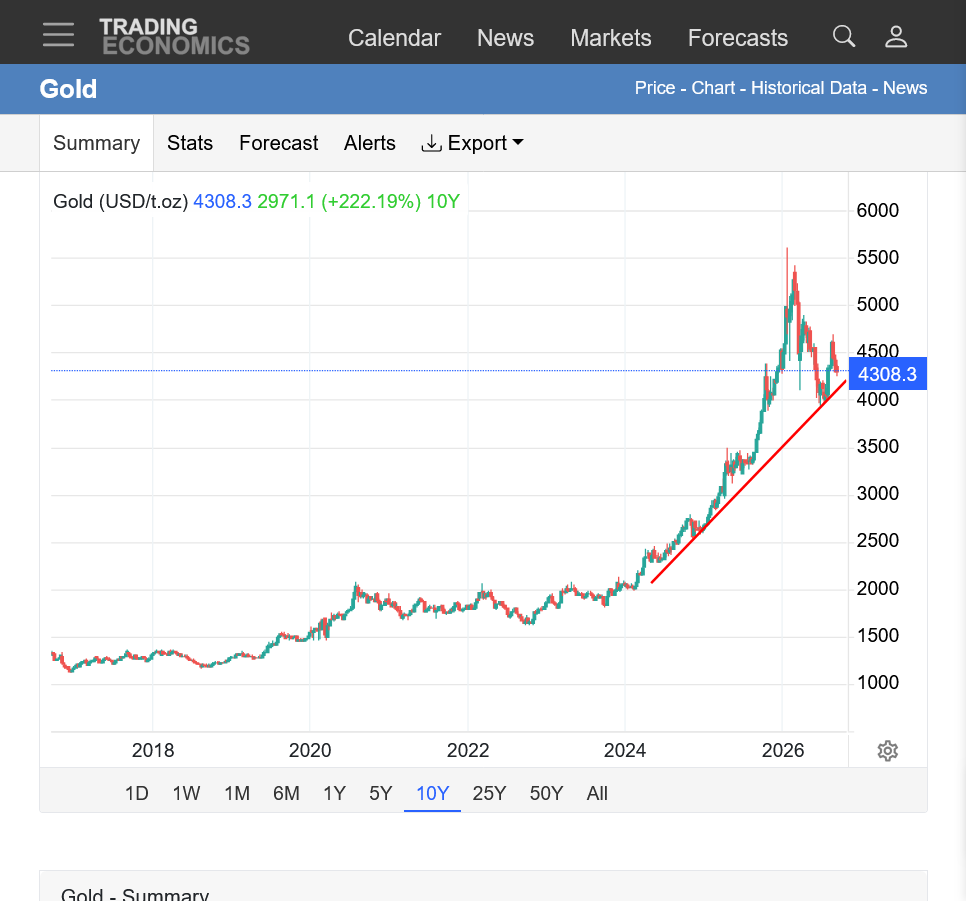
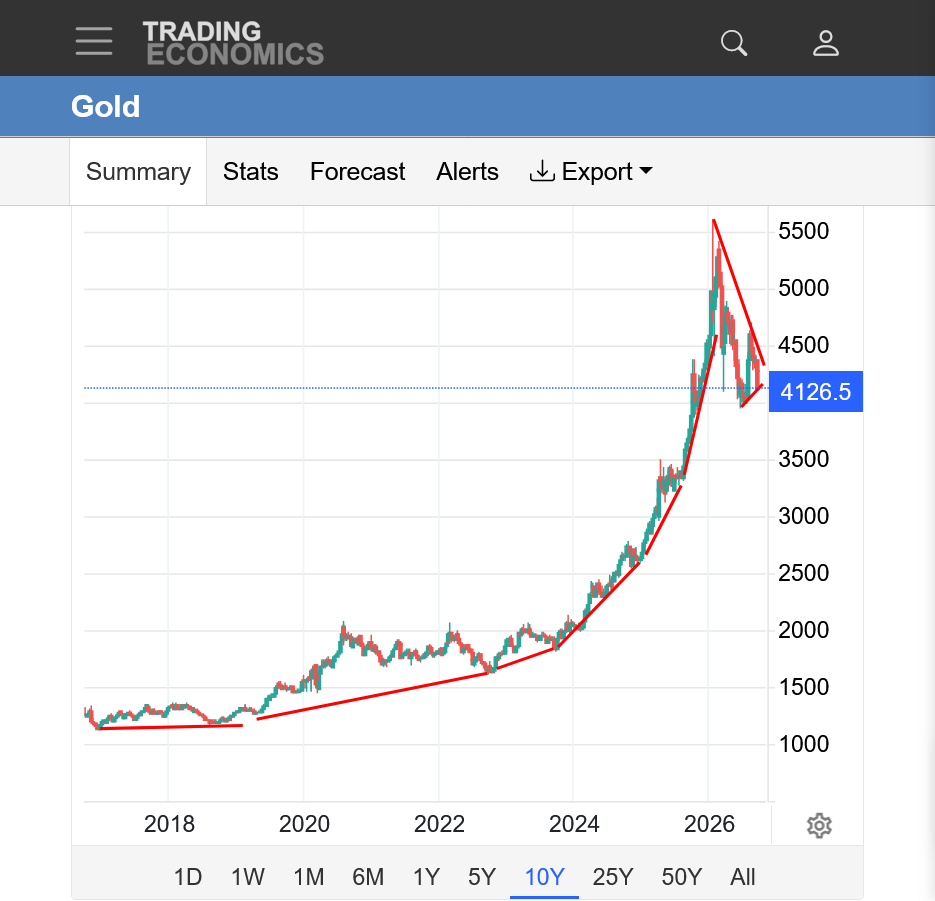
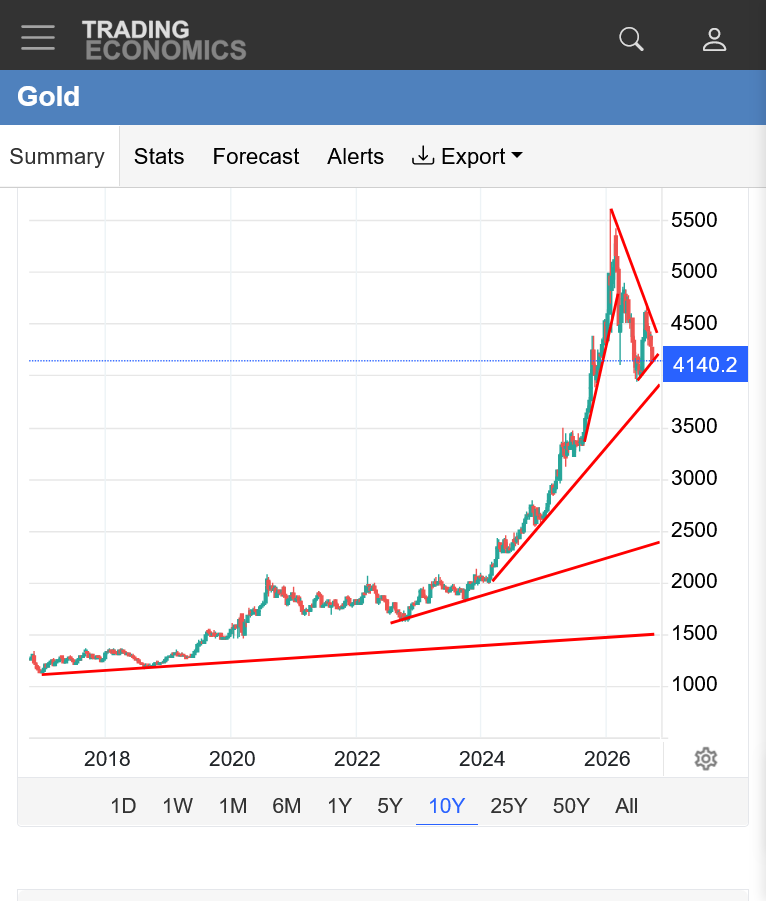
1. 10 years: Parabolic/exponential move higher with increasingly steeper(unsustainable) slope higher. Spike to historic top earlier this year.
1.a Drop of 1,500 but still holding an uptrend if we wanted to draw one from a lower point if a person wants to be bullish.
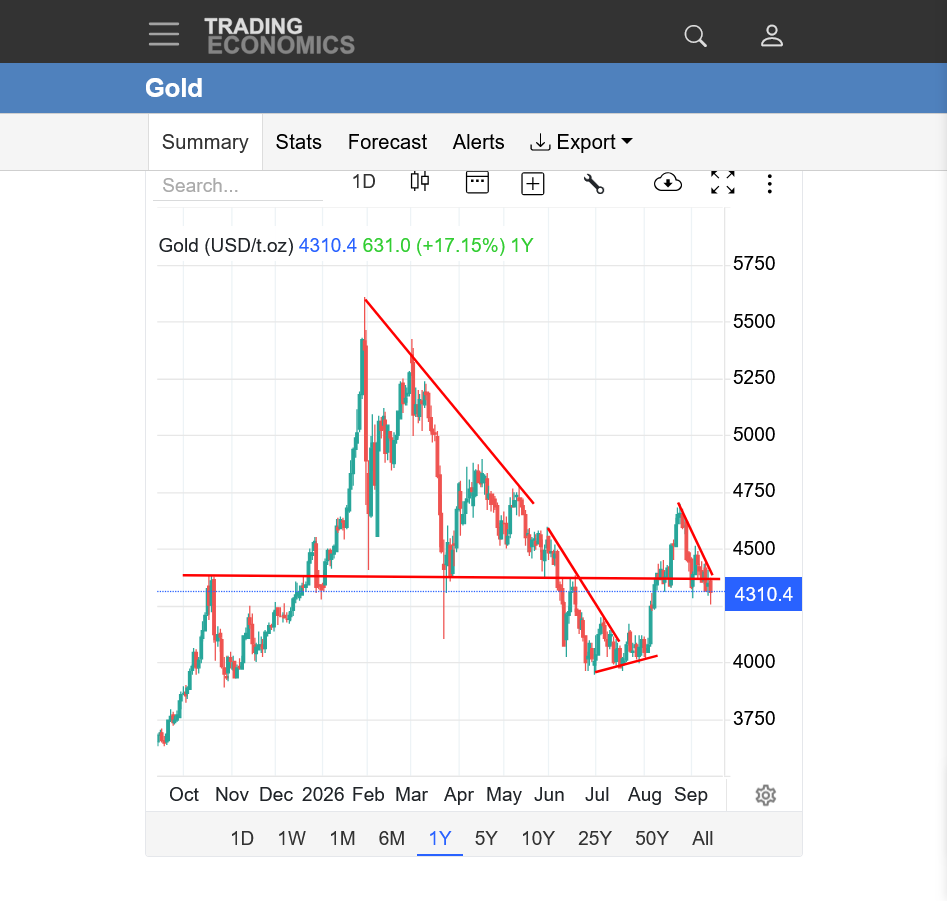
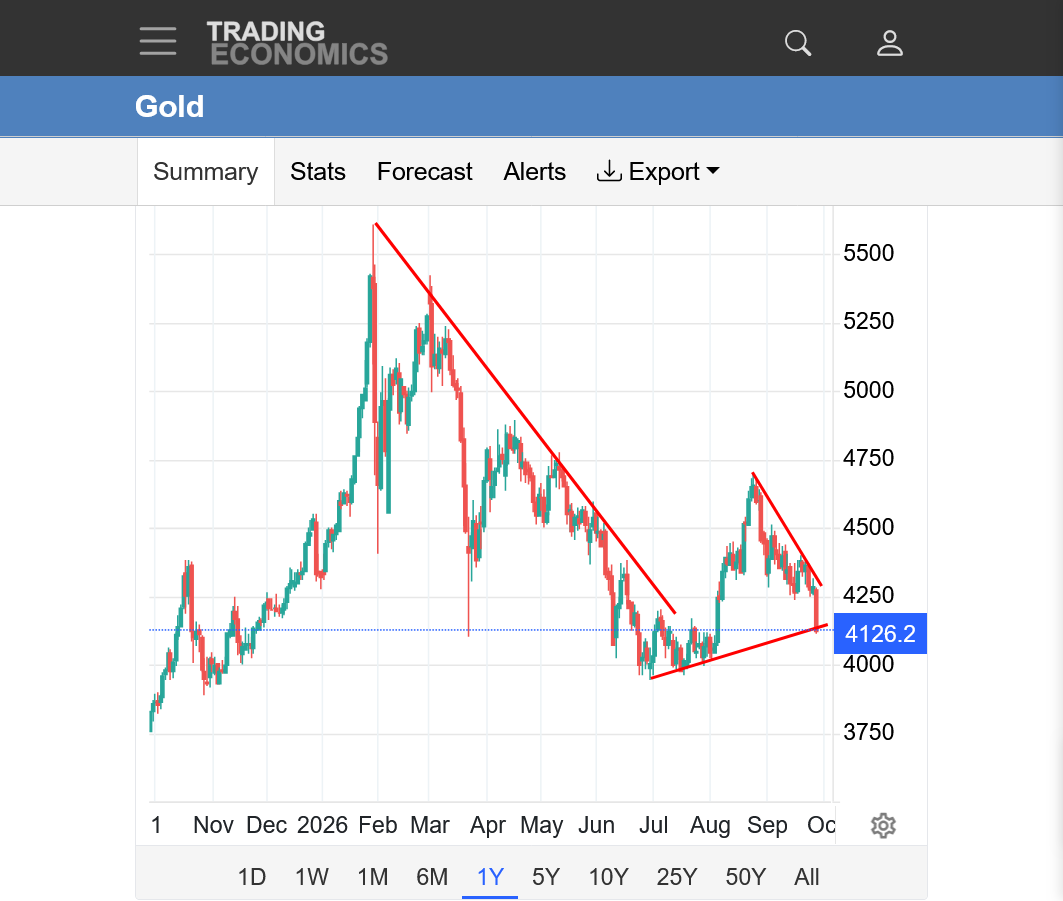
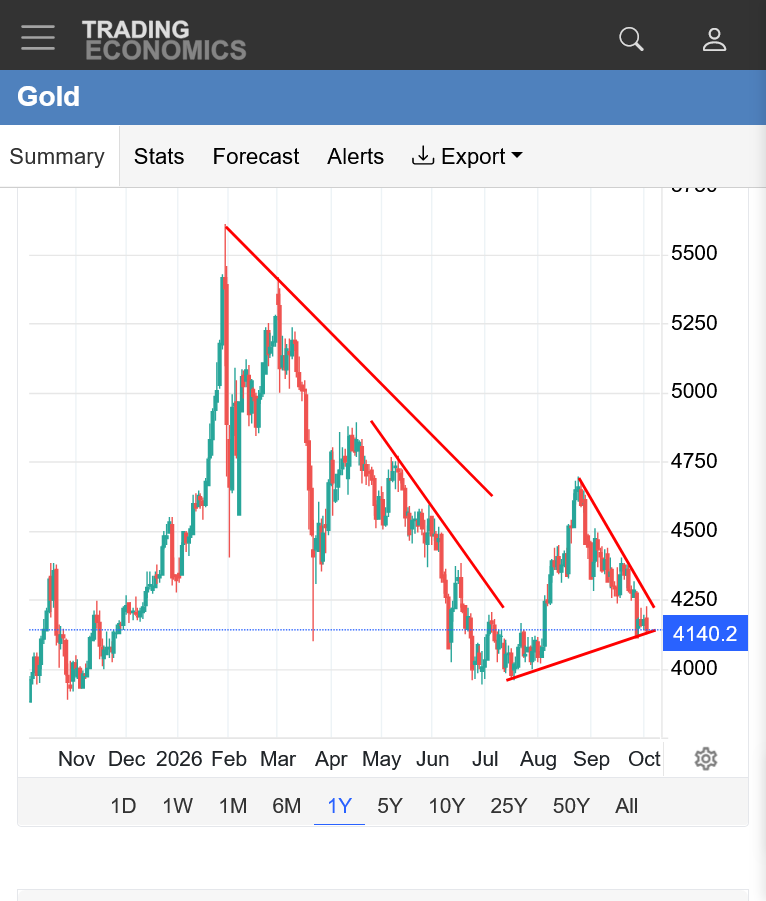
2. 1 year: Historic MAJOR top early this year with a drop of 1,500. So were the lows in June/July a temporary bottom and we just etched out a bear flag, which is a continuation(down) pattern, along with a fake break out last month? Or was it a significant bottom?
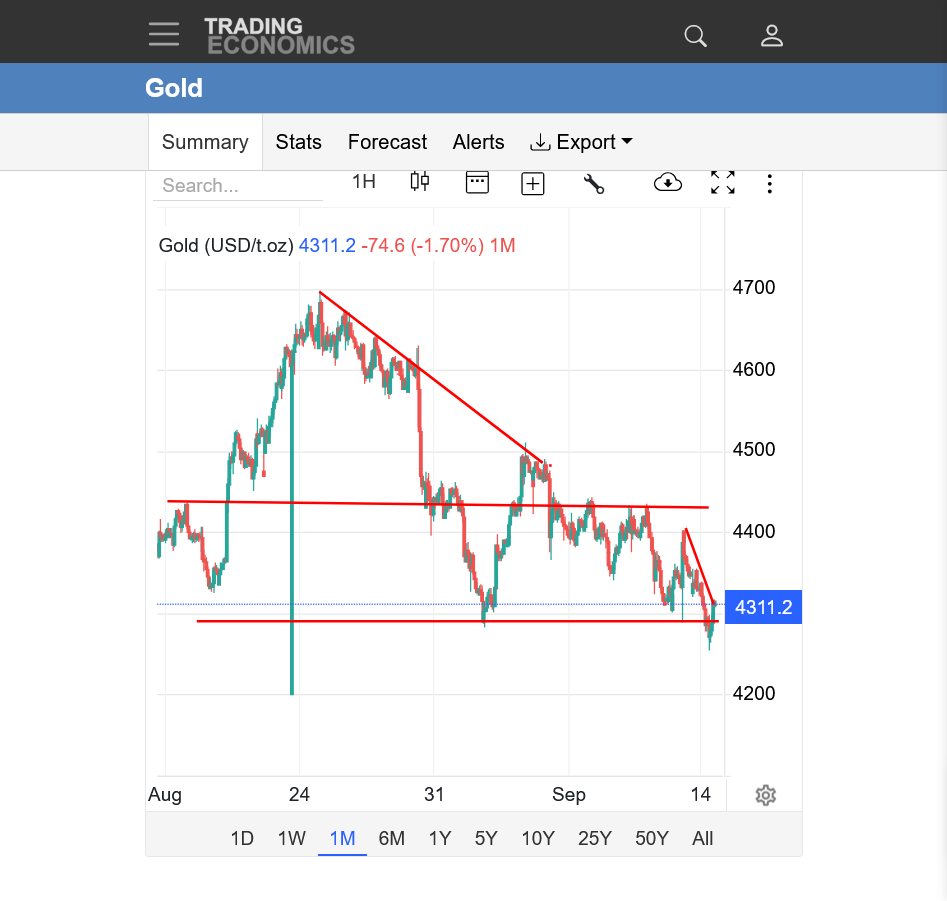
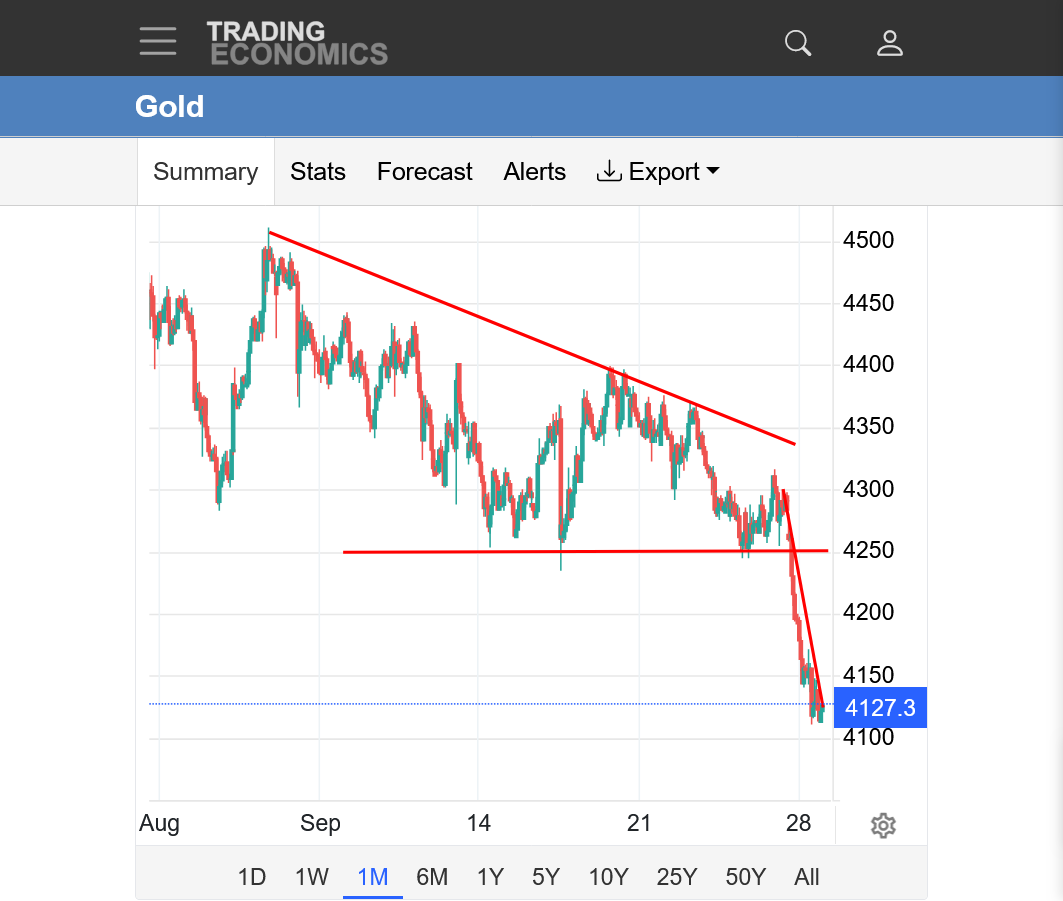
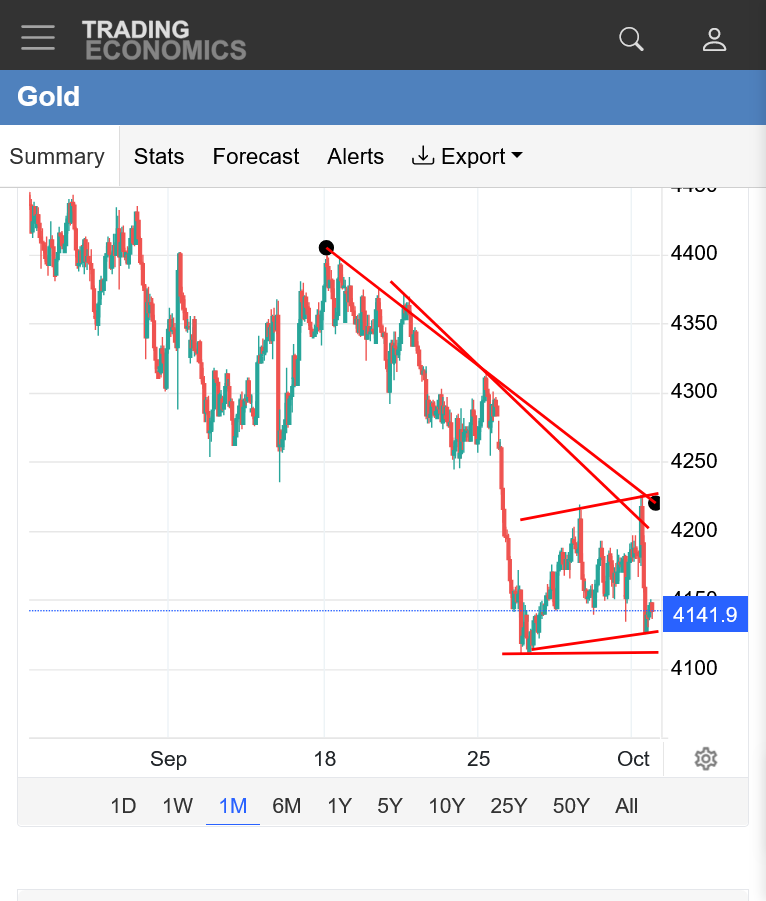
3. 1 month: Clearly down after the fake break out with the bears in control.......but at some previous support.
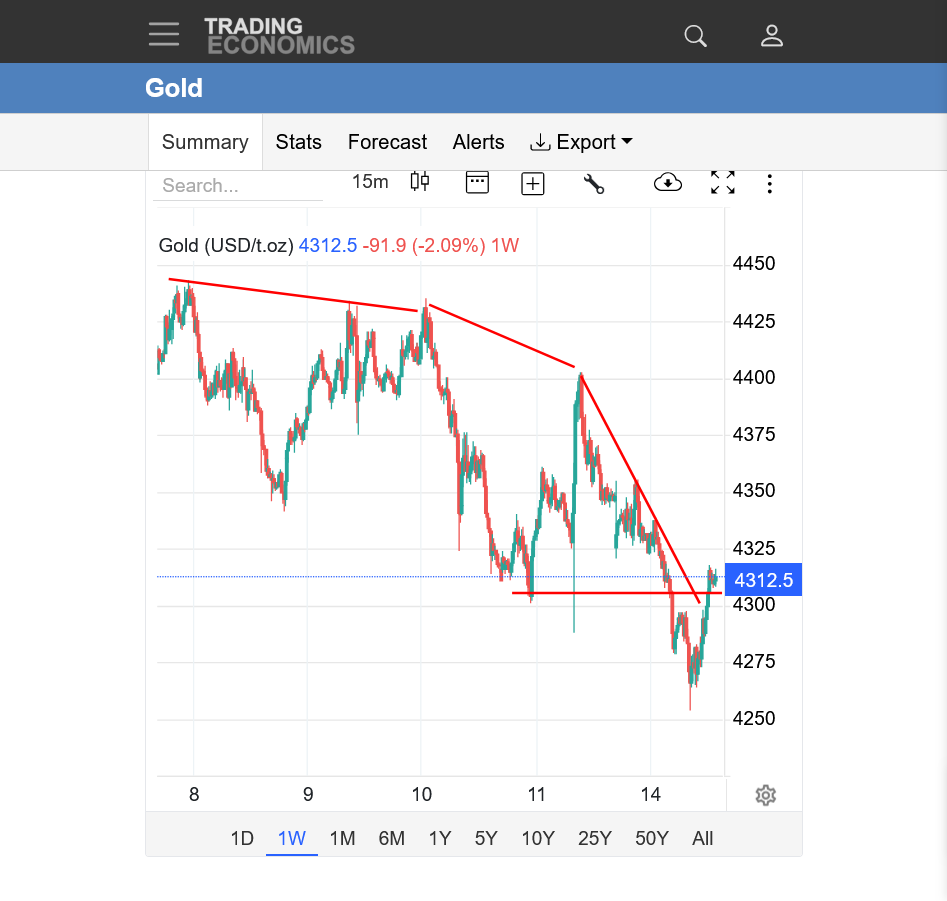
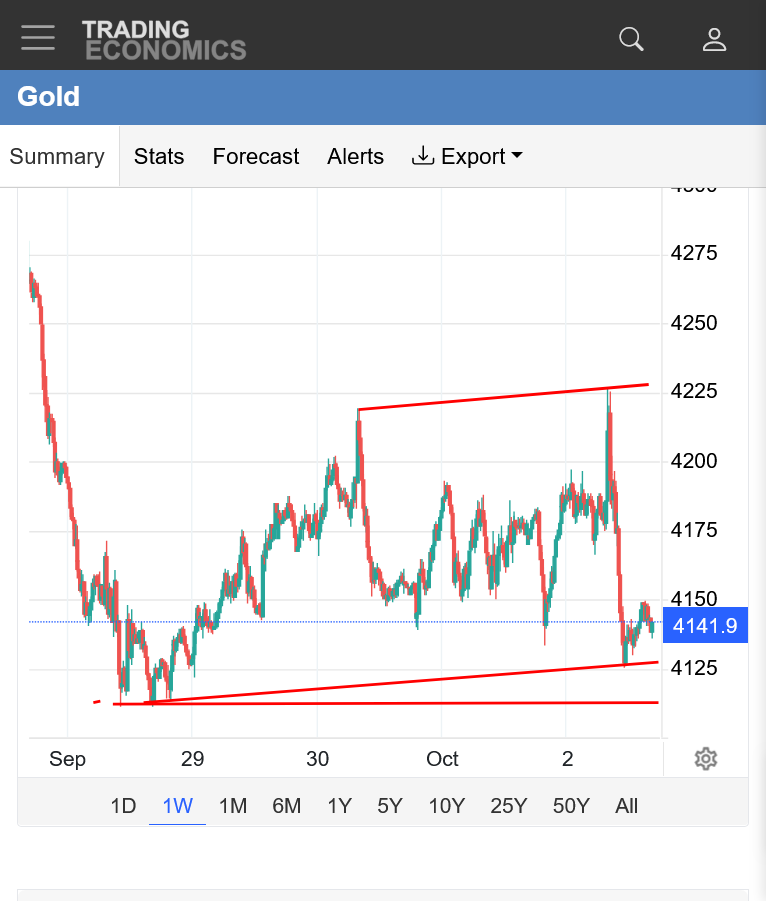
4. 1 week: Accelerating down but signs of a reversal up above last weeks low.
5. 1 day: Open last night at 5pm in the center. Heavy selling pressure, potentially exhausted just below last week's low with a potential reversal(or just temporary from being over sold)
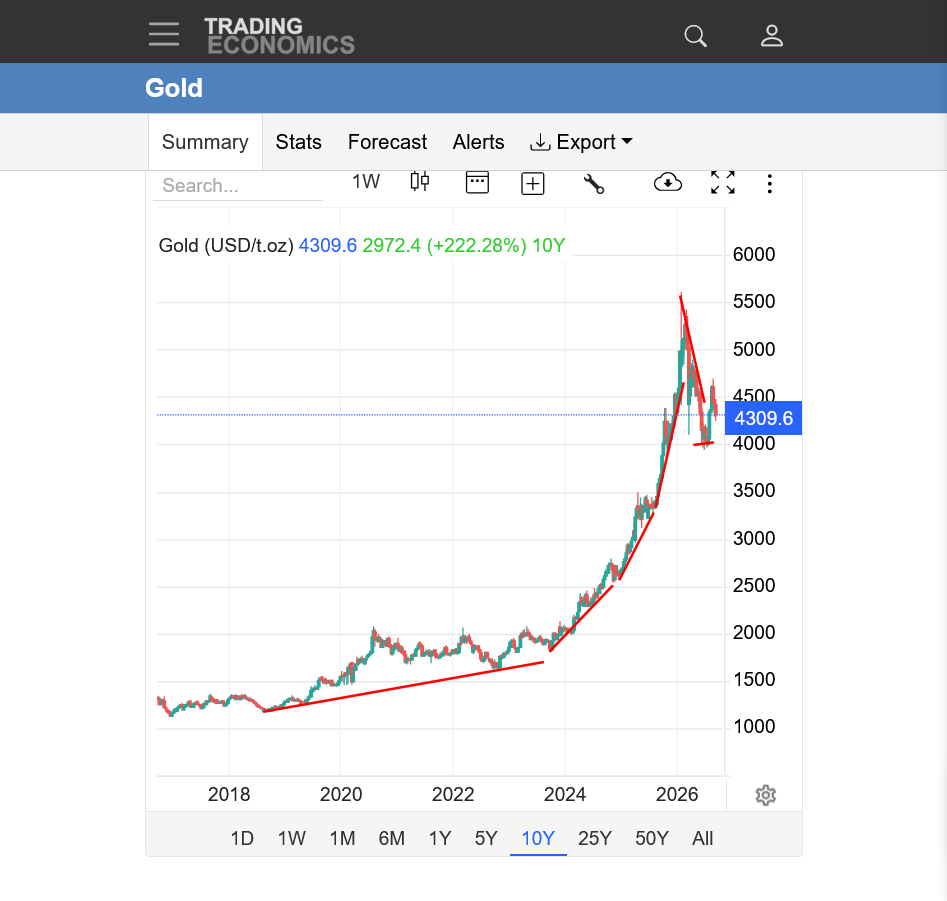
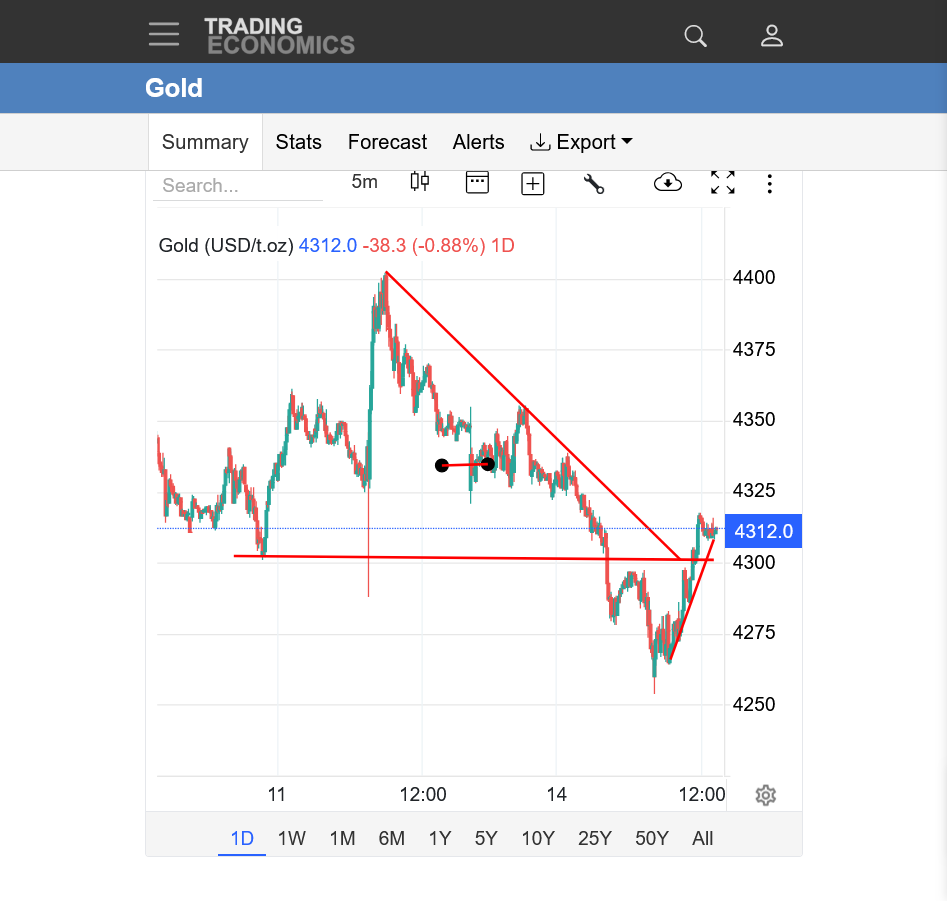
https://tradingeconomics.com/commodity/gold
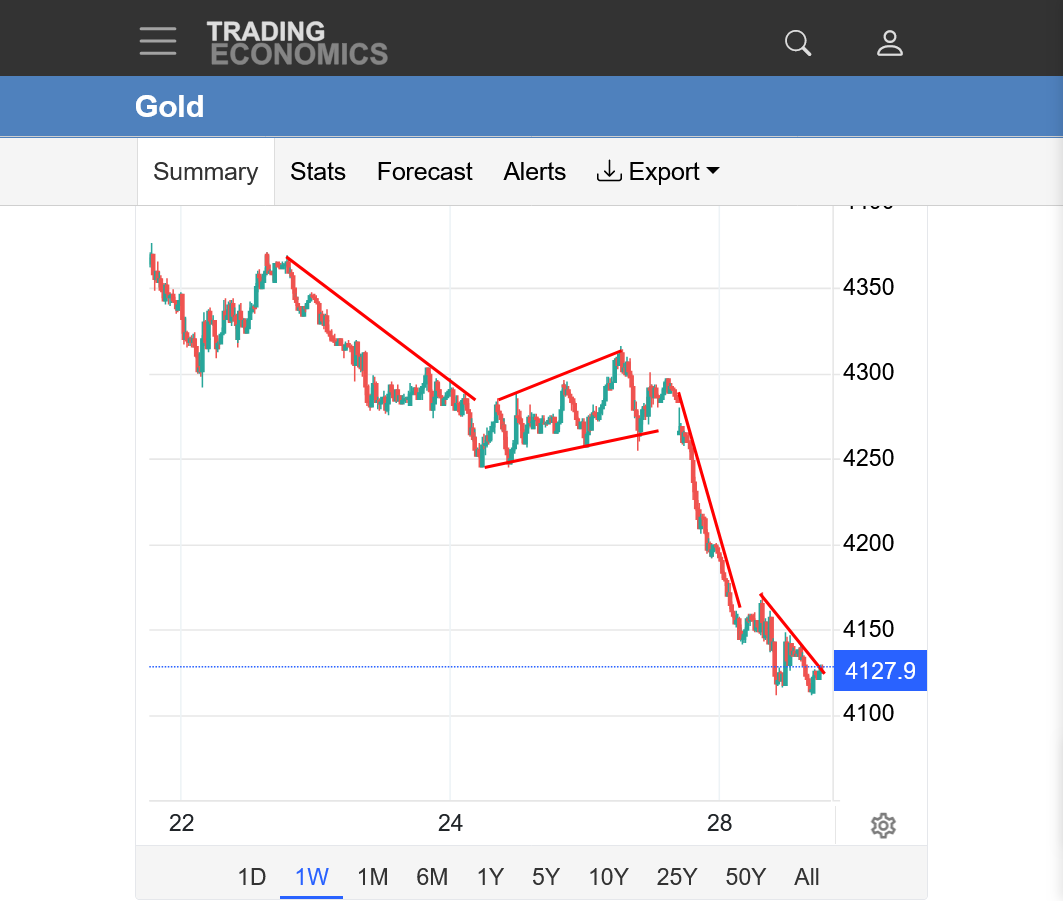
1 week chart below. I never traded gold, but if I did, this chart wouldn't be very helpful with numerous trend lines and support/resistance lines.
We are in no man's land with a potential double bottom in a bearish trend the past month. Potential bearish rectangle/pause(which is a continuation pattern)?
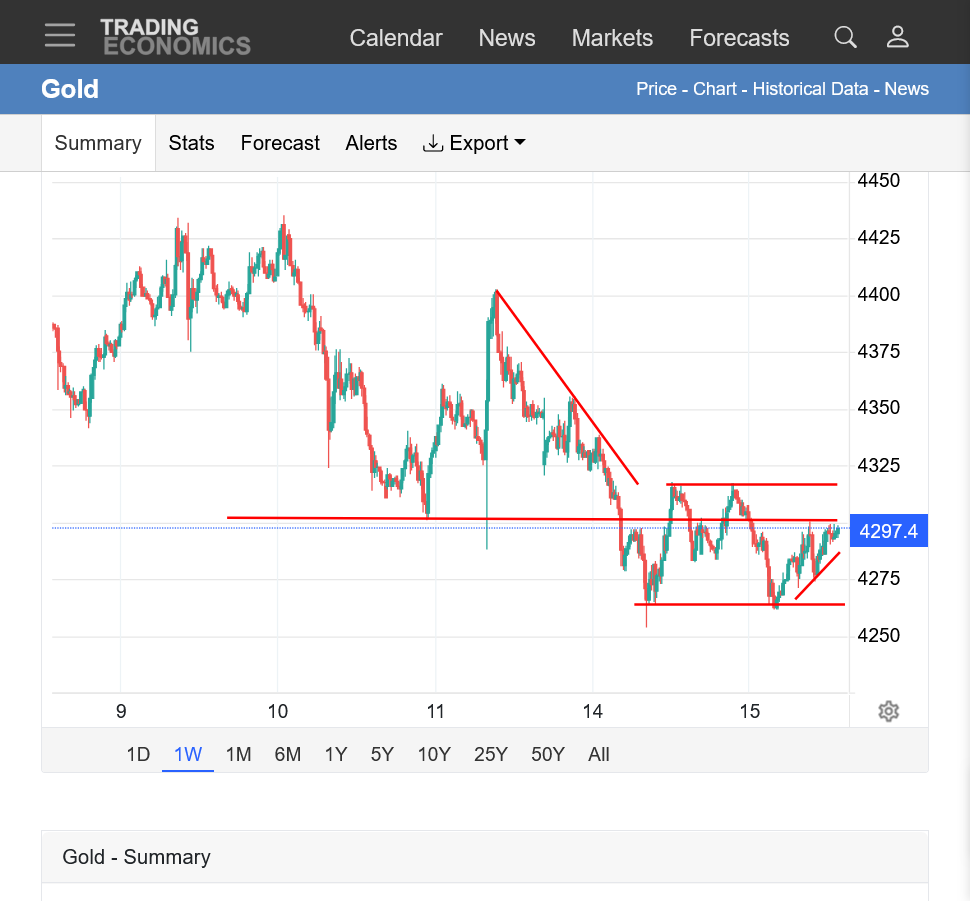
so market adhere it s levels 4405/4240 as mentioned 
https://tradingeconomics.com/commodity/gold
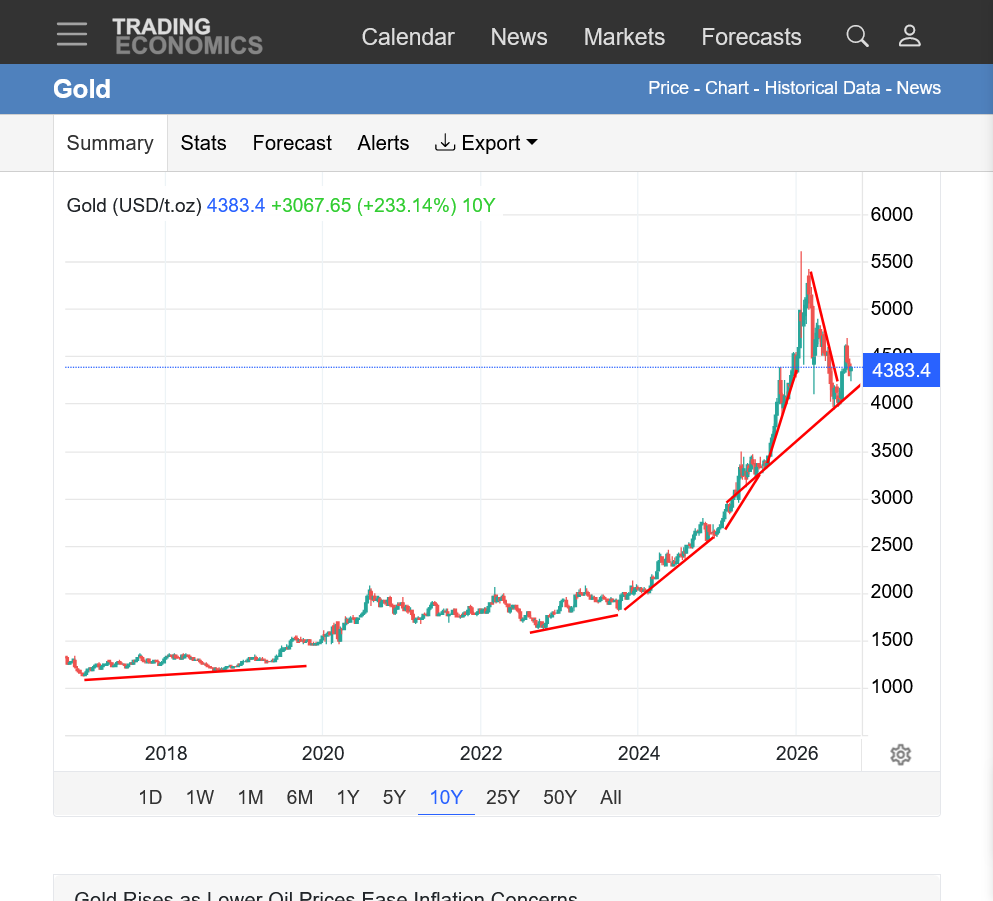
1. 10 years: Previous parabolic/exponential move with increasing/steepening slope higher(unsustainable but impossible to pick the buying exhaustion top). Steep drop since the historical top. A person can draw a new line to the recent low and call that the new long term uptrend as I did to demonstrate a point. Then claim that the recent drop in 2026 from the highs, was just a correction and the pattern is just a bull flag or a symmetrical triangle instead of a top because analyzing charts is often in the eye of the beholder and where they decide to put their lines! To verify that interpretation, we need NEW HIGHS.
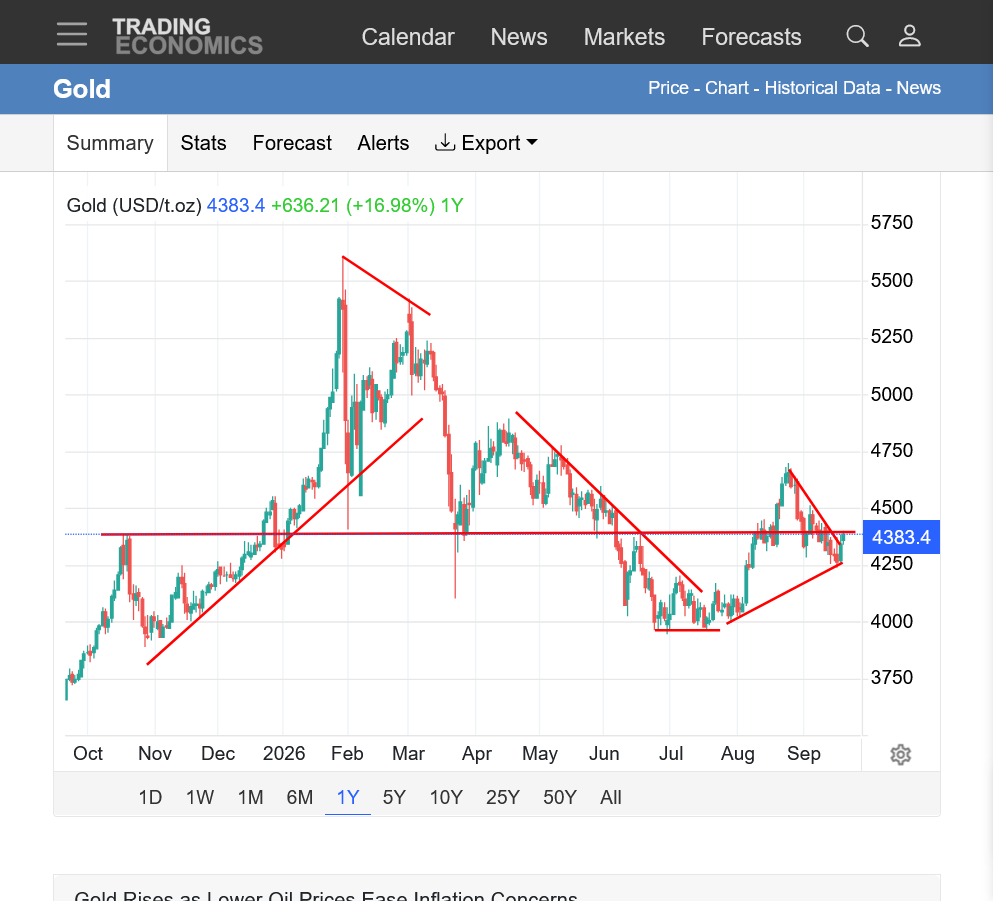
2. 1 year: MAJOR/HISTORICAL topic early this year. Falling almost as fast as we went up(not quite) back to November 2025 levels before support/buying kicked in with a low in July. High in August was met with renewed selling.
3. 1 month: Potential upside breakout from bearish descending wedge/triangle(after short term support held). Again, traders can draw whatever lines they want to justify the pattern they want to see and the bottom line is that these line TELL US THE PAST!. That can be very helpful to understanding what the market WAS trading and how it reacted but can't tell us THE FUTURE, which is what we trade.........the FUTURES, not the PASTures.
The NEWS, along with underlying fundamentals that are sustained determine the FUTURE.
Analyzing and using price charts is not a magical, mystery code that unlocks a secret to the future like a crystal ball. However, it's extremely helpful in identifying points of support/resistance in the past, trend lines, momentum and other algorithms which analyze market behavior.
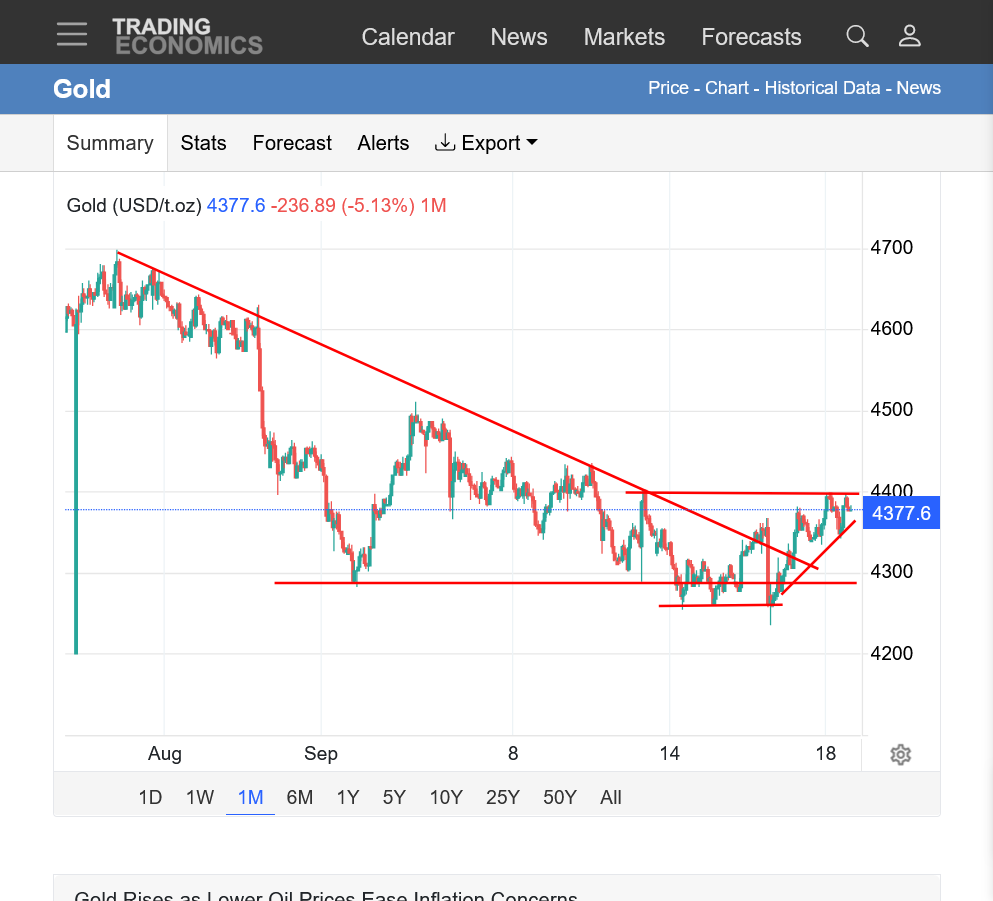
So Any Run waiting till XI-Trump meeting then it can take off -- or offffff --!! moi is L@@king for Good Run--!
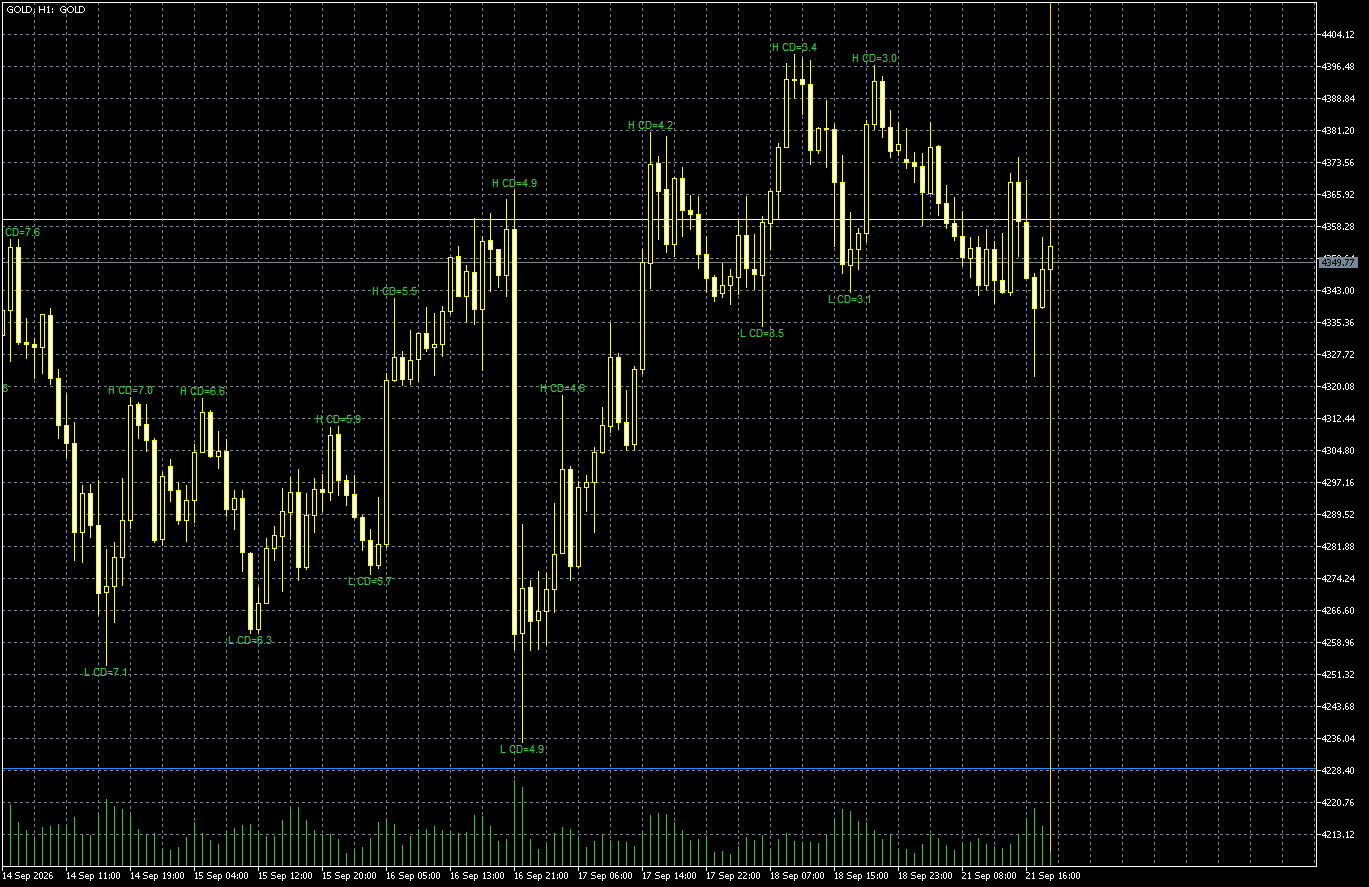
Downside/bearish chart pattern continues for the gold market.
https://tradingeconomics.com/commodity/gold
1. 10 years: See previous analysis.
By metmike - Sept. 14, 2026, 2:40 p.m
Historical top in January 2026 after unsustainable, parabolic/exponential move higher with increasing slope. Potentially breaking out to the downside of a bear flag right now....or maybe the Summer low will hold?
2. 1 year: Historic highs in January 2026. Low in July. Is this a bear flag(a continuation pattern in downtrend) or will the July low hold?
3. 1 month: Breaking out and accelerating to the downside!!
4. 1 week: Steep drop lower!
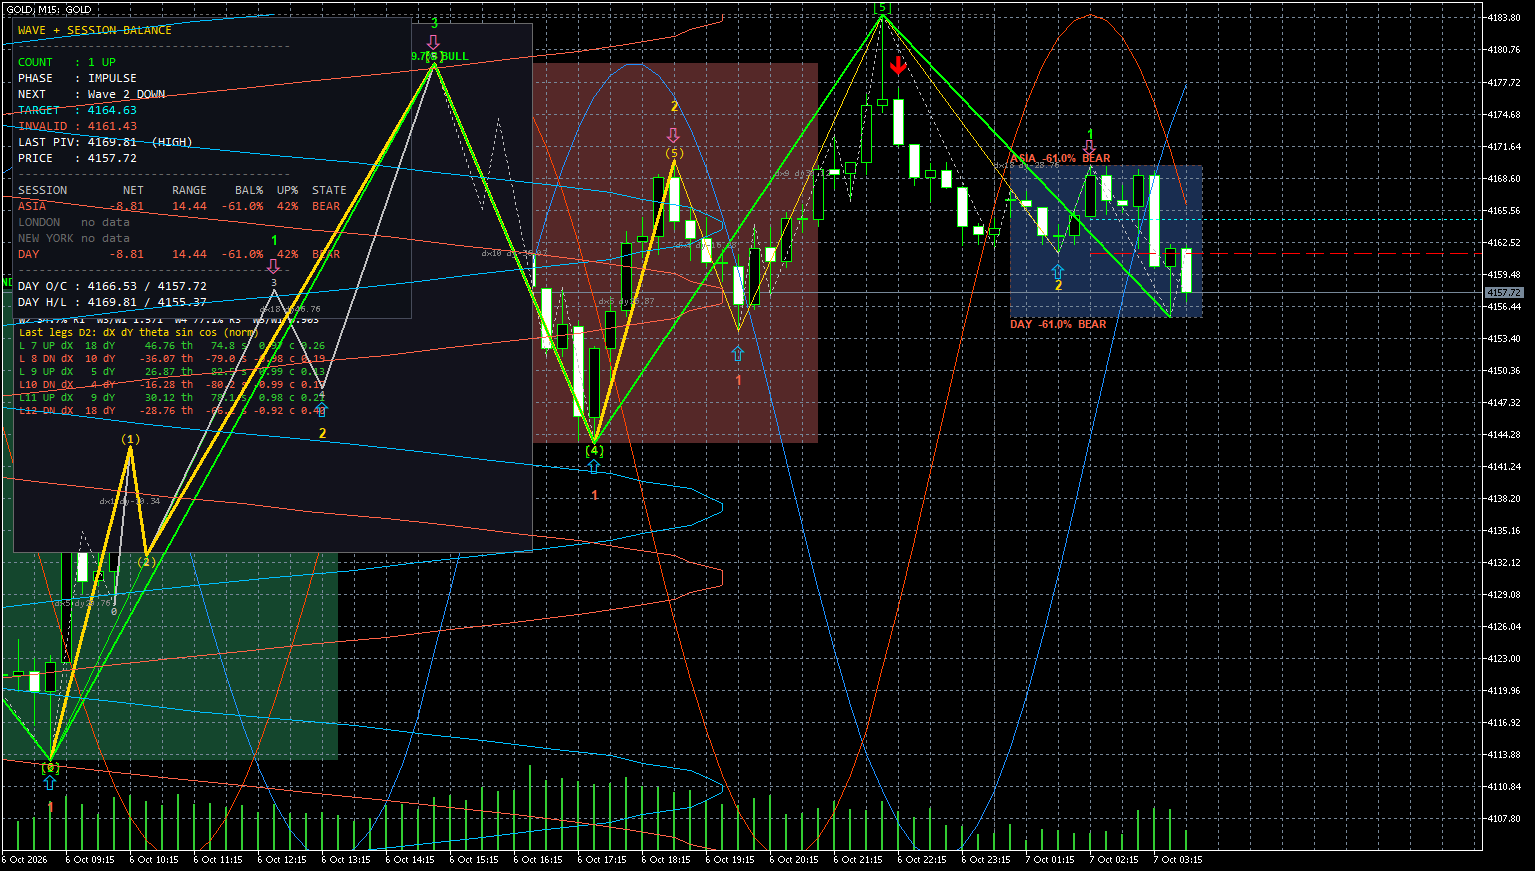
Gann wheel or clock --- 4225 and 4255 can be tough all in all another Brick in the Wall 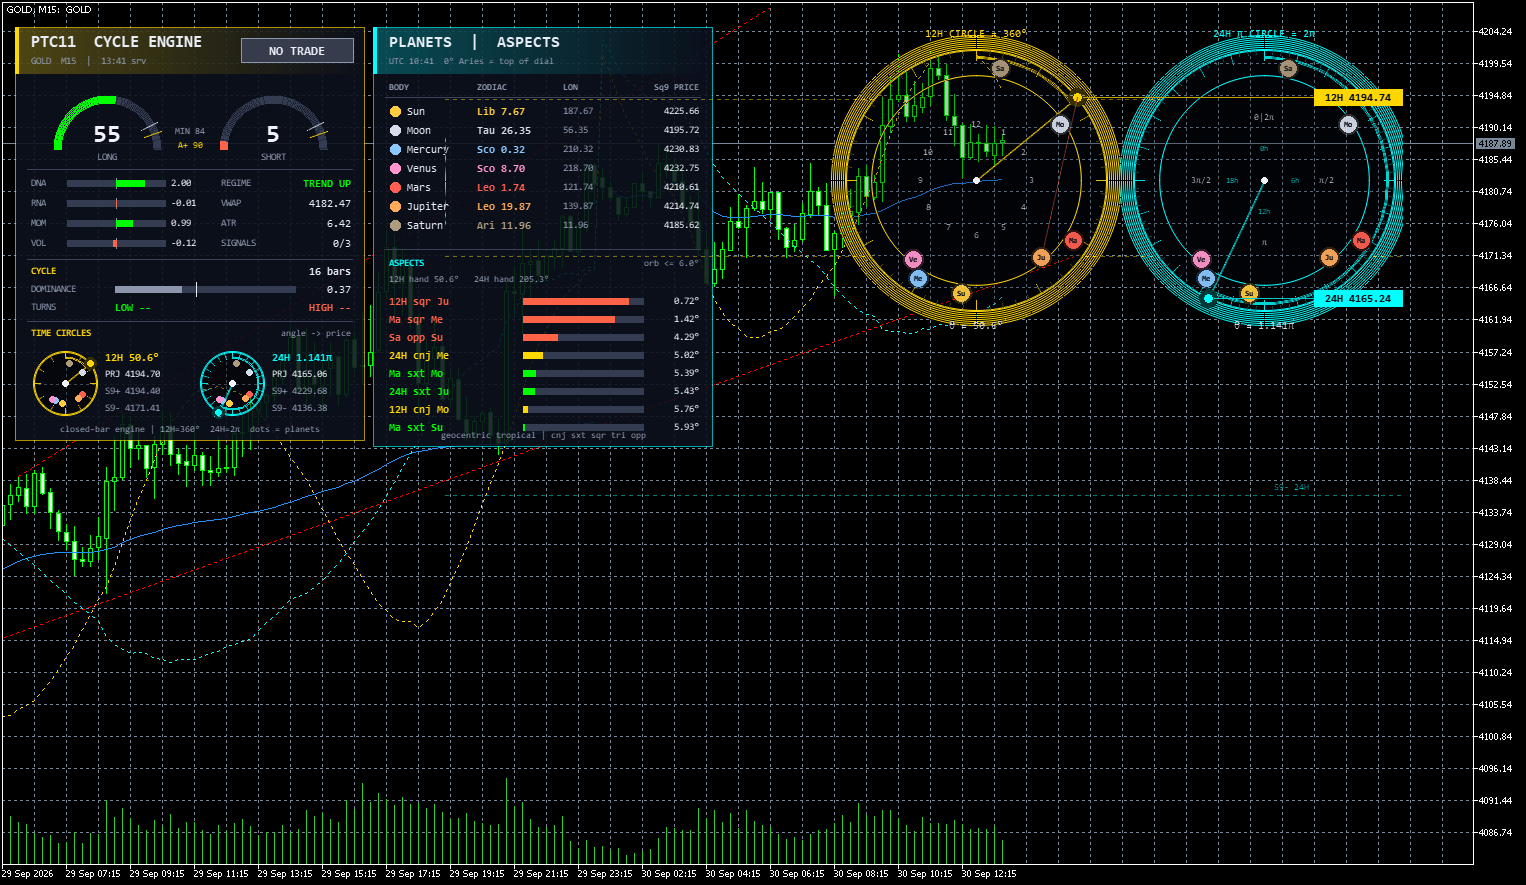
Thanks very much, fayq!
More pretty colors and impressive looking, esoteric stuff!
so Higher Low and lower lows since 4405 --4315 4228 and next 4078 can be important needs to break 4315 for Bulls to back n control
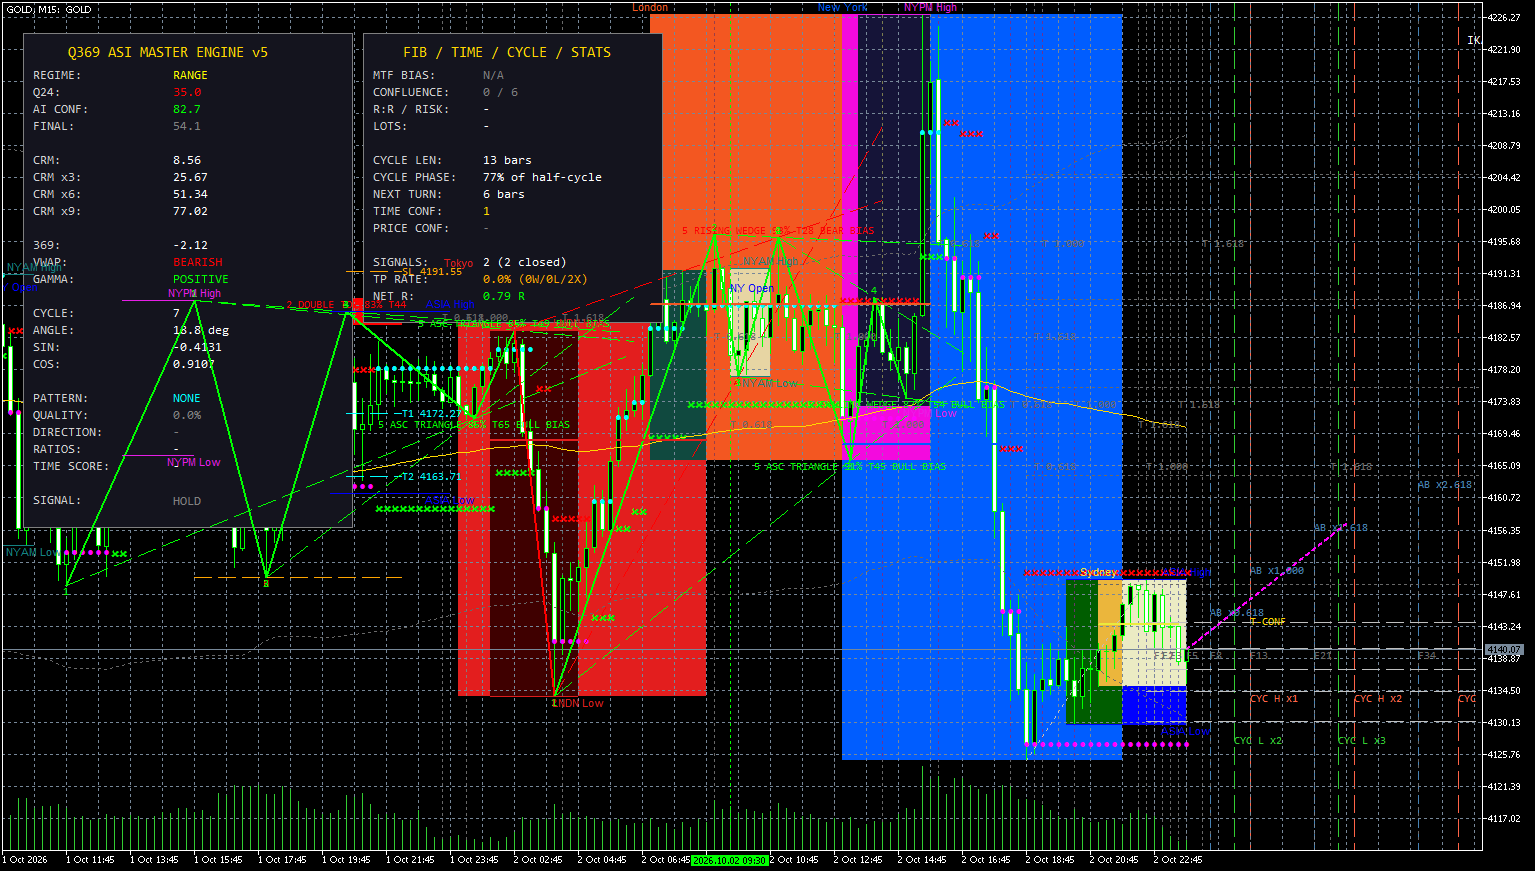
so Higher Low and lower lows since 4405 --4315 4228 and next 4078 can be important needs to break 4315 for Bulls to back n control
fayq,
Thanks, I see your symmetrical triangle!
Added 5am: technically a symmetrical triangle is higher lows and lower HIGHS and I choose to draw lines below that depict that pattern which puts the bears and bulls on equal footing, even though the overall chart formations below favor the bears.There is clearly a case to be made for both sides and my objective, especially when I have a personal bias towards 1 side is to present both sides!
The chart analysis of gold right now is a perfect example of this being an art not a science where beauty is in the eyes of the beholder.
Only in this case, we draw our lines in different places based on what we see as significant, connect the dots of tops and bottoms that are all over the place.
Sometimes, the vast majority of traders would agree with the ones. Other times, they are extremely subjective and often correlated with whether you are bullish or bearish with the strongest correlation(causation) with whether you are long or short.
https://tradingeconomics.com/commodity/gold
1. 10 years: Major top in everybody's book after the unsustainable, exponential/parabolic, long term move up. But is this a bear flag/triangle(continuation pattern)? Is it a symmetrical wedge? We can go back and draw old uptrend lines and make a bullish case that negates the recent collapse lower. All of them could be valid and none of them are proven until AFTER the price violates the lines we've drawn.
2. 1 year: There's that symmetrical triangle. However, the bears are crushing the bulls with the very steep downslope lines and the barely holding upslope line.
3. 1 month: Similar analysis. Bears are totally crushing the bulls. The bulls having a last stand, subjective support drawn line that's hanging on, which could actually just be another bear flag(continuation of the clearly defined downtrend from the major top early in 2026).
4. 1 week: Using this scale only, the bulls have the advantage! Slightly higher lows AND slightly higher highs last week........but we closed much closer to the lows which leaves that interpretation on very shaky ground.
I think that fayq identified some key levels, which will determine which of our lines above are eventually validated for either the bulls or bears.
Usually, the NEWS that is not dialed in yet to the price and unknown to the market is the determining factor to where the price goes next.
Price charts are great! I wouldn't waste hours of my time every week here with extremely detailed analysis, using them. ..........even in markets I never trade, like gold, unless they provided value for traders.
But they only tell us about the past. The past CAN assist in predicting the future because traders(Wyckoff's Composite Man-entire market acting as 1) will use support levels to buy and resistance to sell and trend lines can matter in that same realm.......but only when fundamental news doesn't trump everything else...........which is most of the time that that we VIOLATE support or VIOLATE resistance.
When we do violate those levels or trend lines...........then we draw NEW lines which then dials in the latest news that is reflected in those lines (of the past) and wait for new things to emerge.
Gold still in range and still waiting for find direction 4075 and 4227 break decide the Direction While Retro Venus and mercury in SCorpio
https://tradingeconomics.com/commodity/gold
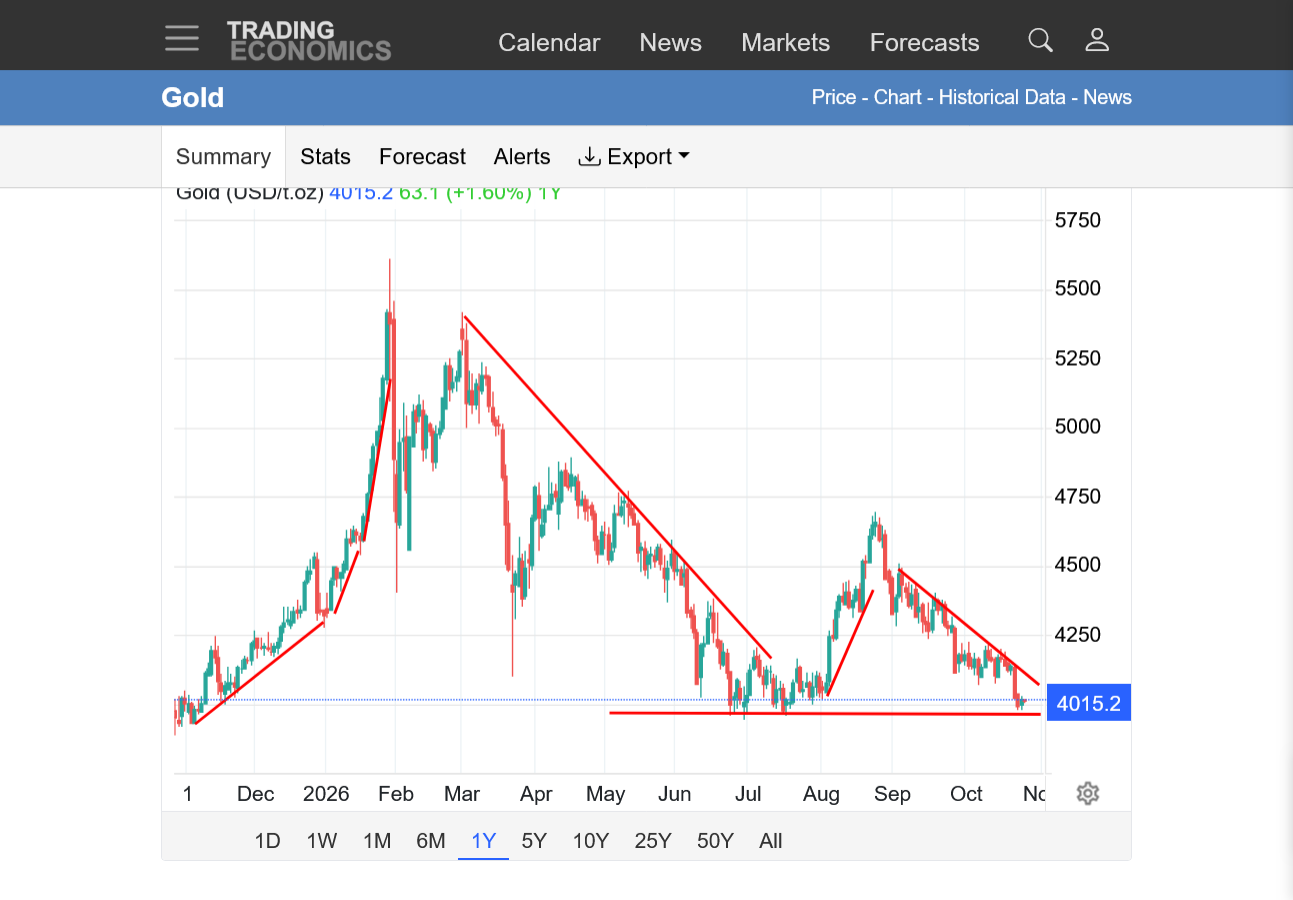
1. 1 year: Historical high/top early this year after going parabolic/exponential. Sharp move down after that, interrupted by a bear flag bounce in August. Now back down to testing the Summer lows around $4000 again with a descending triangle. (lower highs/horizontal line for lows)
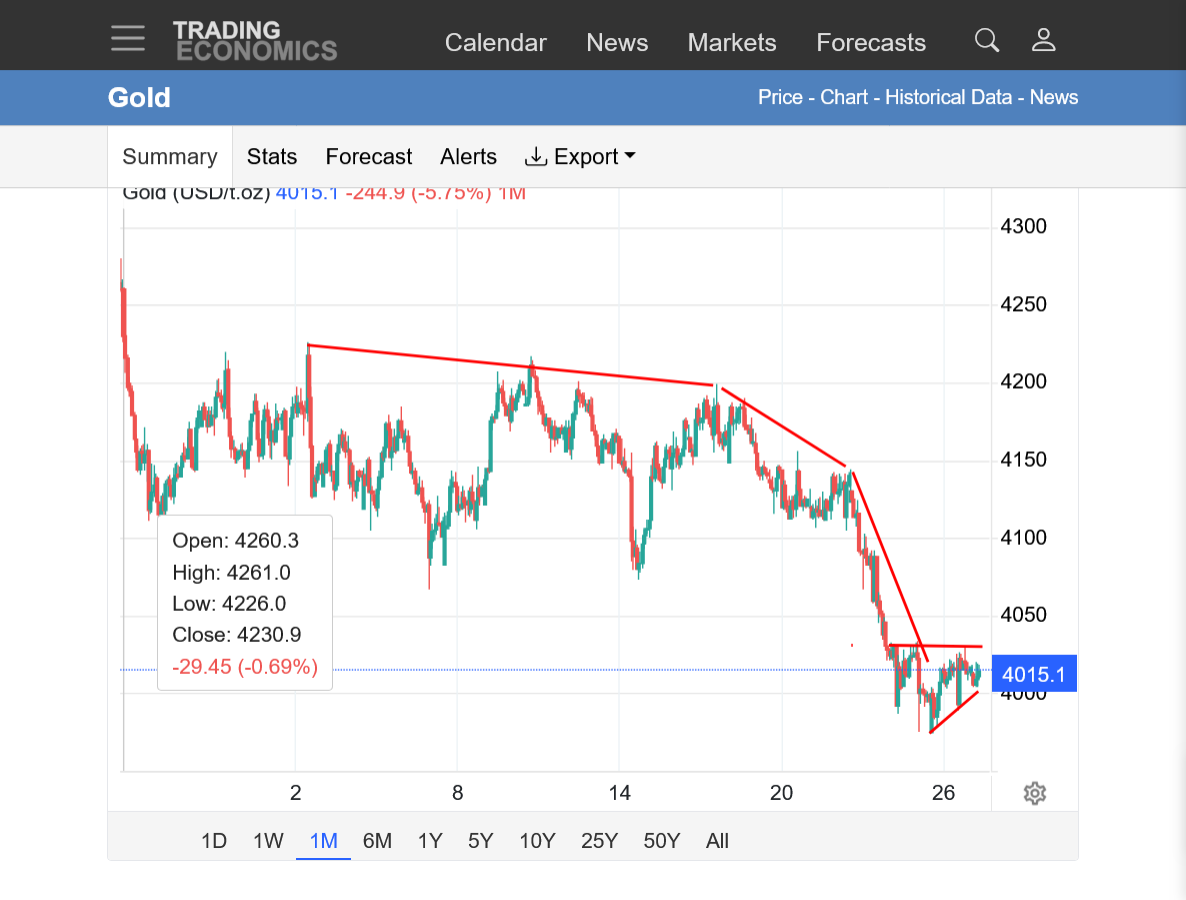
2. 1 month: Lower highs. MUCH steeper down slope and losses last week. Holding $4000 area and Summer lows so far this week.
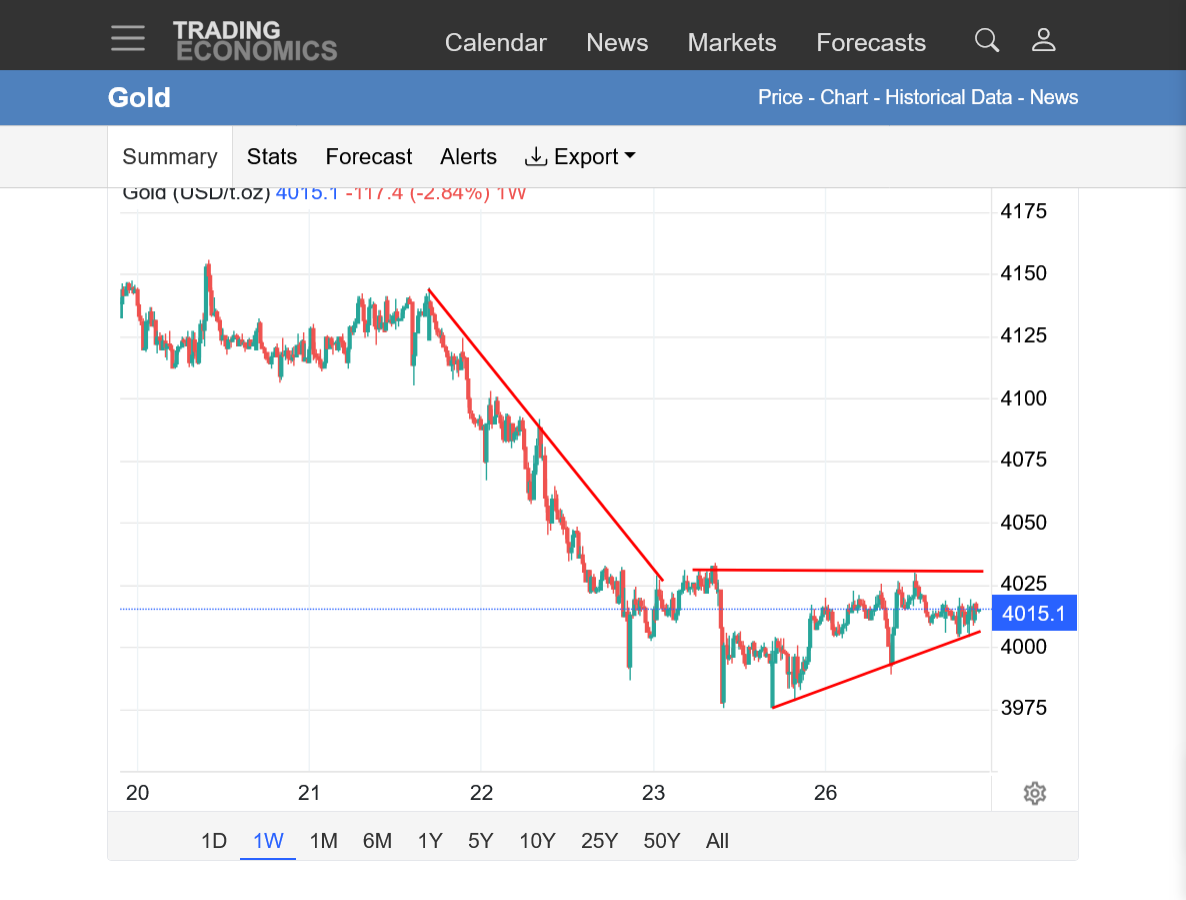
3. 1 week: After the huge drop last week, we held $4000 so far this week. Potential ascending wedge formation to start the week(higher lows, flat highs)
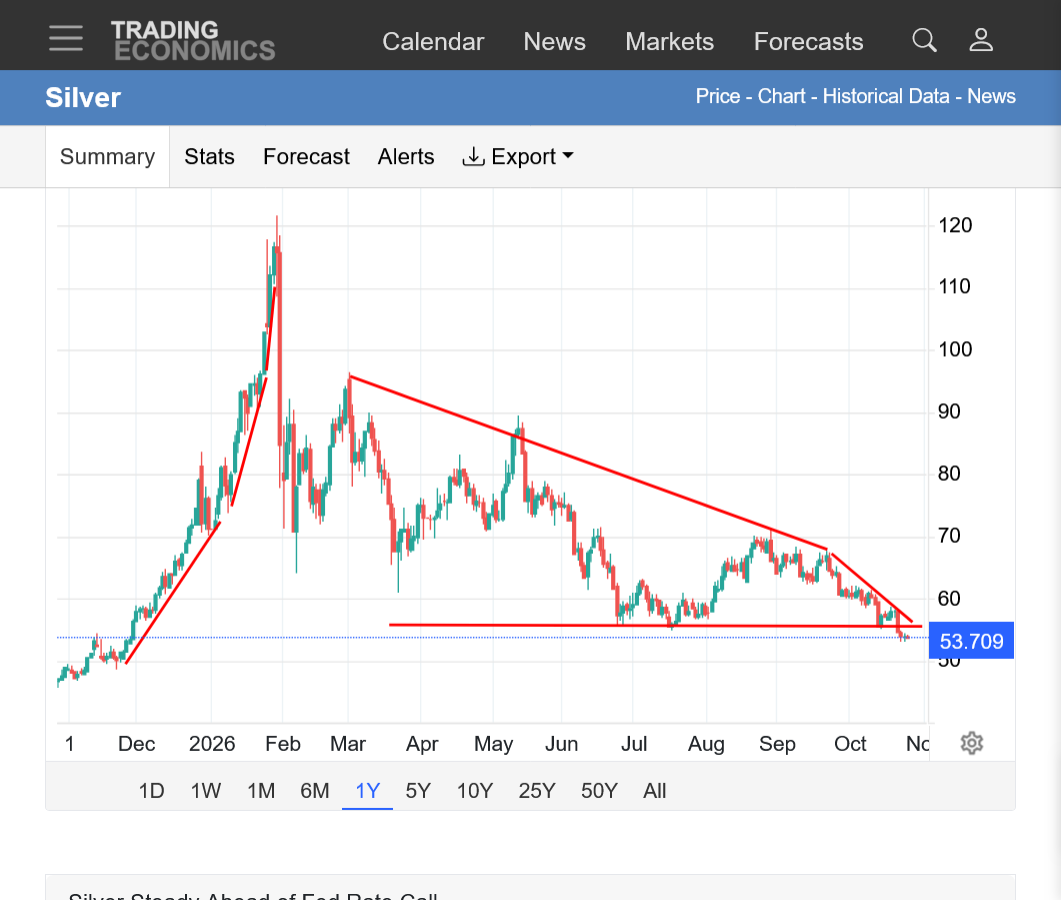
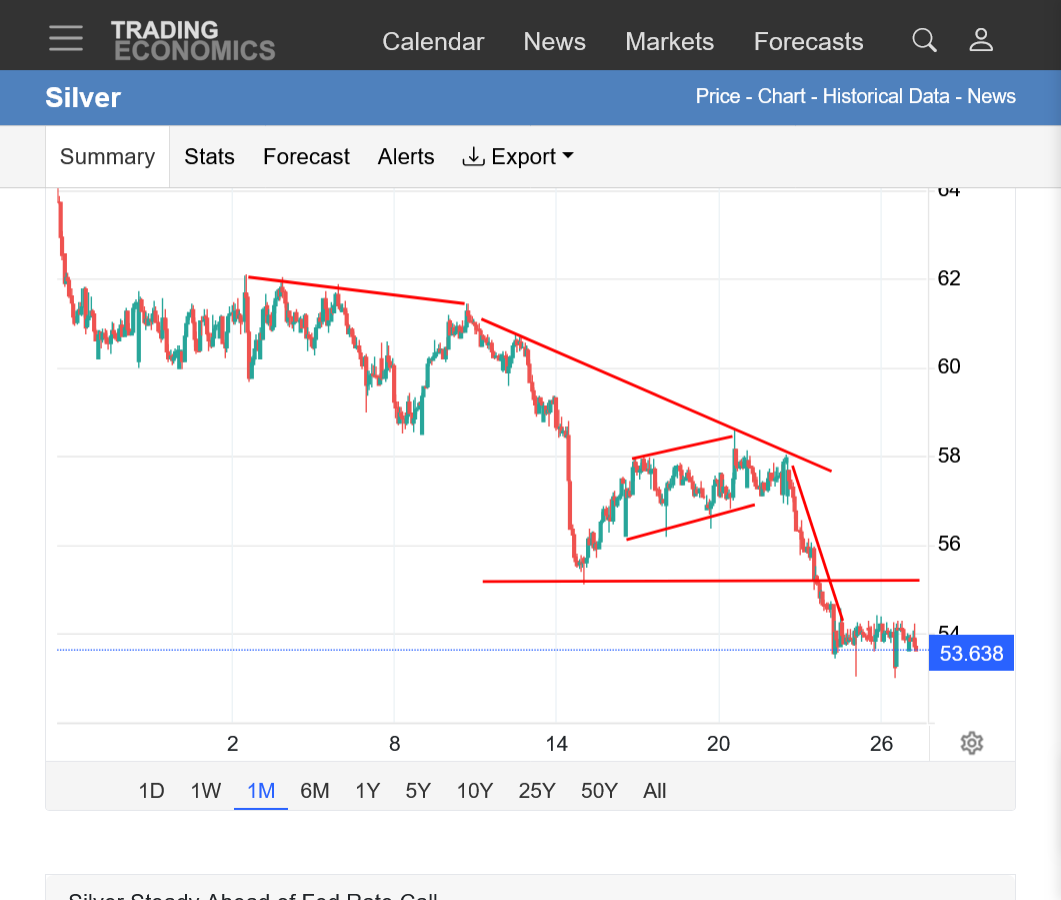
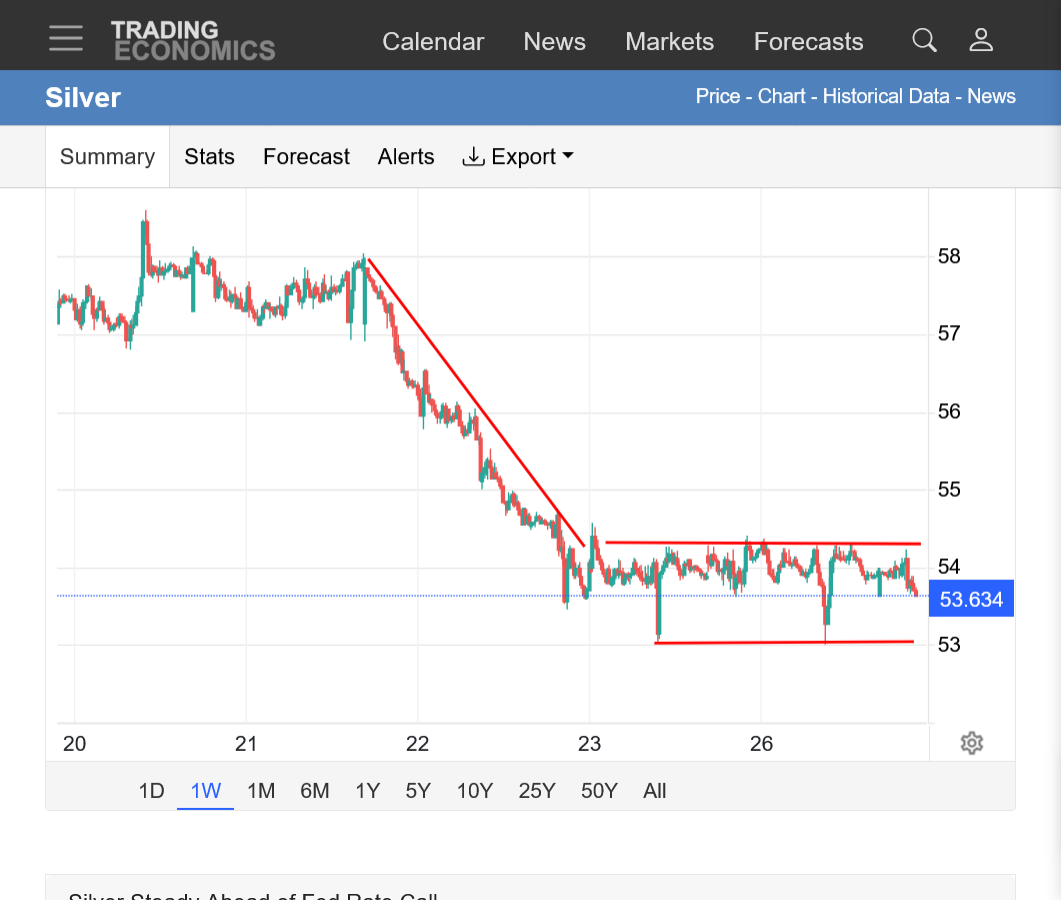
Silver bears have been ruling since the January 29th historical spike higher!
https://tradingeconomics.com/commodity/silver
1. 1 year: Parabolic/exponential move to the spike high 9 months ago. Solid downtrend since then, with the slope accelerating down recently.
2. 1 month: DOWNtrend! Bear flag that tested the down slope line, then accelerated down last week. Holding this week!
3. 1 week: Sideways trading the past 2 days. Double bottom??? Or another bearish rectangle.