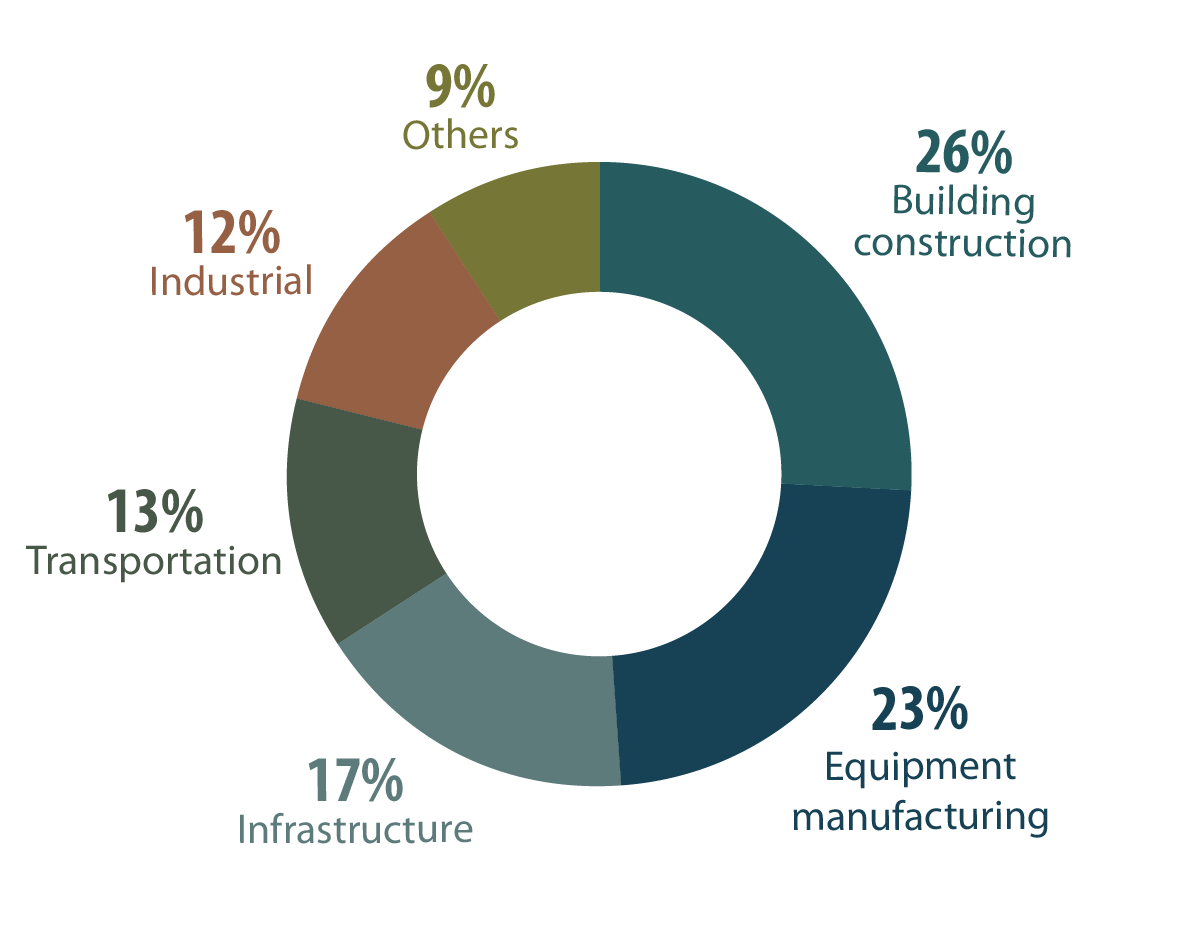
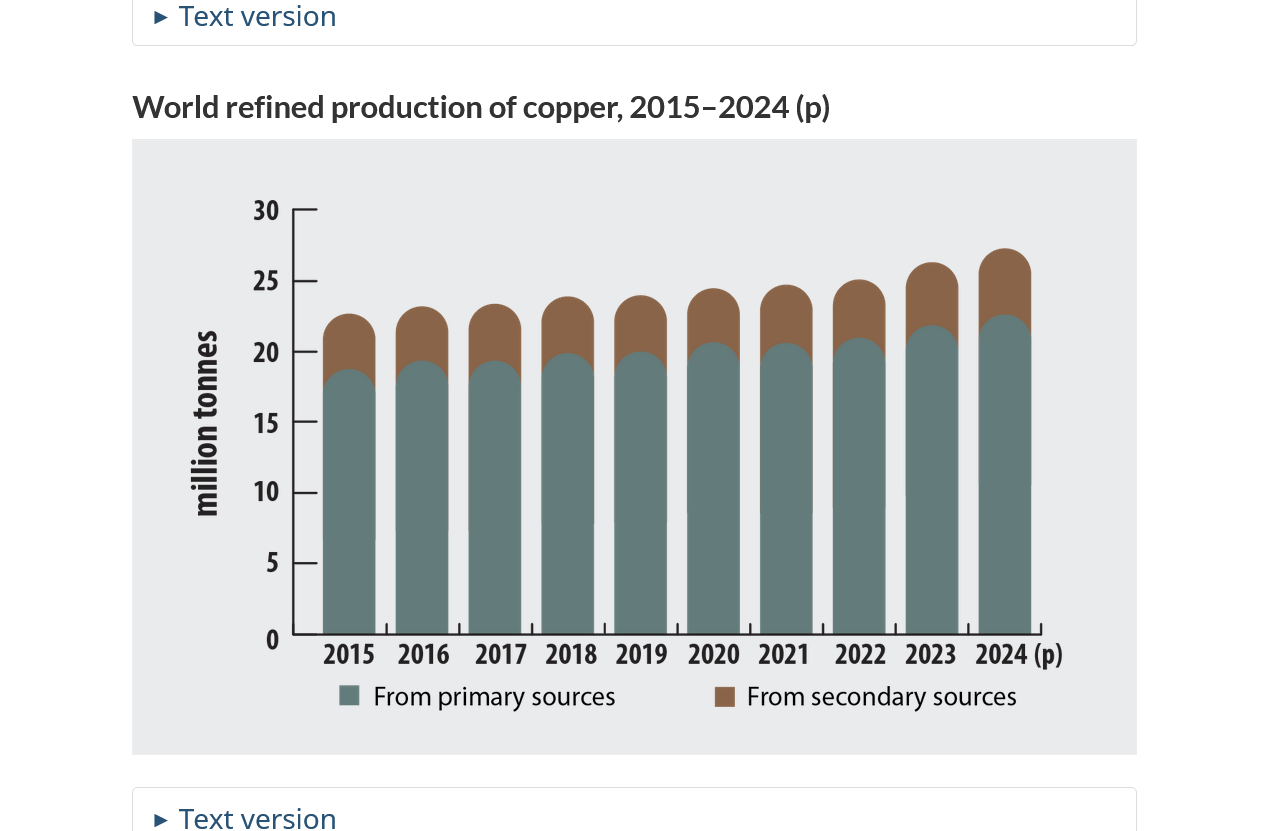
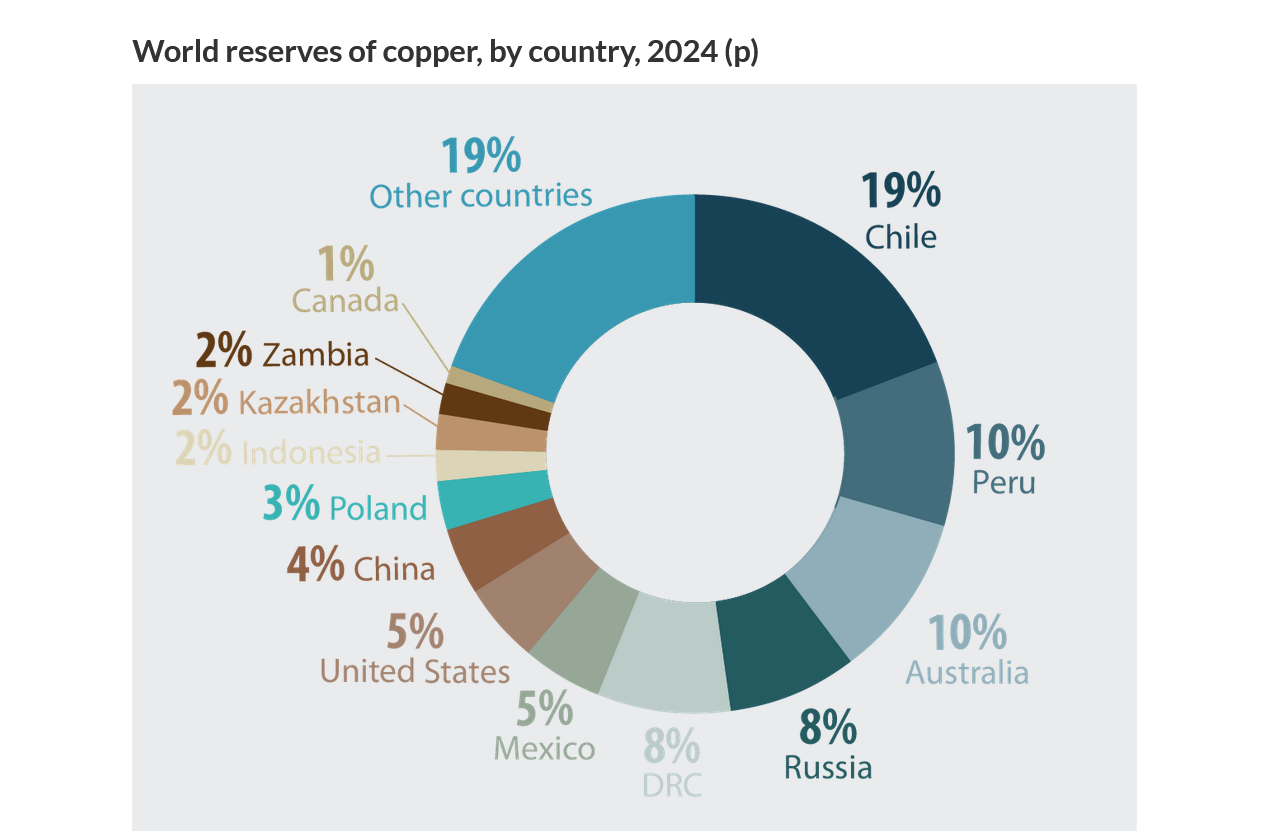
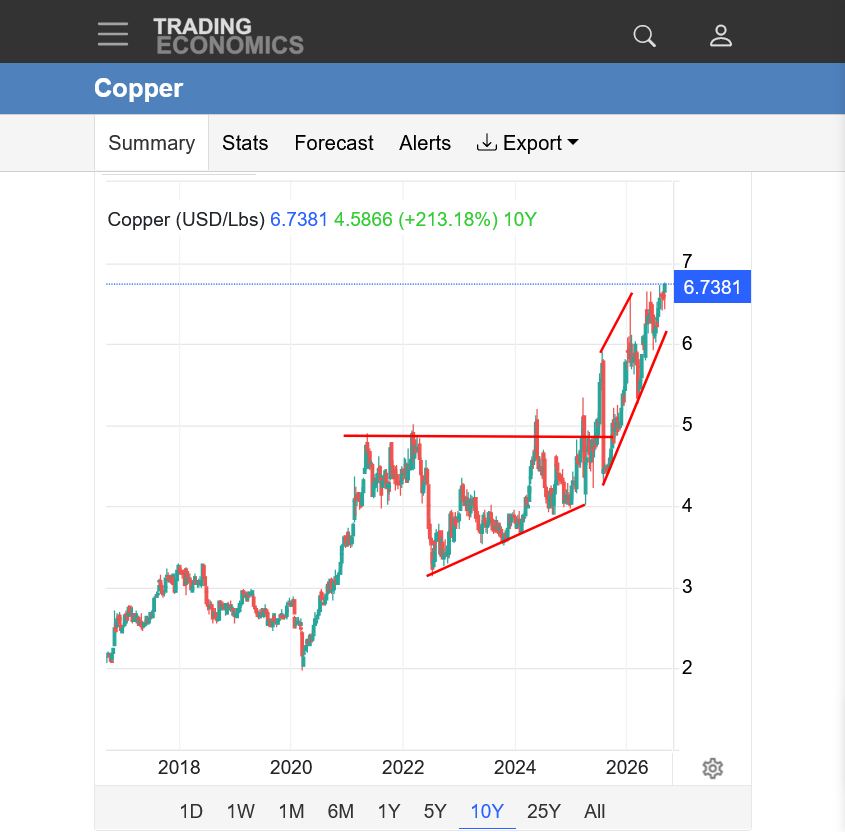
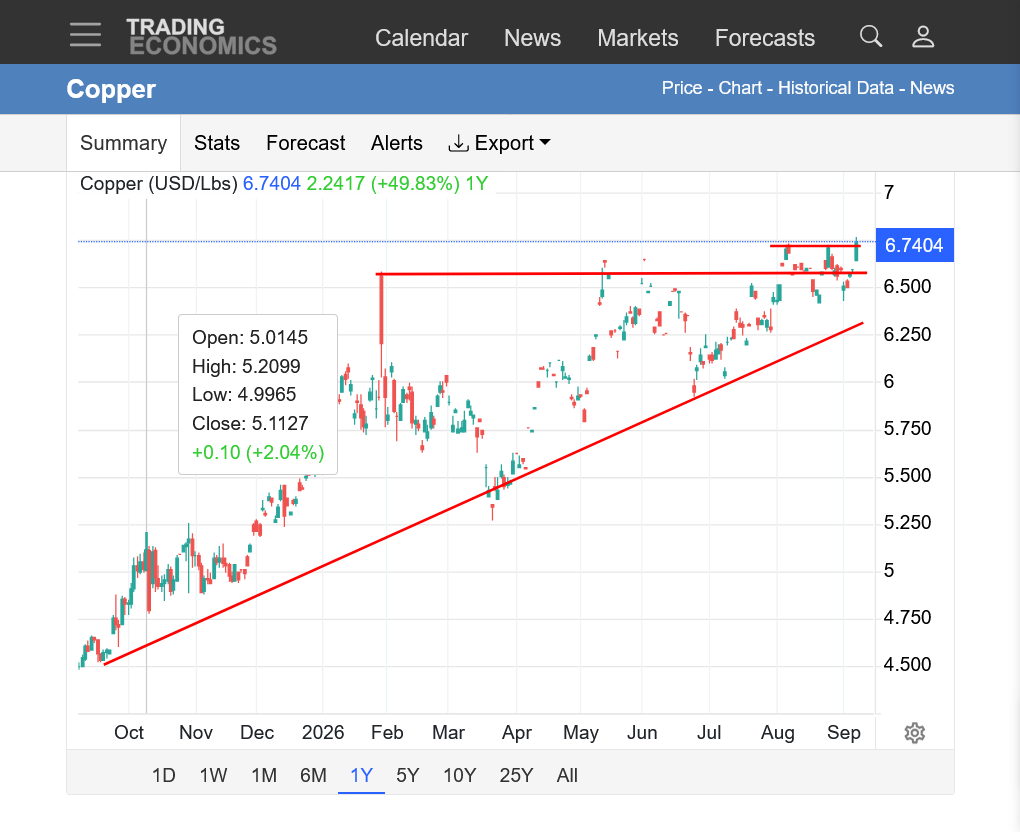
1. 10 year chart: Huge surge, doubling in price the past 5 years.
2. 1 year: Very BULLISH, ascending wedge/triangle. Breaking out to the upside? Will this previously strong resistance area hold back the bull charge upwards?
https://tradingeconomics.com/commodity/copper
AI Overview
+++++++++++++++++
Can the US produce enough copper for itself?
AI Overview
https://www.sciencedirect.com/science/article/abs/pii/S2214629626000526?via%3Dihub
++++++++++++
The United States produces about 1,000 kt of copper a year and ships roughly a third of it back out as ore and concentrate. The narrow point is smelting and refining, the midstream of the copper supply chain: the industrial capacity that turns concentrate into metal. Domestic refineries produce 850 kt against consumption near 2,200 kt, and imported metal covers the difference.